

Reviewed September 2026 against USDA NASS, USDA Economic Research Service, and University of Illinois/Ohio State Extension research.
Try it: Run your own numbers →
Crop rotation’s biggest documented upside is yield: University of Illinois researchers measured a 6.4% corn yield increase when corn follows soybean instead of continuous corn at standard nitrogen rates, and Midwest university trials show a 10% average soybean yield gain when soybean does not immediately follow soybean.1 The main downside is logistical — rotation forces more equipment, more marketing channels, and more planning than a single-crop system. Organic farming’s trade-off is starker: it costs $83-$125 more per acre to grow than conventional row crops, but earns $22-$66 more per acre at sale, a spread that does not close for every grower.2 This article works through both trade-offs with the actual USDA and university numbers behind them, plus where mixed crop-livestock systems fit into the same decision.
Table of Contents
- Crop Rotation Pros and Cons
- Organic Farming Pros and Cons
- The Organic Cost-Premium Math
- Mixed Crop and Livestock Systems
- Farming Pros and Cons: The Bigger Picture
- Rotation Yield Payoff Calculator
- Monitoring a Rotation or Organic Transition with Satellite Data
- FAQ
- Try it: Run your own numbers
Crop Rotation Pros and Cons
Crop rotation means growing different crops in planned sequence on the same land instead of the same crop year after year. The two most-studied US row-crop rotations are corn-soybean and corn-soybean-small grain. Here is what the research actually shows, sequence by sequence.
The Pros, With Numbers
- Corn after soybean yields more than continuous corn. A University of Illinois study found a 6.4% corn yield increase when corn is grown after soybean versus continuous corn, at standard nitrogen application rates — a real yield gain, not just a nitrogen-credit accounting trick.1
- Soybean after a small grain outperforms soybean after corn. USDA-ARS research recorded a 25% soybean yield improvement when soybean followed a small grain crop (such as wheat or oats) compared with following corn.3
- Just avoiding soybean-on-soybean helps. Multi-state Midwest university research puts the average soybean yield increase at 10% when soybean does not immediately follow soybean in the rotation — the soybean cyst nematode and disease-carryover mechanism is well established, though a specific US nematode-population-reduction percentage from rotation is not published; check your state’s plant pathology extension bulletin for local nematode-count data if that is the deciding factor for your field.4
- Rotation is the standard entry point for diversification-based risk management
The Cons
- More complexity, not less. A rotation needs separate equipment calibration, separate input planning, and often separate grain marketing contracts for each crop in the sequence — corn and soybean have different planting windows, different herbicide programs, and different storage handling.
- The yield benefit is not free. It requires the land actually growing a different crop in sequence, which means a farm built around one crop’s infrastructure (a single grain bin size, one set of planting equipment) faces real switching costs to add a second or third crop.
- Market dependence shifts, it does not disappear. Diversifying from one commodity to two means tracking two sets of futures and cash markets instead of one — see how corn and wheat futures have moved together and separately through recent planting-season shifts.
- Short rotations still leave disease and pest gaps. A simple two-crop corn-soybean rotation reduces but does not eliminate carryover pathogens and pests that both crops share; a three- or four-crop rotation closes more of that gap but adds the equipment and marketing complexity above.
Crop Rotation Pros and Cons at a Glance
| Rotation Sequence | Measured Effect | Source | Trade-off |
|---|---|---|---|
| Corn after soybean vs. continuous corn | +6.4% corn yield, standard N rate | University of Illinois | Requires soybean acreage and equipment in the mix |
| Soybean after small grain vs. after corn | +25% soybean yield | USDA-ARS | Adds a third crop (wheat/oats) to plan and market |
| Soybean not following soybean | +10% average soybean yield | Multi-state Midwest universities, Ohio State Extension | Cyst nematode/disease mechanism confirmed; no published US % reduction figure — check state extension for local counts |
Organic Farming Pros and Cons
Organic farming prohibits synthetic fertilizers, synthetic pesticides, and GMOs, replacing them with practices such as compost, cover crops, and — often — the same crop rotation discussed above, since USDA organic certification standards require a rotation plan as part of soil-fertility management. US certified organic cropland reached 3.6 million acres across 17,445 certified organic operations as of the 2021 Census of Agriculture, up 79% in organic cropland acreage between 2011 and 2021.5,6 The next Census of Agriculture, due 2027, will update both figures; in the interim, USDA NASS publishes annual estimates through its Organic Production Survey.
The Pros
- A documented price premium. USDA’s Economic Research Service tracks organic corn earning $51-$66 more per acre than conventional corn at sale, and organic soybean earning $22-$41 more per acre than conventional soybean.7,8
- Rotation is built in. Because certification requires a rotation and soil-fertility plan, organic operations get the yield and disease-break benefits described in the section above as a condition of certification, not an optional add-on.
- Growing acreage means growing market infrastructure. The 79% jump in organic cropland from 2011 to 2021 reflects expanding buyer networks and processing capacity, which lowers the search cost of finding an organic grain buyer compared with a decade ago.6
The Cons
- Production costs run higher. USDA ERS puts the organic corn production cost premium at $83-$98 more per acre than conventional, and organic soybean at $106-$125 more per acre than conventional — labor for mechanical weed control and the cost of approved inputs are the largest drivers.2
- The premium does not always clear the cost gap. Compare the ranges directly: organic corn’s price premium ($51-$66/acre) sits below its cost premium ($83-$98/acre) at the low-to-middle of both ranges, meaning the price premium alone does not guarantee organic corn out-earns conventional corn on every acre, every year — the math depends on which end of each range a given farm lands on.
- The 3-year transition period earns none of the premium. Land must be managed organically for three years before crops from it can be sold as certified organic, during which the farm carries organic production costs without organic sale prices.
- Certification is a fixed administrative cost layered on top of the per-acre production cost premium, and it recurs annually regardless of yield.
The Organic Cost-Premium Math
| Crop | Organic Cost Premium (per acre) | Organic Price Premium (per acre) | Net Position |
|---|---|---|---|
| Corn | +$83 to +$98 | +$51 to +$66 | Price premium can fall short of cost premium |
| Soybean | +$106 to +$125 | +$22 to +$41 | Price premium falls well short of cost premium on these figures |
These are USDA ERS national cost and price estimates and the underlying study years are not specified in ERS’s published summary; treat them as directional ranges, not this season’s numbers. For a current comparison, USDA NASS’s Quick Stats database publishes monthly organic-vs-conventional price spreads through its Agricultural Prices reports, and the full ERS methodology sits at USDA ERS’s organic agriculture topic page. Run your own farm’s actual input invoices and elevator or buyer contract prices against these two ranges before deciding — a premium that clears the gap in one county’s buyer market may not in another.
Mixed Crop and Livestock Systems
Where crop rotation and organic transition both point toward diversification, integrated crop-livestock systems take that a step further by combining grain or forage production with grazing livestock on the same operation. The clearest documented benefit is emissions-related: integrated crop-livestock systems show a 15% greenhouse gas emissions reduction compared with monoculture systems.9 Manure cycling back into cropland also reduces purchased-fertilizer need, though a specific dollar figure for that offset is not in the current research brief for this article — your local extension office or NRCS conservation planner can size that reduction against your actual herd size and acreage.
The trade-off is the same one crop rotation carries, scaled up: a mixed system needs livestock infrastructure (fencing, water, handling facilities) on top of crop equipment, and it needs a manager comfortable running both a livestock and a grain enterprise rather than specializing in one. For US and Canadian farms weighing this, the Community Alliance with Family Farmers’ integrated crop-livestock systems guide is a useful starting reference for sizing the transition.
Farming Pros and Cons: The Bigger Picture
Rotation, organic transition, and mixed crop-livestock systems are three specific answers to the same general question every farm operation weighs: concentrate on one crop and one system for simplicity, or diversify for resilience at the cost of complexity. Laid side by side:
| Approach | Documented Upside | Documented Downside |
|---|---|---|
| Crop rotation (corn-soybean or +small grain) | +6.4% to +25% yield gains depending on sequence | Added equipment, marketing, and planning complexity |
| Organic certification | $22-$66/acre price premium; 79% US cropland growth 2011-2021 | $83-$125/acre cost premium; 3-year uncompensated transition |
| Integrated crop-livestock | 15% lower GHG emissions vs. monoculture | Dual infrastructure and dual-skillset management |
None of these is universally correct. A grain operation with existing corn-soybean infrastructure and no livestock experience captures most of the rotation yield benefit above with the least added complexity. A farm already running cover crops and mechanical weed control is closer to clearing organic’s cost premium than one starting from a conventional herbicide program. The precision farming tools available to track field-level performance make it possible to measure which of these trade-offs is actually paying off on a specific farm, rather than relying on the national averages above.
Rotation Yield Payoff Calculator
Enter your own acreage, expected sale price, and which rotation sequence you’re considering to estimate the added revenue the University of Illinois and USDA-ARS yield figures above translate to on your farm.
Run your own numbers
Assumptions: applies the single percentage yield figure from the cited study directly to your baseline yield, holds price and acreage constant, and does not account for input cost differences between rotation sequences, weather variability, or basis/local price adjustments. It excludes equipment, storage, and marketing costs specific to adding a new crop to your rotation.
Monitoring a Rotation or Organic Transition with Satellite Data
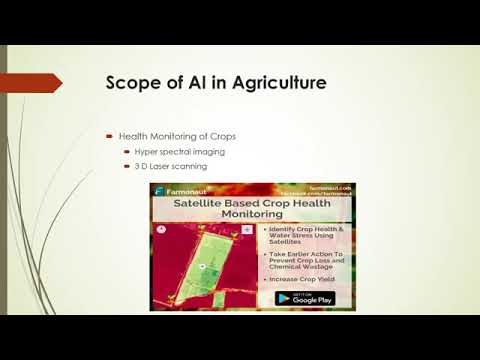
Whichever path a farm chooses, the same measurement problem follows: rotation, organic transition, and mixed systems all take multiple seasons to show their yield and soil-health effects, and it is easy to lose track of which field is on which year of a sequence. Satellite-based crop health monitoring gives a field-by-field record that survives beyond one manager's memory.

What to Track Through a Rotation Cycle
- NDVI vegetation health by field, so a corn-after-soybean field's performance can be compared against a continuous-corn field on the same farm in the same season.
- Soil moisture trends across rotation years, useful for spotting whether a small-grain year in the sequence is building or depleting moisture reserves ahead of the following soybean crop.
- Pest and disease detection to confirm whether a rotation sequence is actually suppressing the carryover pests and pathogens it is designed to interrupt on a specific field, rather than assuming the national research figures apply uniformly.

The Jeevn AI advisory system layers customized crop management guidance, weather alerts, and yield prediction on top of that satellite data, which matters most during a multi-year rotation or a three-year organic transition, when the cost of a missed pest window or a misjudged irrigation decision compounds against a smaller margin than a conventional single-crop operation carries.

Farm Data Management Across a Rotation Sequence
A rotation or organic transition generates more records to track than a single-crop operation — separate input logs, separate yield histories, and (for organic) the certification paperwork proving three years of compliant management. Centralized farm data management keeps that history field-by-field and season-by-season, which is also the record an organic certifier or a crop insurance adjuster will ask to see.
For row-crop operations layering pest scouting onto a rotation decision, the corn and soybean scouting guide covers pest-management timing specific to Midwest corn-soybean sequences.

Explore Farmonaut's monitoring tools for tracking a rotation or organic transition:



Developers building rotation or organic-tracking tools of their own can integrate directly via the API page and the API Developer Documentation.
FAQ
Q: What are the main pros and cons of crop rotation?
A: The documented pros are yield gains — 6.4% for corn after soybean versus continuous corn (University of Illinois), 25% for soybean after a small grain versus after corn (USDA-ARS), and 10% average for soybean not following soybean (Midwest university research) — plus reduced disease and pest carryover. The main con is added complexity: separate equipment calibration, input planning, and marketing for each crop in the sequence.
Q: What are the pros and cons of organic farming?
A: Pros: a $51-$66/acre corn and $22-$41/acre soybean price premium over conventional, plus built-in rotation requirements under certification. Cons: an $83-$98/acre corn and $106-$125/acre soybean production cost premium, a three-year transition period earning no organic premium, and recurring certification costs (USDA ERS).
Q: Does organic farming actually pay more than conventional?
A: It depends on where a farm's costs and prices fall within USDA ERS's published ranges. Organic corn's price premium ($51-$66/acre) can sit below its cost premium ($83-$98/acre) at the low-to-middle of both ranges; soybean's price premium ($22-$41/acre) sits below its cost premium ($106-$125/acre) across the ranges as published. Run your own input and sale prices against these ranges rather than assuming the premium clears the gap.
Q: How much US farmland is certified organic?
A: 3.6 million acres across 17,445 certified organic operations, per the 2021 Census of Agriculture — up 79% in organic cropland from 2011 to 2021. The next full Census updates in 2027; USDA NASS's annual Organic Production Survey covers the years between.
Q: Do mixed crop and livestock systems fit into this comparison?
A: Integrated crop-livestock systems are a further diversification step beyond rotation, showing a 15% greenhouse gas emissions reduction versus monoculture. They carry the same complexity trade-off as rotation and organic transition, scaled to include livestock infrastructure and management on top of crop planning.
Q: How does satellite monitoring help during a crop rotation or organic transition?
A: It provides field-by-field NDVI, soil moisture, and pest/disease data across the multiple seasons a rotation sequence or three-year organic transition spans, creating a record that confirms whether the sequence is delivering the yield and disease-suppression effects the research documents on that specific field, and that supports certification or insurance documentation.
Q: Where can I get more current organic price and cost figures than the ranges cited here?
A: USDA NASS's Quick Stats database publishes monthly organic-vs-conventional price spreads, and USDA ERS's organic agriculture topic page updates cost-of-production methodology and estimates periodically.
Sources: 1. University of Illinois ACES · 2. USDA ERS, Organic Agriculture · 3. USDA-ARS, Rotational Cropping Sequence Study · 4. Ohio State University Extension · 5,6. USDA NASS, 2021 Census of Agriculture Organic Highlights · 7,8. USDA ERS, Rising Consumer Demand Reshapes Landscape for U.S. Organic Farmers · 9. Community Alliance with Family Farmers

 Godrej Agrovet
 Hayleys Agriculture
 Linx Agritech
 Adinet
 Save Your Soils
 GalaxEye Space
 Grandstream Algérie
 XOS Realty
 Geospatial Lab Africa
 Agro La Gándara
 HIPSAC
 ZOL Zimbabwe
 Juligerm
 AdBio
AdBio MISE Maroc
 NWNS
NWNS Red August Group
 Farm Inc
 WeMe Global
 Agrotoken
 Blue BearX
 Insignito
 DnCubed
 Indosistim Teknologi
 Liquify Digital
 CU Foods
 BeyondTech Global
 Rouge VC
 AgroRisk
 Oath Inc
 Esri North East Africa
 MDCV UK
 Etech Consulting Madagascar
 Vestlandsforsking
 WB Dev
 Sama Premium
 Tres Valles
 Blickwinkel
 Agricultural Credit Policy Council
 eKGIS
eKGIS Mostas Tech
 Andex
Andex Deluxe Conseil
 WICO
WICO Chimera Innovation
 SkyHarvest
 Teledarbas
 Exurbia Geospatial
 FieldZero
