

Reviewed August 2026 against USDA NASS (2022 Census of Agriculture), USDA Economic Research Service, and Defra’s UK Farm Business Survey.
Try it: Run your own numbers →
Farm management software (FMS) is a digital system — web-based, mobile, or both — that replaces paper logs and spreadsheets with centralized records for breeding, feed, health, fields, and finances. Online farm management software runs on a browser or app instead of installed desktop programs, so data updates in real time across every device on the farm. The category covers row-crop and livestock operations of every size, including specialist niches like rabbit herds and ratite (ostrich, emu) enterprises, where the same record-keeping logic applies to different animals.
This guide answers the plain question first — what is farm management software, what does agri farm management software solution actually include, and what should a US or UK operation pay — before going deep on rabbit farm management software specifically, since herd producers searching for this tool have distinct needs (litter tracking, feed conversion ratios per doe, weaning-rate dashboards) that generic crop-focused platforms often bolt on as an afterthought.
Table of Contents
- What Is Farm Management Software?
- Who Uses It: US Farm Numbers and Adoption Rates
- How Farm Management Software Changes Daily Operations
- 7 Ways It Boosts Efficiency — Rabbit Herds and Beyond
- Farm Management Software UK: What’s Different
- Rabbit and Ratite Farm Management: Software Gaps
- Traditional Records vs. Software: A Comparison
- Calculator: Rabbit Herd Feed Cost & Breakeven
- Farmonaut: Satellite and AI for Diversified Operations
- Checklist: Choosing a Farm Management Software Solution
- FAQs
- Conclusion
- Try it: Run your own numbers
What Is Farm Management Software?
At its core, farm management software is a record system: it stores what happened (a litter was weaned, a field was sprayed, a feed batch was mixed), calculates what that means (feed conversion ratio, cost per unit, mortality rate), and surfaces it on a dashboard so a producer can act before a small problem becomes an expensive one. An online farm management software solution does this through a web browser or app rather than a locally installed program, which is why most current platforms — including specialist rabbit and diversified-estate tools — are built cloud-first.
The category splits along two lines: general-purpose crop and livestock FMS built for row crops, dairy, and beef, and niche builds for smaller-volume enterprises like rabbits, poultry, and ratites, where herd sizes are smaller but per-animal tracking (breeding line, weaning weight, feed intake) matters just as much. A genuine agri farm management software solution should flex across both without forcing a rabbit operation to repurpose a dairy herd module.

Who Uses It: US Farm Numbers and Adoption Rates
The 2022 Census of Agriculture counted 1,900,487 farms in the United States, covering 880 million acres, for an average farm size of 463 acres, according to USDA NASS. Within that population, adoption of digital and precision tools is uneven by farm size and enterprise type. USDA’s Economic Research Service reports that automated GPS guidance — the entry point for most digital farm management — is used on more than 50% of planted acreage for corn, cotton, rice, sorghum, soybeans, and winter wheat, while more advanced tools like yield mapping, soil mapping, and variable-rate application sit at 5-25% of acreage for wheat, cotton, sorghum, and rice (USDA ERS).
Adoption also scales with farm size: ERS data shows 70% of large-scale crop farms run automated guidance systems versus 52% of midsize farms. That gap is the clearest evidence of a cost and complexity barrier — smaller producers, including most rabbit and ratite operations, are the segment least served by software built for 5,000-acre grain farms and most in need of a lighter, cheaper alternative.
Rabbit production itself is a small but persistent niche: the 2022 Census recorded 3,058 US farms selling rabbits and 439,000 rabbits sold nationally, per Iowa State University’s Agricultural Marketing Resource Center, which compiles USDA NASS figures. That works out to roughly 144 rabbits sold per reporting farm — a scale where a $500-per-month enterprise-grade dairy platform is the wrong tool, but a spreadsheet stops working somewhere around 50-100 does. This is precisely the gap that drives searches for rabbit management software, rabbit herd management tool, and rabbit farm software subscription: producers who have outgrown paper but don’t need — or can’t justify — row-crop-scale software.
Federal research funding backs the broader precision-ag push: NSF and USDA jointly committed close to $200 million to precision agriculture research between 2017 and 2021 (USDA ERS). USDA NASS Quick Stats publishes updated adoption figures quarterly at quickstats.nass.usda.gov, and 2025/2026 practice-adoption data should post within six months of each calendar year’s end — check there directly for numbers newer than this review.
How Farm Management Software Changes Daily Operations
Whether the enterprise is 2,000 acres of soybeans or a 200-doe rabbitry, the software’s job is the same: unify scattered records into one searchable system. In practice that means:
- ✓ Centralized breeding and health record-tracking
- 📊 Feed formulation and inventory optimization
- ⚠ Automated disease alerts and welfare monitoring
- ✔ Real-time decision support via dashboards
- 🚦 Regulatory compliance and traceability
Modular platforms extend these same functions into forestry nurseries, timber plots, or operations that border mineral-extraction sites, since the underlying data model — location, date, input, output, cost — doesn’t change between a litter of kits and a stand of timber. A diversified operation might use one software ecosystem to track rabbit breeding cycles and weaning data, manage timber stand inventories, schedule thinning treatments, and log soil amendments across both crop ground and buffer zones.
Key Insight
Integrating livestock, crops, forestry, and mining-adjacent activities within a single digital management framework produces measurable cost savings and easier regulatory alignment across an entire estate — but only if the record-keeping structure fits the enterprise. A rabbit operation forced into a row-crop data model will abandon the software within a season.
7 Ways Farm Management Software Boosts Efficiency
-
1. Centralized Record-Keeping for Breed and Herd Management
Rabbit farm management software tracks breeding cycles, litter data, weaning rates, mortality records, and genetic-line performance in one searchable platform. Producers identify productive bloodlines and manage replacements without digging through paper cards, and every record is backed up automatically instead of living in a single notebook.
-
2. Feed Formulation and Cost Optimization
Software catalogs feed types, ingredient weights, and cost per unit, so a producer can compute feed conversion ratios and spot waste. Batch-level formulations control costs at the pen or litter level, and inventory forecasting prevents both stockouts and over-ordering — the two most common ways a small feed budget gets blown.
-
3. Health and Welfare Monitoring With Automated Alerts
Modern FMS platforms integrate vaccination schedules, health dashboards, and alert triggers for anomalies in temperature, humidity, or feed intake. Quarantine workflows and asset tagging build in the traceability that audits and buyer certifications increasingly require.
-
4. Resource Planning for Multi-Unit and Diversified Operations
For operations that combine rabbits, timber, or buffer-zone farming, unified planning tools handle planting-cohort and timber-stand tracking, mapping of thinning and rotation schedules, and batch scheduling across fields, pastures, and timber estates in one interface instead of three separate systems.
-
5. Market Readiness and Financial Analytics
Growth analytics at the pen, litter, or herd level, cost-per-unit calculations for feed, labor, and housing, and profitability benchmarking by breed or batch turn raw records into a market-timing decision instead of a guess.
-
6. Regulatory Compliance and Traceability
Blockchain-based or ledger-style traceability features record every production stage, which demonstrates compliance to buyers who require it and supports site rehabilitation and environmental stewardship documentation for operations near mining or mineral-extraction areas.
-
7. Mobile and Web Accessibility for On-the-Go Operations
A true web-based farm management software solution delivers mobile-friendly dashboards across barns, fields, and remote sites, real-time task alerts, and extension APIs for integration with external analytics tools or hardware — letting an operator check temperature, humidity, feed allocation, and asset tags from a phone in the barn aisle.

Farm Management Software UK: What’s Different
UK searches for farm management software carry different reference points than US ones: Defra regulation, the Farm Business Survey, and post-Brexit Environmental Land Management scheme reporting instead of USDA programs. Defra’s Farm Business Survey samples roughly 1,500 farms annually and has run for more than 80 years, tracking financial and physical farm performance across England. It does not currently publish a disaggregated breakdown of which software tools those farms use — that specific figure (percentage of UK farms running a named FMS platform) is a published gap, not something this article will estimate. The Survey releases a new annual edition each fiscal year, with the 2025-26 edition expected by January 2026 to reflect current adoption and technology-investment trends; check the link above directly when it posts.
What UK producers can act on now: any FMS solution used on a UK holding should export data in a format usable for Basic Payment Scheme successor reporting and be priced in pounds sterling, since currency mismatches and non-UK compliance templates are the fastest way a “farm management software solution” search ends in a platform that has to be replaced within a year.
Rabbit and Ratite Farm Management: Software Gaps
Rabbit herd management software and ratite farm management app searches reflect a real product gap: most FMS vendors build for dairy, beef, or row crops first, and rabbits or ratites (ostrich, emu) get a generic “other livestock” module if they get one at all. There is no USDA or government-published figure for average US rabbit farm size, per-farm production costs, or typical software pricing for this segment — the Census of Agriculture reports the aggregate 3,058 farms and 439,000 rabbits sold nationally but does not break that down per operation. A producer sizing their own budget should request quotes directly from vendors rather than rely on a published benchmark, since none currently exists for this niche.
Similarly, no peer-reviewed, cross-farm-type study currently quantifies the productivity gain (labor hours saved, yield or output improvement) attributable to FMS adoption specifically for rabbit or ratite operations. Vendor marketing claims in the 20-30% range circulate widely but are not independently validated across farm types — treat any such number, including ones on this site, as a vendor estimate rather than a government or academic statistic unless a source is cited alongside it.
What a rabbit or ratite producer can verify for their own operation: track data-entry time and feed cost for one full cycle under the current paper or spreadsheet system, then run the same cycle under trial software, and compare directly. That head-to-head comparison — not an industry-wide average — is the number that should drive a purchase decision at this scale.

Pro Tip
Before committing to a paid rabbit farm software subscription, run a 90-day trial against your actual herd records rather than a vendor demo dataset. A platform that handles a 500-doe demo smoothly can still choke on the specific mix of breeding lines, feed batches, and pen layouts your operation actually runs.
The Role of Data and Dashboards
Farm management dashboards move beyond record-keeping into decision support:
- 📊 Actionable Analytics: Track rabbit growth, soil health, or forestry inventories at a glance.
- 🗺 Field Mapping: Visualize farm landscapes, pen locations, or crop beds in one interactive digital map.
- 📅 Task Automation: Sync animal routines, health interventions, and batch harvests to schedules with automated alerts.
- 🔄 API Integration: Connect with fleet management or traceability modules for end-to-end oversight.




Traditional Records vs. Farm Management Software
The table below compares process categories where digital record-keeping structurally changes the work — these describe the mechanism of the change (fewer manual lookups, automated alerts vs. periodic checks), not a validated industry-wide percentage, since no government or peer-reviewed source publishes cross-farm productivity gains for this comparison.
| Process | Traditional (Paper/Spreadsheet) | With Farm Management Software |
|---|---|---|
| Breeding and litter records | Individual paper cards or separate spreadsheet tabs per doe | Single searchable database, filterable by bloodline or date |
| Disease/health alerts | Manual visual checks on a fixed schedule | Automated threshold alerts for temperature, humidity, intake |
| Feed cost tracking | Manual reconciliation against receipts, monthly | Per-batch cost and conversion ratio, updated per entry |
| Multi-site oversight | Phone calls or on-site visits required | Remote dashboard access from any device |
| Regulatory/traceability audit prep | Manual compilation of paper trail | Exportable digital record, timestamped |
To generate a number specific to one operation instead of a generic claim: log hours spent on data entry and reconciliation for four consecutive weeks under the current system, then repeat the measurement after 60-90 days on trial software. That before-and-after figure, not an industry average, is the one worth acting on.

Calculator: Rabbit Herd Feed Cost and Breakeven
Since no published benchmark exists for rabbit-farm feed economics at this scale, use this calculator with your own numbers to see monthly feed cost per doe and the sale price needed to break even — the same math a feed-cost module inside farm management software runs automatically per batch.
Run your own numbers
Farmonaut: Satellite and AI for Diversified Operations
Farmonaut provides web-based and mobile satellite monitoring and AI-driven advisory tools built for diversified estates — operations that combine crops, livestock like rabbits, forestry, and land near mineral-extraction sites under one management structure.
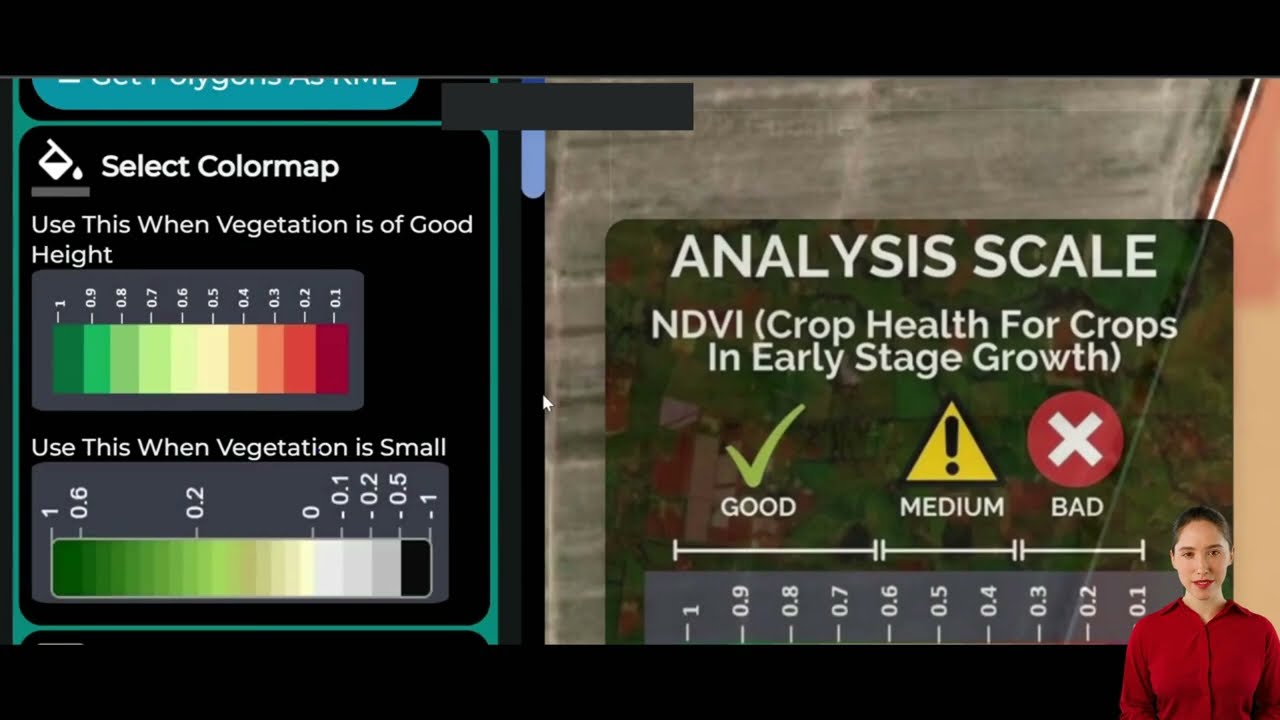
What Farmonaut Adds to a Farm Management Software Stack
- ✔ Satellite-based monitoring for fields, forestry, nurseries, and livestock environments
- ✔ AI-powered advisory systems for day-to-day farm decisions
- ✔ Traceability tools that support compliance documentation and buyer trust
- ✔ Fleet management for logistics and operating-cost control (learn more here)
- ✔ Environmental impact analytics to track carbon footprint
- ✔ API access for custom integrations: Farmonaut API | Developer Docs

These tools support agriculture, mining-adjacent land, and infrastructure oversight from a single dashboard, whether the underlying operation is a boutique rabbitry or a multi-thousand-acre estate. See Farmonaut’s large-scale farm management approach in the Agro Admin App Overview, or explore planting schedules, growth projections, and silvicultural advisory tools via Crop Plantation and Forestry Advisory Tools. For supply-chain and certification audit needs, the traceability module tracks provenance from farm to market.

Checklist: Choosing a Farm Management Software Solution
Common Mistake
Buying software sized for a 5,000-acre grain operation to manage a 20-doe rabbitry, or the reverse — trying to run a 2,000-acre farm on a lightweight herd tracker. Match the software’s designed scale to the 463-acre US average, or below it, or above it, based on your actual footprint (USDA NASS, 2022).
Farm Data Security Tip
Use strong, unique passwords and confirm the platform has automated backup and data recovery before migrating years of breeding or field records onto it. Verify export options exist so records are never locked into one vendor.
- ✔ Enterprise fit: does it have a real rabbit/livestock module, not a repurposed dairy template?
- ✔ Pricing transparency: published monthly or annual cost, not “contact sales” only
- ✔ APIs for data export and analysis
- ✔ Mobile and web access for on-the-move management
- ✔ Batch and cohort tracking for genetics and breeding workflows
- ✔ Free trial period long enough to run one full production cycle
On pricing specifically: no USDA, Defra, or other government body publishes an official farm-software pricing survey. Market-research estimates circulating online cite ranges from roughly $10 to $500 per month depending on farm size and feature set, but these are vendor-market estimates, not audited figures — request a quote directly from each shortlisted vendor rather than budgeting off a third-party range.
FAQs
What is farm management software, in plain terms?
It’s a digital system — usually web-based or app-based — that replaces paper and spreadsheet records with centralized tracking for breeding, feed, health, field activity, and finances, then turns those records into dashboards and alerts a producer can act on.
Is online farm management software suitable for remote or multi-site operations?
Yes. Web-based systems allow dashboard access, animal health tracking, inventory, and environmental data from any device, which suits producers managing multiple fields or sites without being physically present at each.
How is rabbit management software different from general farm software?
Rabbit-specific tools track per-doe breeding cycles, litter and weaning data, and feed conversion at a smaller unit scale than row-crop or dairy platforms are built for. A generic FMS without a dedicated small-livestock module often forces awkward workarounds for litter-level tracking.
Does farm management software help with regulatory compliance and traceability?
Platforms with traceability modules record production stages in an exportable, timestamped format that supports certification audits and buyer compliance requirements, including animal welfare and market-readiness documentation.
Where can I find current adoption and pricing data instead of relying on this article?
USDA NASS Quick Stats (quickstats.nass.usda.gov) updates precision-ag and practice-adoption figures quarterly. Defra’s Farm Business Survey publishes a new annual edition each fiscal year for UK figures. Neither currently publishes rabbit-farm-specific software pricing, so request quotes directly from vendors for that figure.
Conclusion
Farm management software, at its most useful, is a centralized alternative to paper and spreadsheets for breeding, feed, health, and financial records — whether the enterprise is a 463-acre US row-crop average, a UK holding reporting into the Farm Business Survey, or one of the 3,058 US farms selling rabbits counted in the 2022 Census. The durable way to evaluate any platform, in this niche or any other, is not a vendor’s efficiency-gain percentage but a direct before-and-after measurement on your own operation: log data-entry hours and feed costs for one cycle under your current system, then repeat under trial software, and compare.
For diversified estates that combine rabbits, crops, forestry, or land near mineral-extraction activity, satellite and AI tools add a layer that pure record-keeping software doesn’t: real-time field and environmental monitoring layered on top of the same centralized data structure.

 Godrej Agrovet
 Hayleys Agriculture
 Linx Agritech
 Adinet
 Save Your Soils
 GalaxEye Space
 Grandstream Algérie
 XOS Realty
 Geospatial Lab Africa
 Agro La Gándara
 HIPSAC
 ZOL Zimbabwe
 Juligerm
 AdBio
AdBio MISE Maroc
 NWNS
NWNS Red August Group
 Farm Inc
 WeMe Global
 Agrotoken
 Blue BearX
 Insignito
 DnCubed
 Indosistim Teknologi
 Liquify Digital
 CU Foods
 BeyondTech Global
 Rouge VC
 AgroRisk
 Oath Inc
 Esri North East Africa
 MDCV UK
 Etech Consulting Madagascar
 Vestlandsforsking
 WB Dev
 Sama Premium
 Tres Valles
 Blickwinkel
 Agricultural Credit Policy Council
 eKGIS
eKGIS Mostas Tech
 Andex
Andex Deluxe Conseil
 WICO
WICO Chimera Innovation
 SkyHarvest
 Teledarbas
 Exurbia Geospatial
 FieldZero
