

Farm Monitoring & Precision Feeding Software: What Works
Reviewed August 2026 against USDA’s Economic Research Service, the National Chicken Council’s broiler performance data, and the Livestock and Poultry Environmental Learning Community.
Try it: Run your own numbers →
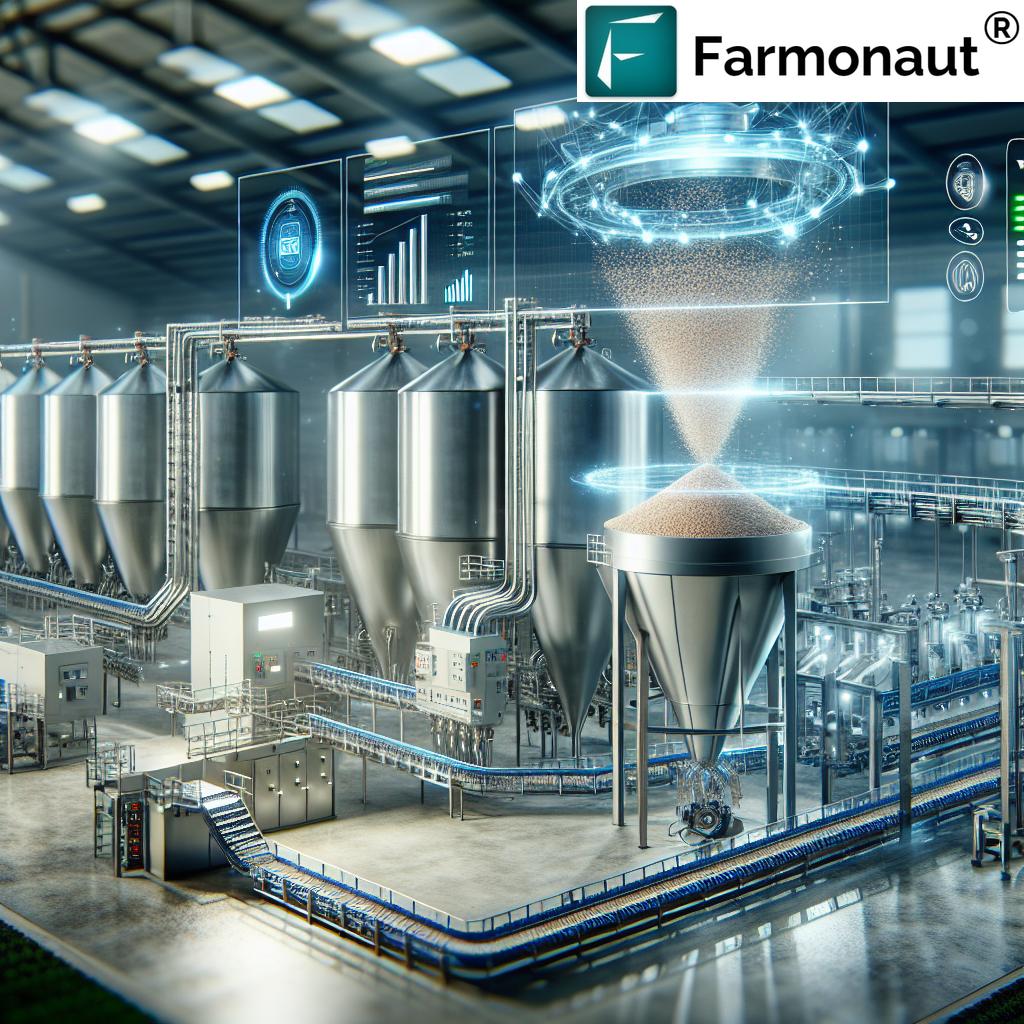
Farm monitoring is the practice of tracking field and livestock conditions with satellite imagery, sensors, and connected software instead of walking every acre or pen by hand. Remote crop monitoring systems handle the field side — vegetation health, soil moisture, weather risk — on a dashboard you can check from a phone. Precision feeding software and precision feeding apps do the equivalent job on the livestock side, turning a mill and mixer into a system you can formulate, run, and audit without standing next to it. Farmonaut builds both halves of that stack: satellite-based crop monitoring through its API, and on-farm mill and mix hardware for precision feed production.
What Counts as Farm Monitoring and Remote Crop Monitoring Systems
A remote crop monitoring system typically combines three data layers: satellite vegetation indices (to flag stress before it’s visible on the ground), soil moisture or weather feeds, and a mapping interface that ties both to specific fields. Farmonaut’s weather layer is documented in its satellite weather API developer docs, which cover the same data a remote farm monitoring dashboard pulls from behind the scenes.
The gap this page exists to close is adoption, not awareness. USDA’s Economic Research Service tracked aerial imagery use — the closest official proxy for remote crop monitoring — at 7.0% of planted corn acres in 2016 and 9.8% of planted soybean acres in 2018, against 3.5% of winter wheat acres in 2017, 4.6% of sorghum acres in 2019, and 2.8% of cotton acres in 2019, per USDA ERS, “Aerial imagery remains mostly grounded on U.S. farms”. Those are the most recent crop-specific figures ERS has published per crop; USDA re-surveys through its Agricultural Resource Management Survey on a rolling basis, so check that chart page directly for any update before citing these numbers elsewhere.
Remote Farm Monitoring by Operation Size: Who’s Actually Using It
Adoption looks different once you separate remote monitoring from the broader precision-ag toolkit and split by farm size. Guidance autosteering — the most-adopted precision technology overall — reached 52% of midsize farms and 70% of large-scale crop-producing farms in 2023, up from single-digit adoption in the early 2000s. Yield monitors, yield maps, and soil maps together reached 68% of large-scale crop-producing farms in the same year, according to USDA ERS’s December 2024 chart on precision agriculture adoption by farm size. Small family farms — those under $350,000 in gross cash farm income — sit below both groups on every technology ERS tracks.
That size gradient matters for remote farm monitoring specifically: satellite-based systems break the size dependency that guidance systems and variable-rate equipment carry, because there’s no per-acre hardware cost. A monitoring dashboard covers 40 acres or 4,000 for the same subscription price, which is the practical argument for a smaller dairy, poultry, or mixed-livestock operation to adopt remote monitoring even where it has skipped autosteering or VRT.
Feeding Software for Farms and the Precision Feeding App
Feeding software for farms is the layer that sits between the mill and the animal: it stores the ration formula, schedules the batch, logs what actually got mixed, and lets you change a formulation from a phone instead of a control panel bolted to the mill. A precision feeding app is the mobile front end of that same system — the piece that turns “check the mixer” into a push notification.
Farmonaut’s web app is reachable directly, and the Android and iOS builds cover the same feed-management functions from a phone: real-time production monitoring, formulation edits, and equipment alerts. Animal nutrition automation, in this context, means the system adjusts feed delivery or flags a deviation on its own — not that a person stops checking it, but that the checking happens through exception alerts rather than a walk-through.


Precision Feeding Machines: Inside a Mill & Mix System
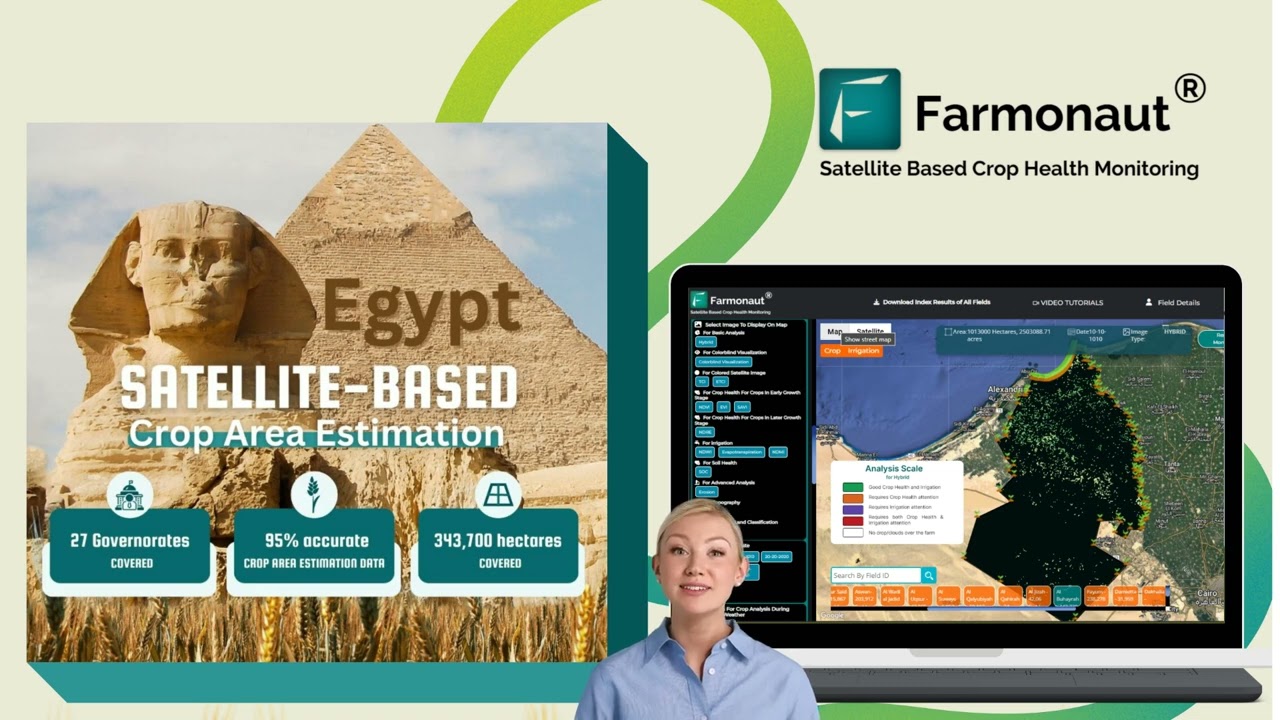
Precision feeding machines, in the mill-and-mix sense, are the hardware that grinds, blends, moves, and stores the ration:
- Mill equipment: disc mills and hammermills sized to grind ratio-appropriate particle size for the target species.
- Mixing units: paddle or ribbon mixers built for consistent nutrient distribution batch to batch.
- Conveying: augers and conveyors that move ingredients through the line without manual handling.
- Storage: sensor-equipped silos and bins tracking moisture, temperature, and inventory in real time.
- Remote monitoring: the connection between the hardware above and the feeding software described in the previous section.
The table below is the comparison an AI-generated summary can’t give you, because it depends on your existing setup, not a general definition of “mill and mix”:
| Feature | Conventional stand-alone mill/mixer | Farmonaut mill & mix system |
|---|---|---|
| Remote monitoring | None; formulation changes require being on-site | Real-time monitoring and formulation changes via app or web |
| Inventory and storage tracking | Manual checks of silo levels and moisture | Sensor-based silo tracking integrated with the mixing schedule |
| Batch traceability | Paper logs or none | Automated batch and ingredient-source logging |
| Farm software integration | Typically standalone, no data export | Connects to broader farm data management via API |
| Expansion path | Often requires replacing the whole unit | Modular components added as production grows |
On the energy side, mill design choices move the number more than any single “smart” feature: feed and additive engineering literature documents that raising fat concentration in the ration from 2% to 5.5% before pelleting cuts pelleting energy consumption by roughly 30% by lubricating the die, and that motor efficiency matters because motors account for more than 85% of a feed mill’s total electrical load. Those are mill-design levers you can specify regardless of which control software you run on top.
The Economics of Feed: Why Costs Are Moving
Feed is the single largest production-expense line for hog, poultry, and dairy operations — larger than for beef cattle farms, where purchased livestock dominates instead — per USDA ERS’s chart on the composition of farm production expenses by commodity specialization. That single fact is why feed-side software gets scrutinized harder than almost any other farm technology purchase: a percentage-point improvement in feed efficiency moves the largest number on the expense sheet.
USDA ERS’s farm sector income forecast, last updated May 19, 2026, put total U.S. farm sector feed spending at $65.6 billion for 2026 — down $4.8 billion, or 6.8%, from 2025, continuing a decline that began in 2023. That implies a 2025 feed-spending total of roughly $70.4 billion (the 2026 figure plus the reported decline). Total farm sector production expenses across all categories are forecast at $477.7 billion for 2026, up $4.6 billion (1.0%) in nominal terms from 2025 but down $4.5 billion (0.9%) once adjusted for inflation. ERS revises this forecast on a set schedule through the year, so check the farm sector income forecast page directly for the current release rather than relying on this snapshot indefinitely.
A Century of Feed Conversion Gains — and What Comes Next
Feed conversion ratio (FCR) — pounds of feed per pound of liveweight gain — is the number precision feeding is ultimately trying to move, and it has a documented, checkable history for broilers. The National Chicken Council’s published broiler performance table shows FCR falling from 4.7 in 1925 (112 days to reach 2.5 lb) to 2.5 in 1960 (63 days to 3.35 lb), to 1.95 in 2000 (47 days to 5.03 lb), to 1.70 in 2025 (47.5 days to 6.63 lb) — a 64% efficiency gain over a century, per National Chicken Council, U.S. Broiler Performance. That table is republished annually, so a reader checking this page after 2025 should pull the current-year row from that link rather than assume 1.70 still holds.
The dairy side shows the same mechanism at smaller scale: reformulating a diet from roughly 18% crude protein to roughly 17%, with amino acids balanced rather than protein simply cut, held milk production steady while predicted urinary nitrogen excretion fell 17.3% (from 289 to 239 grams per day) in a case study documented by the Livestock and Poultry Environmental Learning Community, citing Harrison et al. This is the durable mechanism behind “precision nutrition”: matching supply to the animal’s actual requirement, not a blanket increase in feed volume, and it’s the same logic remote monitoring and mill software are built to execute automatically.
Animal Nutrition Automation: Precision Nutrition Without Guesswork
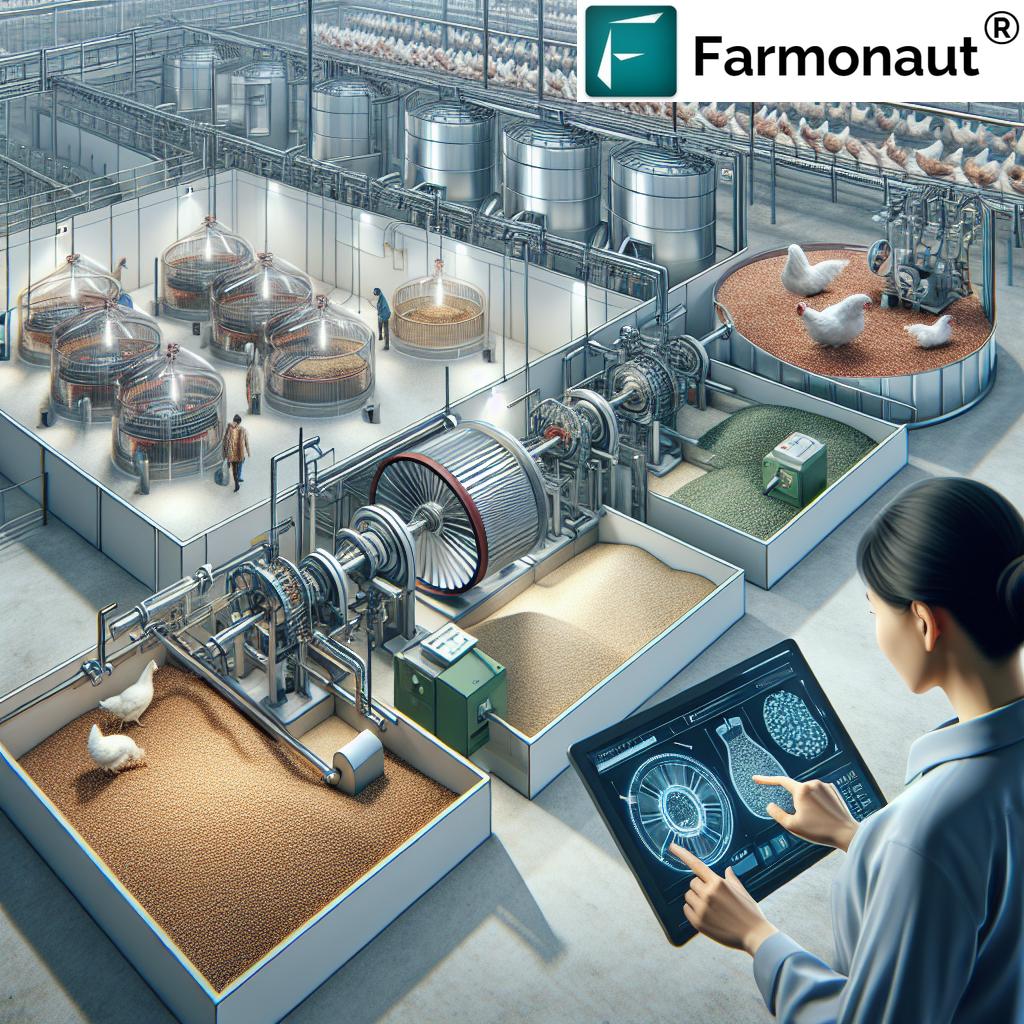
Animal nutrition automation applies the same feed-matching logic across operation types, adjusted for what each species and production stage actually needs:
- Dairy: ration adjustments keyed to lactation stage, along the amino-acid-balancing approach described above.
- Poultry: formulation changes by growth stage and breed, tracked against the FCR benchmarks in the chart above.
- Mixed livestock: the ability to switch formulations by species on one mill without a full changeover.
Using home-grown grains inside these formulations also supports diverse crop rotation practices on the arable side of a mixed operation, since a rotation that includes a feed grain has a buyer for it on-farm rather than needing a separate market. The global precision livestock farming market — the software and hardware category this page covers — was estimated at $7.94 billion in 2025, projected to reach $12.12 billion by 2030 at an 8.8% compound annual growth rate, per a MarketsandMarkets report published September 2025. Market-size forecasts like this one get revised annually as new report editions ship, so treat the 2030 figure as a September 2025 vintage estimate, not a fixed target.
Calculate Your Feed Mix Savings
The FCR history above shows what’s possible industry-wide; the calculator below applies the same math to your own tonnage and feed cost so you can see what a specific improvement target would be worth on your operation.
Run your own numbers
Assumptions: liveweight gain is held constant while FCR improves; the calculator excludes labor, energy, and equipment costs, and does not model feed price changes. It is a planning estimate, not a formulation tool.
Storage, Data, and the Rest of the Farm Tech Stack
Feed quality depends on what happens before the mill as much as inside it. Farmonaut's approach to agricultural storage solutions covers moisture- and temperature-sensored silos, automated inventory counts, and climate-controlled units — the inputs a mixer needs to hit a consistent formulation batch after batch.

None of this works in isolation. Mill software, storage sensors, and crop-side monitoring earn their keep when they share data instead of running as separate systems, which is the direction broader agricultural production technology has been moving, and part of why technology adoption on farms keeps expanding past guidance systems into feed and storage.
Frequently Asked Questions
Q: What's the difference between farm monitoring and precision feeding software?
A: Farm monitoring tracks field conditions — crop health, soil moisture, weather — from satellites and sensors. Precision feeding software runs the livestock side: ration formulation, mill and mixer control, and inventory. Farmonaut runs both under one account, but they answer different questions.
Q: Which poultry management systems support mobile access or apps?
A: Modern poultry management platforms, Farmonaut's included, ship Android and iOS apps alongside a web dashboard, covering feed and nutrition management, feed conversion tracking, and production records from a phone. When evaluating a vendor, confirm the app covers formulation changes and alerts, not just read-only reporting — that distinction is the practical test of whether "mobile access" means anything.
Q: Can a small farm justify a mill and mix system?
A: The hardware is modular, so a small or mid-size operation can start with a base mill and mixer and add conveying, storage sensors, or remote monitoring later. Given that feed is the largest expense line for hog, poultry, and dairy operations per USDA ERS, the payback case scales with the size of that expense line specifically, not with total farm acreage.
Q: How current are the feed-cost figures on this page?
A: The USDA figures cited above are from the ERS farm sector income forecast updated May 19, 2026. ERS revises this forecast on a recurring schedule through the year — pull the current release from the farm data management workflow you already use, or directly from ERS, rather than treating this page's numbers as permanent.
Q: Does remote monitoring replace the need for on-site quality control?
A: No. Sensors and automated sampling reduce how often manual checks are needed and catch deviations between checks, but ingredient sourcing, calibration, and periodic verification remain manual tasks a monitoring system flags rather than eliminates.
Get Farmonaut on Your Farm
The web app, Android app, and iOS app all run the same feed and crop monitoring account:



 FieldZero
 Indico Company
 Byju’s
 Kubota
 FFBS
FFBS Jontra
 Kalustyan
 Tucor
Tucor Geno
Geno Hayleys Agriculture
 Linx Agritech
 Adinet
 Save Your Soils
 Grandstream Algérie
