

Soil health · Salinity guide
Soil Salinity Farm Management: 7 Ways to Reduce Salt
Soil salinity farm management is water management: test and map EC, leach salt below the roots where the field drains, lower shallow water tables and grow crops that tolerate what is left. FAO counts a soil as saline above 4 dS/m; corn starts to lose yield at 1.7 dS/m.
Key takeaways
- FAO’s 2024 report puts salt-affected land at 1,381 million hectares, 10.7% of the world’s land, with about 10% of irrigated and rainfed cropland affected.
- FAO thresholds: barley holds full yield to ECe 8.0 dS/m, wheat to 6.0, soybean to 5.0, corn to 1.7 and common bean to 1.0.
- FAO’s leaching requirement is LR = ECw / (5 × ECe − ECw); leaching only works where water can drain away.
- Gypsum fixes sodic soils, not saline ones: NC State lists about 1,500 lb per acre per 1 meq sodium per 100 cm³ of soil.
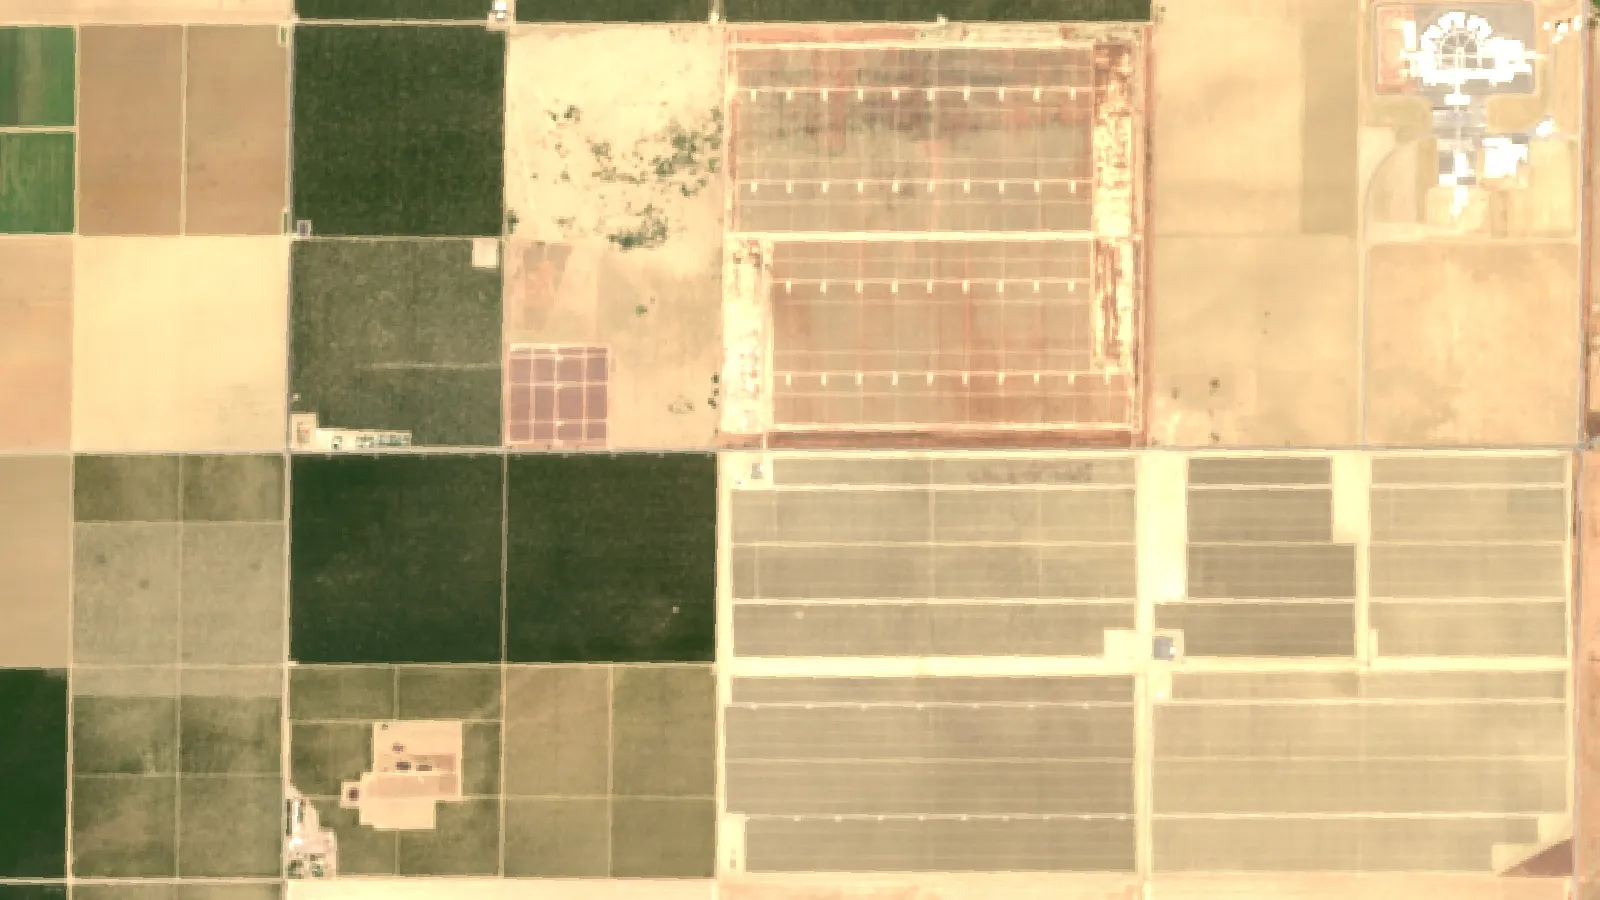
- NDSU advises mapping salty zones with yield maps and satellite images, then keeping salt-tolerant crops or perennials growing on them.
In this article
- Soil salinity farm management at a glance
- What soil salinity is and how it is measured
- Causes of salty soil on farms
- Symptoms of salt stress in crops
- How much yield does salt cost?
- 1. Test and map soil EC in zones
- 2. Leach salts below the root zone
- 3. Improve drainage and lower the water table
- 4. Grow salt-tolerant crops on salty zones
- 5. Use gypsum on sodic soils
- 6. Keep the soil covered
- 7. Irrigate and fertilize with salt in mind
- Organic measures: what they can and cannot do
- A season plan for soil salinity farm management
Good soil salinity farm management comes down to water: measure the salt, move it below the root zone with extra water and drainage, and grow crops that tolerate what is left. A soil counts as saline when the saturated paste extract reads above 4 dS/m, the long-used Richards (1954) threshold cited in FAO’s guide to saline soils and their management. Corn starts to lose yield at only 1.7 dS/m, while barley holds full yield up to 8 dS/m.
This guide gives seven practical ways to reduce soil salinity on farms in the US, Canada, Australia and Europe. It includes crop salt-tolerance charts from FAO data, a gypsum rate table from NC State Extension and a calculator that works out the extra irrigation water your crop needs to keep salts in check.
Soil salinity farm management at a glance
The table sums up the seven ways. Each has its own section below, with the source behind it.
| Way | What it does | Best for | Main limit |
|---|---|---|---|
| 1. Test and map EC | Shows where and how bad the salt is | Every field with patchy yields | Lab tests cost money per sample |
| 2. Leach salts | Pushes salt below the roots with extra water | Irrigated fields with good drainage | Needs low-salt water |
| 3. Drain the field | Lowers a salty water table | Shallow water tables, seeps | High upfront cost, permits |
| 4. Salt-tolerant crops | Keeps something growing and using water | Fields with ECe above 4 dS/m | Lower-value crops on worst spots |
| 5. Gypsum on sodic soil | Swaps sodium for calcium | High-sodium, crusted soils | Needs water to flush sodium out |
| 6. Cover the soil | Cuts evaporation and capillary rise | Dryland seeps, bare fallow | Slow to show results |
| 7. Smarter irrigation | Keeps salt away from young roots | Drip and furrow systems | Equipment cost |
What soil salinity is and how it is measured
Salinity stress occurs when soluble salts build up in the soil or irrigation water to a level that harms plants. The salts include sodium chloride, sodium sulfate, magnesium sulfate and calcium chloride. Gypsum is also a soluble salt, while lime is about 100 times less soluble, so it does not count toward salinity, as NDSU Extension explains in its guide to managing saline soils.
Salt is measured as electrical conductivity (EC), in deci-siemens per metre (dS/m). One dS/m equals one mmho/cm, the unit many older soil reports use. There are three numbers to know:
- ECe: EC of a saturated soil paste extract. Crop tolerance tables use this one.
- EC 1:1: EC of one part soil to one part water. Many commercial labs in the northern Plains report this; it reads lower than ECe.
- ECw: EC of the irrigation water.
Saline and sodic soils are different problems. A saline soil has too much total salt. A sodic soil has too much sodium compared with calcium and magnesium. NC State Extension notes that when the exchangeable sodium percentage (ESP) reaches 15% or more, sodium can damage soil structure, slowing infiltration and causing crusts. Saline soils need leaching. Sodic soils need calcium first, then leaching.

▶ Our overview of salinity stress: how salt affects plants, and organic and conventional ways to manage it. · 10:23
Causes of salty soil on farms
Salt reaches the root zone in a few main ways:
- Shallow, salty groundwater. In dry weather, water rises from the water table by capillary action and leaves salt at the surface when it evaporates. FAO puts the critical water table depth at roughly 1.5 to 3.0 metres, depending on soil and crop.
- Irrigation water with salt in it. Every irrigation adds salt; crops take up water and leave most of the salt behind.
- Poor drainage. Without a way out, salt stays in the profile.
- Seawater. Storm surge, sea level rise and saltwater moving through ditches and subsoil are the main causes on coastal farms, according to NC State Extension’s work on saltwater intrusion.
- Geology and climate. In North Dakota, salts come from marine shale bedrock and a semiarid climate, NDSU reports.
- Heavy fertilizer and manure. Large rates of soluble fertilizer or manure add salts, especially on soils that are not leached.
The scale is large. FAO’s 2024 Global Status of Salt-Affected Soils report puts the affected area at 1,381 million hectares, or 10.7% of the world’s land. It estimates that about 10% of irrigated and 10% of rainfed cropland is affected, and lists the United States, Australia and Argentina among the ten countries that hold 70% of salt-affected soils.
One pattern surprises many growers. NDSU notes that salinity often gets worse after a run of wet years, and is worst when dry weather follows them. Wet years raise the water table; the dry year then pulls that salty water up to the surface.
Symptoms of salt stress in crops
High salt makes it harder for roots to take up water, so plants look drought-stressed even in moist soil. Watch for:
- Stunted growth and patchy stands, often in low spots or field edges
- Poor or slow germination; seedlings are more sensitive than mature plants
- Leaf tip and margin burn, starting on older leaves
- Yellowing and early leaf drop
- Wilting in the afternoon despite adequate soil moisture
- White crusts on dry soil, though NDSU warns that salt can cut yields below the surface with no white crust at all
These signs look like drought, nutrient shortage or root disease. In soybean on high-lime soils, iron deficiency chlorosis often appears together with salinity. A soil test is the only way to confirm salt is the cause. For other causes of poor growth, see our guide to crop stress.
How much yield does salt cost?
FAO’s crop salt tolerance tables give each crop two numbers. The threshold is the highest ECe with no yield loss. The slope is the percent of yield lost for each 1 dS/m above that threshold. Relative yield equals 100 minus slope times (ECe minus threshold). The values below come from FAO’s crop salt tolerance data.
Corn has a threshold of 1.7 dS/m and loses 12% per dS/m above it. Wheat has a threshold of 6.0 and a slope of 7.1. Barley holds full grain yield to 8.0 and then loses 5% per dS/m. Soybean holds to 5.0 but then loses 20% per dS/m, so it falls fast. These are averages from trials, and varieties differ. NDSU’s North Dakota field data use EC 1:1, which reads lower than ECe, so its numbers cannot be compared directly with the FAO table.
NDSU’s own field data, measured as EC 1:1, show the same order. Spring wheat drops to about 85% of maximum yield at EC 2 and 70% at EC 4. Soybean falls to about 80% at EC 1.5 and about 60% at EC 2.2, and NDSU says growers have little hope of a profitable soybean crop above EC 3.
Chart
Relative yield as soil salinity rises
% of full yield by soil ECe (dS/m), computed from FAO threshold and slope values
1. Test and map soil EC in zones
The first step in soil salinity farm management is a map. NDSU advises sampling by zones, using several years of yield maps and satellite or aerial images as the template, because crop growth patterns point to the salty areas. Ignoring salty acres wastes seed, fertilizer and pesticide on ground that cannot pay them back.
Three tools do the measuring:
- Lab soil tests. Ask for EC, sodium and ESP or SAR. Take samples from the problem patch and a good part of the field for comparison.
- Handheld EC meters. Quick for checking within a field, but NDSU says readings vary between meters and with soil temperature. Calibrate them against lab results and use distilled water.
- EC sensor carts. Tools such as the Veris 3100 and the Geonics EM38 map a whole field. They are worth hiring for large, patchy fields.
Test the irrigation water too. The US Geological Survey classes water under 1,000 ppm dissolved salt as fresh and 1,000 to 3,000 ppm as slightly saline. Retest after major floods, storm surges or a change of water source.
2. Leach salts below the root zone
Leaching means applying more water than the crop uses, so the extra drains down and carries salt with it. FAO’s soils bulletin gives a rule of thumb: a depth of water passing through the soil removes nearly 80% of the salt from the same depth of soil. So 30 cm of drainage water clears about 80% of the salt in the top 30 cm. Field leaching tests give better numbers for your soil.
For ongoing control, FAO Irrigation and Drainage Paper 29 sets a leaching requirement equation: LR = ECw / (5 × ECe − ECw). ECw is the water salinity and ECe is the soil salinity the crop can tolerate. The total water to apply is then the crop’s water use divided by (1 − LR). FAO suggests using the ECe for at least 90% yield, and says the 100% value may be better when the water is above 1.5 dS/m.
Leaching only works if the water can drain away. On heavy clay, or with a high water table, extra water just raises the water table and makes the problem worse. Leach after the crop is off, or before planting, when you can. Use the calculator below to estimate how much extra water your crop needs.
Try the numbers for your own farm below.
Calculator
How much extra water does your crop need to control salt?
Enter your water test, your crop’s tolerance and its seasonal water use.
- Total water to apply: 27.7 inches
- Extra water for leaching: 3.7 inches
- Expected yield at your soil ECe: 90.4 % of full
Example values only, not a benchmark or a recommendation: the defaults use corn’s FAO threshold (1.7 dS/m) and slope (12% per dS/m) and a 24-inch season. Leaching requirement uses FAO Irrigation and Drainage Paper 29: LR = ECw / (5 × ECe − ECw); water to apply = crop water use / (1 − LR). Relative yield uses FAO threshold-slope values (Annex 1, Paper 61). Results assume the field drains; get local advice before changing irrigation.
3. Improve drainage and lower the water table
NDSU puts it simply: salinity management is water management. If the water table sits close to the surface, salts will keep coming back no matter how much you leach. Options include:
- Subsurface tile drainage. Pipes lower the water table and carry leached salt away. Check local permit rules for drainage outlets and discharge water.
- Open ditches. Cheaper, but they can create salty strips beside them. NDSU found that water moving from a ditch into the field rises by capillary action and leaves salt a short way into the field.
- Raised beds. Beds keep roots above the wettest, saltiest layer and allow salt to be pushed to the furrow.
- Land levelling. Even water spread avoids wet low spots and dry, salty high spots.
In the Red River Valley, NDSU found that slight rises less than 6 inches above nearby depressions turn salty, because water collects in the dips and moves sideways into the bumps. On coastal land, NC State notes that a high water table and low elevation can limit how much salt drainage can remove.

▶ How raised beds improve drainage and soil control, one way to keep roots above wet, salty layers. · 9:38
4. Grow salt-tolerant crops on salty zones
NDSU stresses that something must keep growing on salty ground. Bare or weak patches use little water, so the water table rises and the salty area spreads. Choosing crops by salt tolerance is often the cheapest fix.
Chart
Salt tolerance threshold by crop
Highest soil ECe (dS/m) with no yield loss, selected crops
On FAO’s ratings, barley, cotton and sugar beet are tolerant; wheat and soybean moderately tolerant; corn, alfalfa and tomato moderately sensitive; and beans, onions and strawberries sensitive. NDSU adds that oats are nearly as tolerant as barley and that full-season salt-tolerant cover crops and perennial grasses help on the worst patches. NC State reports that cotton is considered highly salt-tolerant among field crops in northeastern North Carolina and that asparagus did well in a salty test plot.
Within a crop, varieties differ. Ask your seed dealer or state variety trial for salt or iron chlorosis ratings, since NDSU found the two often go together in soybean screening.
5. Use gypsum on sodic soils
Gypsum (calcium sulfate) helps when sodium is the problem, not total salt. The calcium replaces sodium on clay particles; water then washes the sodium out. On a purely saline soil, gypsum adds more salt and does little good.
Chart
Gypsum needed to displace soil sodium
lb gypsum per acre by soil test sodium (meq per 100 cm³)
NC State Extension gives gypsum rates based on soil test sodium, adapted from Oster and Fenkel (1980): about 1,500 lb per acre for each 1 meq of sodium per 100 cm³ of soil. The University of Arizona’s guide to gypsum and other calcium amendments explains that mined gypsum contains 23.2% calcium and dissolves well, while lime only dissolves in acid soils. On calcareous soils, sulfur or acid can free the calcium already in the lime.
Gypsum needs fresh water and good drainage to work. In one coastal North Carolina field, 9,000 lb per acre over three years still left an ESP of 36 in the top 6 inches, because the high water table stopped the sodium from leaving. Get a soil test and local advice before buying gypsum, and follow product labels and local rules for by-product gypsum sources.
6. Keep the soil covered
Bare soil loses water fast, and every bit of evaporation leaves salt behind. Cover reduces this in several ways:
- Mulch and crop residue. Straw, residue or plastic mulch cut evaporation from the surface. FAO’s 2024 report lists mulching among its mitigation strategies.
- Reduced tillage. NDSU warns that tillage darkens the surface, raises capillary rise and breaks the large pores that help leaching. NC State also notes that conservation tillage helps rain soak in.
- Cover crops. Late-season cover crops after small grains keep using water when the field would otherwise be bare.
- Perennials at seeps and ditches. NDSU recommends a strip of alfalfa at least 30 feet wide along a road or ditch. Alfalfa can use up to 25 inches of soil water a year and roots at least 8 feet deep after two years, so it intercepts water before it reaches the field.
7. Irrigate and fertilize with salt in mind
How you water changes where salt ends up. Drip and frequent light irrigation keep the root zone wetter, which keeps salt diluted near the roots and pushes it to the edge of the wetted area.
FAO’s water quality guidelines rate irrigation water below 0.7 dS/m as having no salinity restriction for use. Above that, you need more leaching, more tolerant crops or a blend with cleaner water. Split fertilizer applications, use the rates your soil test calls for and avoid placing high-salt fertilizer next to the seed. Manure and compost add salt too, so test them and spread them evenly.
Organic measures: what they can and cannot do
Many growers look to organic practices to protect soil fertility on salty ground. Here is how the main ones fit:
- Compost, manure and green manures improve structure and infiltration, which helps leaching. They do not remove salt themselves, and manure can add salt.
- Biochar can improve water holding in sandy soils. Results on saline soils vary by product and soil, so trial it on a small area.
- Mulching is among the best-supported organic measures, because it cuts surface evaporation.
- Phytoremediation and bioremediation use salt-tolerant plants or microbes. FAO’s 2024 report lists bioremediation and salt-tolerant plants, including halophytes, as adaptation strategies. Plants remove only a small share of the salt, so they work best with leaching and drainage.
Combine these with the water-based steps above. That mix of sustainable agricultural practices and drainage is what extension services describe for long-term control.

▶ Why soil structure, water retention and nutrient supply matter for healthy crops. · 9:58
A season plan for soil salinity farm management
- After harvest: map yield and crop growth; sample soil and water in good and poor zones.
- Late autumn or winter: apply gypsum on sodic zones; plan drainage work; leach with rain or irrigation where drainage allows.
- Before planting: choose crops and varieties by zone EC; plan irrigation with the leaching requirement.
- In season: irrigate to keep the root zone moist; watch problem zones for early stress.
- Next harvest: compare yields and EC with last year, and adjust.
Salt problems are one of many challenges in agriculture that build slowly over several seasons, so the yearly comparison matters as much as any single fix.
Using satellite maps to find salty zones
Satellites do not measure salt directly. What they show is crop growth: salty patches tend to appear as areas of low vegetation index that repeat in the same place year after year. NDSU recommends using such images, with yield maps, to decide where to take soil samples. A soil test then confirms whether salt, drainage, disease or nutrients are the cause.
Farmonaut Satellite + AI Farm Monitoring System shows vegetation index maps for fields you draw in its app, so you can compare patchy areas across the season and pick sampling points.
FAQ
What EC level makes a soil saline?
A soil is classed as saline when the saturated paste extract (ECe) is above 4 dS/m, the definition FAO uses. The Soil Science Society of America lowered the boundary to 2 dS/m. Sensitive crops such as beans and strawberries lose yield from about 1.0 dS/m.
How can I reduce soil salinity quickly?
Leaching with good-quality water is the fastest method, as long as the field drains. FAO’s rule of thumb is that each unit depth of water passing through removes nearly 80% of the salt from the same depth of soil. Without drainage, leaching only raises the water table.
Does gypsum reduce soil salinity?
No, not on its own. Gypsum fixes sodic soils by replacing sodium with calcium. It is itself a salt, so on soils with high salt but little sodium it does not help. In both cases, water must flush the sodium or salt below the roots.
Which crops grow best in salty soil?
Among field crops, FAO rates barley (threshold 8.0 dS/m), cotton (7.7) and sugar beet (7.0) as tolerant, and wheat (6.0) as moderately tolerant. NDSU adds oats. Corn, alfalfa and most vegetables are more sensitive.
Why is salinity worse after wet years?
Wet years raise the water table. When a dry spell follows, water rises to the surface by capillary action and leaves its salt behind, as NDSU explains for North Dakota fields. Keeping crops growing and using water on those areas slows the spread.
This guide is general information. Get a soil test and advice from your local extension service or agronomist before making major changes, and follow product labels and local rules for amendments, drainage and water use.
Related pages on our site: signs of crop stress.
Farmonaut crop monitoring
Find the weak zones in your fields
Draw your fields once and Farmonaut shows satellite vegetation maps for them through the season, on web, Android or iOS, to help you choose where to sample.




Keep reading


Sources
- FAO, Global Status of Salt-Affected Soils launch release (December 2024): fao.org
- FAO Soils Bulletin, Saline soils and their management: fao.org
- FAO Soils Bulletin, Sodic soils and their management: fao.org
- FAO, Annex 1: Crop salt tolerance data (Irrigation and Drainage Paper 61, 2002): fao.org
- FAO, Water quality for agriculture (Irrigation and Drainage Paper 29, Ayers and Westcot, 1985): salinity problems: fao.org
- NDSU Extension, Managing Saline Soils in North Dakota: ndsu.edu
- NC State Extension, Effects of Sodium Salts on Soils in Coastal Agricultural Fields: content.ces.ncsu.edu
- NC State Extension, Saltwater Intrusion in Agricultural Fields in Northeastern North Carolina and Potential Remediation: content.ces.ncsu.edu
- University of Arizona Cooperative Extension, AZ1413 Using Gypsum and Other Calcium Amendments (revised 2012): extension.arizona.edu
- US Geological Survey, Saline Water and Salinity (Water Science School): usgs.gov
Discussion
Questions, corrections or field experience? Share them below. First-time comments are reviewed before they appear, and your email is never published.
No comments yet. Be the first to add a question or your experience.

 Juligerm
 Inclusive Growth Chain
 AdBio
 MISE Maroc
 Drift-Sense
 NWNS
 Red August Group
 Farm Inc
 WeMe Global
 Agrotoken
 Blue BearX
 Insignito
 Croptimum
 DnCubed
 Field Capacity
 Indosistim Teknologi
 Liquify Digital
 CU Foods

 Licence holder · Niger · Gold
 Licence holder · Nigeria · Gold + lithium
 Client · Somalia · Gold










