

Reviewed August 2026 against USDA Economic Research Service and PS Market Research.
Try it: Run your own numbers →
Remote sensing in agriculture means using satellites, drones, and airborne sensors to measure crop health, soil moisture, and field variability without setting foot in the field. In the United States, the precision agriculture technologies market that depends on this data was valued at $2.1 billion in 2024 and is projected to grow at a 9.3% compound annual rate from 2025 through 2032, according to PS Market Research. Farms using two or more precision technologies together saw a 13% increase in net returns on US dairy operations in 2023, per USDA’s Economic Research Service — this article shows you where that value comes from, what the tools cost, and how GIS ties it all together.
What Remote Sensing in Agriculture Actually Does
Remote sensing in agriculture is the practice of collecting information about crops, soil, and water from a distance — via satellite, aircraft, or drone-mounted sensors — instead of manual field walks. The core outputs are spectral indices such as NDVI (Normalized Difference Vegetation Index), which flags plant stress before it is visible to the eye, along with soil moisture layers, canopy temperature, and elevation models. These feed directly into GIS (Geographic Information Systems), which store, layer, and map that data against field boundaries, soil types, and management zones so a grower can act on it at the scale of a single acre rather than a whole field.
The distinction matters for anyone comparing tools: remote sensing is the data-capture layer (what a satellite or drone sensor records), while GIS is the analysis-and-mapping layer (what turns that raw signal into a management decision). Most commercial platforms, including satellite advisory services and drone-mapping software, bundle both functions into one interface — but understanding them separately helps you evaluate what you are actually paying for.
- ✔ Detects crop stress days to weeks before visual symptoms appear
- 📈 Targets inputs — water, fertilizer, pesticide — to zones that need them
- 🛰️ Scales from one field to thousands of acres using the same sensor pass
- 🗺️ GIS layering turns raw imagery into zone maps, yield models, and historical trend lines

How Big Is the US Market — and Who’s Using It
The US precision agriculture technologies market — the umbrella category that includes remote sensing hardware, GIS software, and the guidance systems built on top of them — was sized at $2.1 billion in 2024, with PS Market Research projecting a 9.3% CAGR from 2025 to 2032. That growth is being driven by adoption on both ends of the farm-size spectrum: large row-crop operations replacing scouting labor with sensor passes, and mid-size operations adopting subscription-based satellite advisory tools that don’t require owning hardware.
Drone-based remote sensing is the fastest-visible piece of that market. By the end of 2024, an estimated 400,000 agricultural drones were in operational use across the United States, according to agricultural drone industry data compiled by The Drone Girl — a 90% increase in the US agricultural drone fleet between 2020 and 2024. Not all of those drones are formally registered: the Federal Aviation Administration listed only about 5,500 agricultural drones on its registry as of mid-2025, which tells you that a large share of on-farm drone use runs under recreational or unregistered categories rather than commercial Part 107 operations — a gap worth knowing if you’re planning compliant commercial drone services.
In dollar terms, the US agricultural drone market itself — hardware, software, and services specific to drones rather than satellites — was valued at $506.3 million in 2024, per IMARC Group and Grand View Research estimates. That’s roughly a quarter of the broader $2.1 billion precision agriculture technologies figure, indicating satellite-based and ground-sensor remote sensing still account for the majority of US precision ag spending.
Drone Remote Sensing vs. Satellite Remote Sensing
“Drone remote sensing agriculture” and “satellite remote sensing agriculture” are often treated as interchangeable, but they solve different problems and the choice affects both cost and revisit frequency.
- Drones capture centimeter-level resolution imagery on demand, ideal for scouting a specific field the same day you fly it, spotting equipment-caused damage, or verifying a spray pass. The trade-off is coverage: a single operator can typically cover a few hundred acres per day, and each flight requires FAA compliance if operated commercially.
- Satellites revisit the same field automatically every few days at coarser resolution (commonly 10–30 meters per pixel for widely used public and commercial sensors), covering unlimited acreage at the same subscription cost whether you monitor 50 acres or 50,000. This makes satellite monitoring better suited to routine, farm-wide health checks, while drones are better suited to targeted, high-resolution investigation once a satellite pass flags a problem area.
Neither replaces the other — most modern precision agriculture programs layer both: satellite monitoring for continuous, low-cost surveillance across the whole operation, with drone flights reserved for verifying anomalies satellite imagery has already flagged. The FAA’s registry of roughly 5,500 agricultural drones as of mid-2025, against an estimated 400,000 drones actually in on-farm use, suggests most growers are using drones as an occasional scouting tool rather than a daily-flown, fully registered commercial fleet — worth checking against the FAA’s live Special Government Interest registration data if you are scaling a commercial drone operation (see the refresh note below).

GIS and Remote Sensing in Agriculture: How They Combine
GIS is what turns a raw satellite or drone image into a decision layer. A single NDVI pass tells you which parts of a field are stressed; GIS is what overlays that stress map against your field boundary shapefile, historical yield maps, soil survey data, and as-applied fertilizer records to tell you why a zone is underperforming and what to do about it. This is the practical answer to “gis and remote sensing in agriculture” as a combined discipline: remote sensing supplies the observation, GIS supplies the spatial context and the decision-support layer.
In a typical GIS-integrated workflow:
- Acquisition: Satellite or drone sensor captures multispectral imagery of the field
- Processing: Raw imagery is converted into indices (NDVI, soil moisture, chlorophyll) and geo-referenced
- Layering: GIS software overlays the index map against field boundaries, soil zones, and prior-year yield data
- Zone creation: Management zones are drawn based on where the layered data shows consistent variability
- Action: Variable-rate prescriptions (irrigation, fertilizer, seeding) are generated from the zone map and sent to farm equipment or an advisory app
This layered GIS approach is also what supports non-production use cases: verifying land use for crop insurance claims, tracking reforestation or mining-land reclamation against a baseline map, and generating the field-level audit trail regulators or buyers increasingly ask for in supply-chain traceability programs.

Comparison Table: Remote Sensing Platforms by Use Case
The table below compares the main remote sensing approaches used in US agriculture today, so you can match a platform to your operation’s scale and the decision you’re trying to make.
| Platform | Typical Resolution | Revisit Frequency | Best Suited For | Cost Structure |
|---|---|---|---|---|
| Public satellite (e.g., Landsat, Sentinel) | 10–30 m/pixel | Every 2–5 days per overlapping sensor | Farm-wide NDVI trend monitoring at no data cost | Free (public open-data programs) |
| Commercial satellite advisory platform | 3–10 m/pixel (varies by provider) | Every 1–5 days | Continuous crop health, irrigation, and advisory alerts | Subscription, per-acre or per-farm |
| Fixed-wing or multirotor drone | Centimeter-level | On-demand (operator-flown) | Targeted scouting, damage verification, spray audits | Hardware purchase or per-flight service fee |
| Ground-based sensors (soil probes, weather stations) | Point-source, not imagery | Continuous/real-time | Calibrating and validating satellite/drone readings | Hardware purchase plus data plan |
1. Public and Commercial Satellite Monitoring
Satellite-based remote sensing is the backbone of most commercial precision agriculture platforms because it scales to any farm size at a fixed subscription cost. NDVI, soil moisture, and leaf-area-index (LAI) layers refresh on a set revisit schedule, giving growers a continuous record of how each field zone is trending across the season rather than a single snapshot.
2. Drone-Based Remote Sensing
Drone remote sensing agriculture use has scaled quickly: the US fleet reached an estimated 400,000 units by the end of 2024, up 90% from 2020, per The Drone Girl’s industry data. Growers use drones for high-resolution scouting flights that verify what a satellite pass flagged, count plant stands, or audit spray coverage — tasks where centimeter-level detail justifies the extra time and cost per acre relative to a satellite pass.

3. GIS Zone Mapping and Variable-Rate Prescriptions
Once satellite or drone imagery is processed into indices, GIS software layers it against field boundaries and historical data to generate management zones. This is the step that produces the variable-rate prescription files used by modern planters, sprayers, and irrigation controllers — the practical output most growers actually act on, rather than the raw imagery itself.
4. Field Boundary and Soil Data Integration
GIS platforms combine remote sensing layers with soil survey data and field boundary records to build the spatial reference every other layer depends on. Without an accurate boundary and soil-type baseline, NDVI stress maps can misattribute soil-driven variability to crop-driven variability — a common source of wasted variable-rate spend.
5. Crop Health and Stress Detection
Multispectral and hyperspectral sensing detects chlorophyll and water-stress signatures in the near-infrared and red-edge bands, often before visible wilting or discoloration appears. This early-warning function is the single most cited reason growers adopt remote sensing tools.
6. Soil Moisture and Irrigation Scheduling
Satellite-derived soil moisture estimates, cross-checked against ground-based soil probes, let irrigation managers schedule water by zone rather than by whole-field averages — directly reducing over- or under-watering in variable soils.
7. Yield Mapping and Historical Trend Analysis
Combine-mounted yield monitors generate the ground-truth layer that calibrates satellite NDVI models against actual harvest outcomes. Multi-year yield maps, layered in GIS against remote sensing history, are what let a grower distinguish a persistent low-yield zone (soil-driven) from a one-season anomaly (weather-driven).

8. Advisory and AI-Based Recommendation Layers
The final layer in most commercial platforms is an AI advisory engine that translates the GIS-layered data into a plain-language recommendation — irrigate zone 3 this week, scout zone 7 for pest pressure — closing the gap between raw remote sensing data and a decision a farm manager can act on without a GIS analyst on staff.



Return on Investment: What USDA’s Data Shows
The clearest published US return-on-investment figure for precision technology adoption comes from USDA’s Economic Research Service: dairy operations using two or more precision technologies together saw a 13% increase in net returns in 2023, relative to operations using fewer or none. This is a bundled-technology effect — the ERS study measured returns from combining tools (such as automated feeding, herd monitoring, and remote sensing-based management) rather than isolating remote sensing’s contribution alone.
That distinction matters if you’re building a business case for a specific investment: USDA’s public data confirms precision technology adoption as a bundle pays off, but per-acre savings specific to drone adoption or GPS guidance in isolation are not consolidated at the federal level. That figure exists, if at all, in peer-reviewed agronomy journals and university extension studies rather than a single federal dataset — worth searching your state’s land-grant extension service (for example, a state university Cooperative Extension precision-ag program) for a trial matching your crop and region before finalizing a purchase decision.
Similarly, adoption rates broken out by major US commodity region — Corn Belt, Great Plains, Pacific Northwest — are not available in the sources reviewed for this article. The most authoritative source for that breakdown is the USDA NASS Census of Agriculture, last conducted with a full count in 2022 and next due in 2027; NASS QuickStats publishes interim annual survey data between census years at quickstats.nass.usda.gov.
Two authoritative sources anchor the ROI and market-scale claims in this article:
- USDA Economic Research Service — Precision Agriculture Adoption and Returns: the source for the 13% net-returns figure and the federal reference point for adoption trends by farm type.
- PS Market Research — US Precision Agriculture Technologies Market Report: the source for the $2.1 billion 2024 market size and 9.3% CAGR projection.

Calculator: Estimate Your Remote Sensing ROI
Use USDA’s 13% net-returns figure for multi-technology dairy adoption as a benchmark, then adjust it against your own farm’s revenue and remote sensing subscription cost to see where the break-even point falls.
Run your own numbers
Where Remote Sensing Meets Crop Biotechnology
Remote sensing doesn’t operate in isolation from the genetics and inputs side of agriculture. Site-specific data on stress, disease pressure, and soil variability is what makes precision deployment of resistant cultivars, biocontrol agents, and biofertilizers cost-effective rather than a blanket, whole-field guess. For a deeper look at how gene editing, marker-assisted breeding, and other agricultural biotechnology tools connect to this data layer, see our companion article on biotechnology in agriculture.

How Farmonaut Delivers Remote Sensing & GIS Tools
Farmonaut provides satellite-based remote sensing and GIS analysis built for US farm operations of any scale:
- Real-time Vegetation and Soil Monitoring: Multispectral satellite insights — NDVI, soil moisture, and more — for management decisions in fields, orchards, and forested land.
- AI-based Advisory: Farmonaut’s Jeevn AI layers satellite data into plain-language recommendations on irrigation, nutrient timing, and pest risk.
- Blockchain Traceability: Our platform supports transparent crop and produce traceability, meeting buyer and regulatory documentation demands.
- Environmental Impact Tracking: Our carbon footprinting dashboard helps operations measure and report input-efficiency gains.
- Insurance and Compliance Support: Remote monitoring records support crop insurance validation and loan documentation.
All tools are available via Android, iOS, and web apps, or through our satellite and weather API for direct integration into your own farm management software. Full technical reference is available in the API developer documentation.
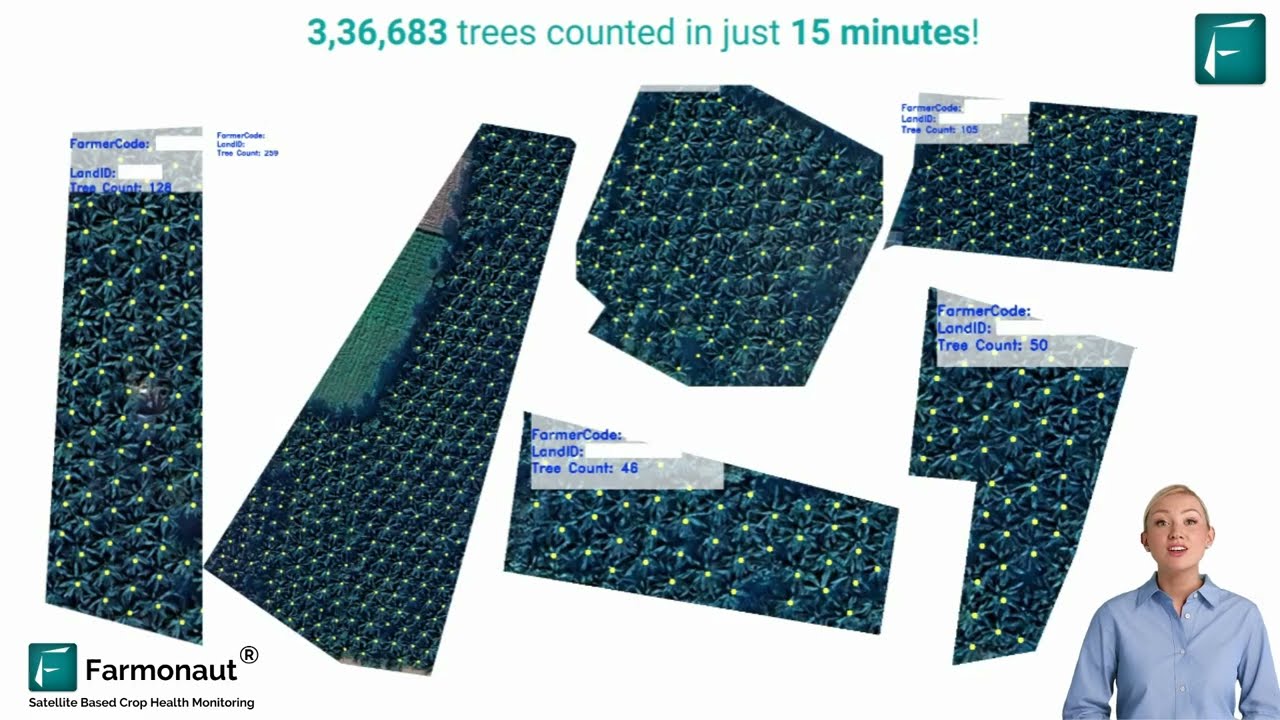
For large-scale plantation monitoring or forest and land-cover tracking, access our crop and plantation advisory service directly.
Explore Flexible Subscription Options
Choose a Farmonaut subscription package that matches your acreage and remote sensing needs. Scale seamlessly as your operations expand.
Frequently Asked Questions
Q1: What is remote sensing in agriculture?
Remote sensing in agriculture is the use of satellite, aircraft, or drone-mounted sensors to measure crop health, soil moisture, and field variability without physically inspecting every acre. The most common output is NDVI, a vegetation-stress index derived from red and near-infrared light reflectance.
Q2: What’s the difference between drone remote sensing and satellite remote sensing in agriculture?
Drones deliver centimeter-level resolution on demand but cover limited acreage per flight and, for commercial use, require FAA compliance — only about 5,500 agricultural drones were formally registered with the FAA as of mid-2025. Satellites cover unlimited acreage automatically on a fixed revisit schedule (commonly every 1–5 days for commercial platforms) at coarser resolution, making them better suited to continuous, farm-wide monitoring.
Q3: How do GIS and remote sensing work together in agriculture?
Remote sensing captures the raw imagery and spectral data; GIS layers that data against field boundaries, soil maps, and historical yield records to produce management zones and variable-rate prescriptions. Neither is a substitute for the other — GIS is the analysis and mapping step that makes remote sensing data actionable.
Q4: How big is the precision agriculture technology market in the United States?
The US precision agriculture technologies market was valued at $2.1 billion in 2024, with PS Market Research projecting 9.3% compound annual growth from 2025 through 2032. The agricultural drone segment specifically was valued at $506.3 million in 2024, per IMARC Group and Grand View Research.
Q5: What return on investment can I expect from adopting remote sensing tools?
The clearest published federal figure is USDA’s Economic Research Service finding that US dairy operations using two or more precision technologies together saw a 13% increase in net returns in 2023. Per-acre savings specific to remote sensing alone, isolated from other precision technologies, are not consolidated in a single federal dataset — check peer-reviewed agronomy journals or your state’s Cooperative Extension office for trial data matching your crop and region.
Q6: Where can I find current adoption and drone registration figures?
For adoption rates by farm size and region, USDA NASS QuickStats publishes annual survey data at quickstats.nass.usda.gov between the five-year Census of Agriculture (next due in 2027). For current agricultural drone registration counts, the FAA’s Special Government Interest site tracks live registration data.
Conclusion: Getting Started
Remote sensing and GIS in agriculture are no longer emerging technologies — they underpin a $2.1 billion US market growing at a projected 9.3% annually through 2032, with roughly 400,000 drones already flying US fields and satellite-based advisory platforms covering the rest. The return is documented, not hypothetical: USDA’s Economic Research Service recorded a 13% net-returns increase for dairy operations combining precision technologies in 2023.
The durable method that survives any single year’s figures is this: match the sensing platform to the decision you need to make (satellite for continuous whole-farm monitoring, drone for targeted verification), layer that data through GIS against your own field boundaries and history rather than relying on a single snapshot, and check USDA NASS QuickStats and the FAA registry directly whenever you need a number fresher than the ones cited here — both update on a public, predictable schedule.
Explore Farmonaut’s platform via web, Android, or iOS, or integrate our API directly into your own farm management software for automated field-to-satellite analytics.

 AgroRangers
 FCF India
 Unifrutti Gulf
 Deluxe Conseil
 TVS Electronics
 BW Pipelines
 WICO
WICO Gen Chayat
 Chimera Innovation
 SkyHarvest
 Polaris Digitech
 Teledarbas
 Wild Oak Farm
 SFX
SFX
