

Reviewed September 2026 against USDA NASS (Newsroom yield reports, Charts and Maps, Ohio Annual Statistical Bulletin) and USDA Small Grains reports.
Try it: Run your own numbers →
Ohio’s corn yield averaged 171 bushels per acre in 2020, according to USDA NASS’s Ohio Annual Statistical Bulletin — just under the U.S. national average of 172 bushels per acre that same year. The comparable national figures were 167.5 bu/acre in 2019 and 177 bu/acre in 2021. Below, we break these down by state and year, show how to pull the exact county- or state-level number USDA has on file right now, and explain why the “bushels per acre” figure moves as much from soil type and weather as from technology.
Introduction: Why Bushels Per Acre Is the Benchmark
“Bushels per acre” is USDA’s standard unit for reporting how much grain a field produced relative to its size, and it is the number every state agriculture overview leads with. It matters because it is the only figure that lets a farmer in Ohio compare directly against a farmer in Kansas or Indiana, regardless of farm size — and because state averages published by USDA NASS become the reference point banks, crop insurers, and input suppliers use when they set expectations for a region.
Two things drive most of the year-to-year swing in this number: growing-season weather (rainfall timing, heat stress during pollination) and soil type. Technology — precision planting, variable-rate inputs, satellite-based crop monitoring — narrows the gap between a farm’s actual yield and its soil’s potential yield, but it does not override a bad growing season. That distinction matters when reading any “yield jumped because of X” claim, including some of the ones in circulation about Ohio’s own numbers.

National Corn Yield Trend: 2019–2021 Bushels Per Acre
USDA NASS’s January 2021 Crop Production Annual Summary put the U.S. national average corn yield at 172.0 bushels per acre for 2020, up from 167.5 bushels per acre in 2019 — a gain of 4.5 bu/acre, or about 2.7%, in a single season (USDA NASS, Crop Production 2020 Summary, January 2021). The following year, USDA’s Charts and Maps series recorded the 2021 national average at 177.0 bushels per acre (USDA NASS, Field Crops Charts and Maps: Corn Yield) — another 5 bu/acre gain, or roughly 2.9%, over 2020.
That three-year run — 167.5, then 172.0, then 177.0 bu/acre — is a genuine upward trend, but it is a national blend of every state’s soil and weather that year, not a technology curve. A single drought-affected state can pull the national number down even while top-performing states set records.

State Corn Yield Per Acre: Ohio, Indiana, Kansas Compared
State corn yield per acre varies far more than the national average suggests, because it reflects each state’s dominant soil order, average rainfall, and growing-season length. Three states with confirmed USDA figures illustrate the spread: Ohio came in at 171 bu/acre in 2020 (USDA NASS Ohio Annual Statistical Bulletin), Indiana hit a state record of 194 bu/acre in 2021 (reported via Purdue University’s summary of the USDA crop report, Purdue Kernel News, August 2021), and Kansas averaged 139 bu/acre in 2021 (USDA NASS Kansas Crop Production Summary, as reported by Morning Ag Clips, 2021 Kansas Crop Production Summary).
Ranked by total output rather than yield, the top corn-producing states are listed in a companion piece.
That 55 bu/acre gap between Indiana (194) and Kansas (139) in the same crop year is almost entirely explained by rainfall and soil moisture-holding capacity — Indiana’s glacial till soils and Corn Belt rainfall pattern outperform the drier, more variable conditions typical of western Kansas. It is not a fair comparison of farm management quality between the two states.
| State | Year | Corn Yield (Bushels/Acre) | Vs. National Average (Same Year) | Source |
|---|---|---|---|---|
| Ohio | 2020 | 171.0 | National avg 172.0 → −0.6% | USDA NASS Ohio Annual Statistical Bulletin |
| Indiana | 2021 | 194.0 | National avg 177.0 → +9.6% | USDA NASS via Purdue Kernel News |
| Kansas | 2021 | 139.0 | National avg 177.0 → −21.5% | USDA NASS via Morning Ag Clips |
| United States (national) | 2019 | 167.5 | — | USDA NASS Crop Production Summary |
| United States (national) | 2020 | 172.0 | — | USDA NASS Crop Production Summary |
| United States (national) | 2021 | 177.0 | — | USDA NASS Charts and Maps |
Two figures readers commonly search for are not in USDA’s published summaries we could confirm for this piece: Iowa’s state-level corn yield per acre for 2019–2021 (USDA’s public releases we reviewed cite total production but not the finalized yield-per-acre figure for those specific years), and Nebraska’s final 2021 corn yield (only a mid-season forecast of 190 bu/acre surfaced, not the finalized actual). Rather than publish an estimate, use the lookup method in the section below — USDA Quick Stats returns the exact, current figure for any state and year in about two minutes.

Ohio Corn Yield Bushels Per Acre: County-Level Detail
Ohio’s statewide average of 171 bu/acre in 2020 is a blend of results that vary meaningfully by region. USDA’s Ohio Annual Statistical Bulletin breaks the state down to the county and district level, and western Ohio counties — which sit on deeper, more uniformly fertile glacial till soils — consistently post yields above the state average, while counties with heavier clay soils or more fragmented field geometry (including urban-adjacent counties) tend to post yields below it.
If you need a specific county’s number rather than the statewide figure, the Ohio Annual Statistical Bulletin PDF (linked below) has the county breakdown; USDA Quick Stats also returns it directly if you filter by county.
- Ohio statewide average, 2020: 171 bu/acre (USDA NASS)
- U.S. national average, 2020: 172 bu/acre (USDA NASS) — Ohio ran 0.6% below the national figure that year
- County-level detail: available in the USDA NASS Ohio Annual Statistical Bulletin (2020–2021)
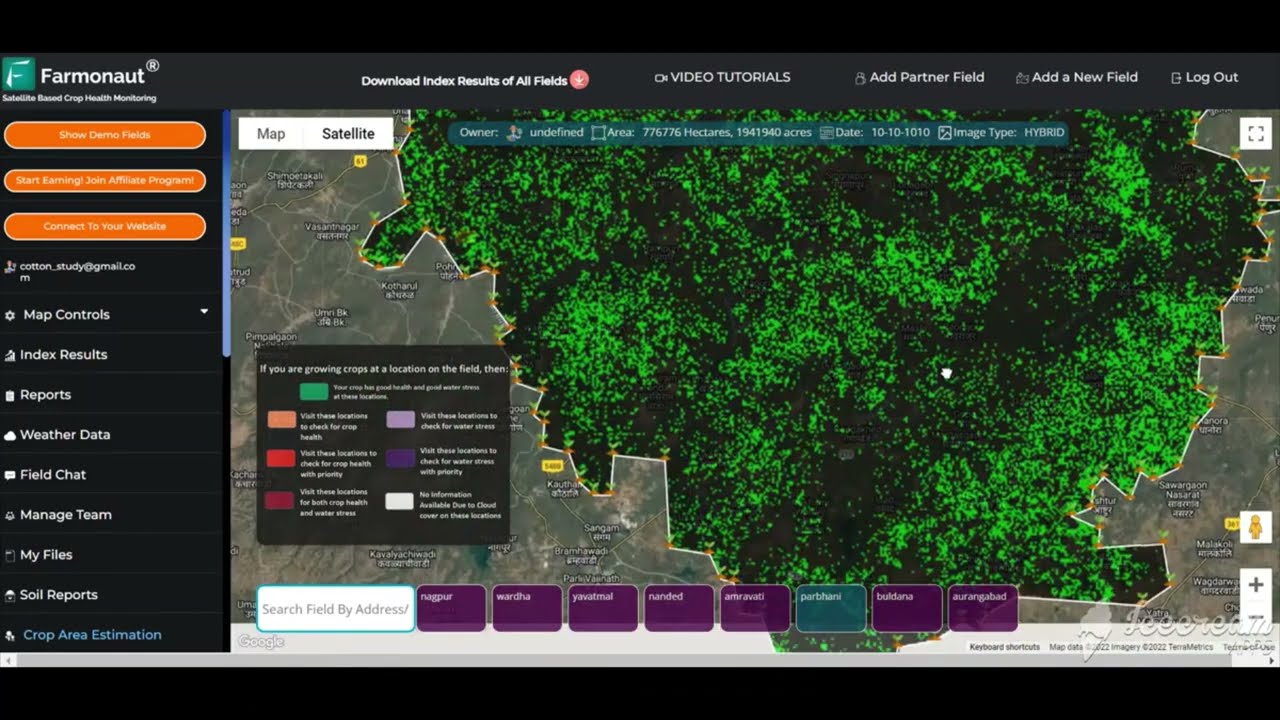
The gap between a state average and a specific field’s actual yield is exactly what precision agriculture tools are built to close. Satellite-based crop monitoring, such as Farmonaut’s platform, tracks vegetation health (via NDVI) across the growing season so a grower can spot a yield-limiting problem — nutrient deficiency, water stress, pest pressure — while there is still time to act, rather than discovering it only when the combine’s yield monitor reports a number below expectations at harvest.

Wheat Bushels Per Acre: National Averages 2023–2025
For readers searching specifically on wheat: USDA’s Small Grains report puts the U.S. national average wheat yield at 50.6 bu/acre in 2023, 51.2 bu/acre in 2024, and 53.3 bu/acre in 2025 (USDA NASS, Small Grains Summary, September 2025). That is a three-year rise of 2.7 bu/acre, or about 5.3%, and it covers all wheat classes combined at the national level.
We did not find a state-by-state wheat yield breakdown in the sources reviewed for this piece — USDA’s Small Grains report and Quick Stats both carry that detail by state and by wheat class (winter, spring, durum), so if you need a specific state’s wheat number, filter Quick Stats by WHEAT, your state, and YIELD, MEASURED IN BU / A.
How to Look Up the Current Year’s Yield Yourself
Every figure above has a shelf life — USDA revises preliminary estimates and publishes new final numbers every year, typically in the Crop Production Annual Summary released each January for the prior year’s harvest. Here is the exact method to pull a number newer than anything in this article:
- Go to USDA NASS Quick Stats at quickstats.nass.usda.gov — this is the same database USDA’s own summary reports are built from.
- Set Commodity to CORN or WHEAT.
- Set Data Item to “YIELD, MEASURED IN BU / A.” This isolates bushels-per-acre from total production (measured in bushels) and planted/harvested acreage, which are reported separately.
- Set Geographic Level to State or County, then pick the specific state (Ohio, Iowa, Kansas, Nebraska, or any other) or county you need.
- Set Year to the crop year you want. Final numbers for a given harvest typically post the following January; county-level detail sometimes lags the state-level release.
- Run the query — Quick Stats returns the figure directly, with the same USDA sourcing this article cites.
For a faster read on Midwest regional trends without building a custom query, Iowa State University’s Ag Decision Maker publishes rolling tables of corn and soybean yields by state and county, refreshed after each USDA NASS release (typically August through December of each year).

Factors Influencing Corn Yield by State
The state-to-state and year-to-year swings documented above trace back to a consistent set of variables. Understanding which one is driving a given number helps separate a genuine management improvement from a weather-driven blip:
- Growing-season rainfall timing: Corn’s most water-sensitive stage is pollination (silking), typically mid-to-late summer in the Corn Belt. A dry spell during that window costs more yield than the same total rainfall deficit spread evenly across the season — this is the single biggest reason a state like Kansas, with more variable summer rainfall, trails Indiana’s more consistent Corn Belt precipitation pattern.
- Soil type and moisture-holding capacity: Deep, fertile soils with strong water-holding capacity buffer against short dry spells. Ohio, Indiana, and Iowa’s glacial till and prairie-derived soils are a structural advantage that no input program fully replicates on thinner or sandier ground.
- Seed genetics: Hybrid selection for drought tolerance, disease resistance, and standability has been a steady contributor to the national upward trend, though seed companies do not publish a clean per-year yield contribution isolated from weather.
- Planting date and season length: Early planting (weather permitting) extends the grain-fill period; a late, wet spring compresses it and typically caps the yield ceiling for that year regardless of management quality.
- Precision and data-driven management: Variable-rate seeding and nutrient application, satellite-based crop monitoring, and in-season scouting reduce the gap between a field’s realized yield and its soil/weather-determined ceiling — but they raise the floor more than they raise the ceiling.
- Post-harvest infrastructure: Grain drying, storage, and transport capacity affect farm profitability and marketing flexibility, though they do not change the bushels-per-acre figure itself.
Tools like fleet management for input logistics and machinery scheduling, or weather API access for tracking rainfall against crop stage in real time, target the management-side factors — they cannot compensate for a season with a genuinely poor rainfall pattern during pollination.

Calculator: Estimate Your Field’s Bushels Per Acre
The figures above are state and national averages — use the calculator below to convert your own field’s harvest weight into a bushels-per-acre figure, and see how it stacks up against the state and national numbers cited in this article.
Run your own numbers
Assumes standard test weights (56 lb/bu for corn, 60 lb/bu for wheat) and USDA standard moisture basis (15.5% corn, 13.5% wheat). It does not account for foreign material discounts, test-weight deviations, or field-edge/headland yield loss — for official reporting, use your elevator's certified scale ticket.
Technology and the Yield Gap Between Counties
Within any single state, the spread between top-performing and average counties is usually wider than the spread between two neighboring states' averages — and that spread is where precision agriculture tools have the most measurable effect. Farms using satellite crop monitoring can detect chlorophyll stress (via NDVI) or water stress days to weeks before it is visible from the road, giving time to correct a nutrient deficiency or irrigation gap before it caps that field's yield ceiling for the season.
- Satellite crop monitoring: Farmonaut's platform and mobile apps deliver NDVI-based vegetation health tracking through the growing season.
- API access for custom integrations: Farmonaut's API and developer documentation let farm management software pull satellite and weather data directly into existing decision-support tools.
- Disease and pest scouting: Early detection of infestation hotspots via remote sensing reduces the yield loss from delayed response.
- Supply chain traceability: Farmonaut's traceability tools document crop origin and handling for buyers who require it.
- Large-scale farm administration: The agro-admin app consolidates monitoring across multiple fields or farms under one account.
- Input and machinery logistics: Fleet management tools track vehicle and equipment utilization to reduce input delivery delays during planting and harvest windows.
None of these close a genuine weather gap — Kansas's 139 bu/acre in 2021 reflects real rainfall conditions that no software changes. What they do is ensure a given field captures as much of its soil-and-weather-determined potential as possible, which is where most of the recoverable yield loss actually sits.

Carbon and Sustainability Reporting
Separate from yield itself, an increasing number of grain buyers and processors ask for documentation of farming practices tied to soil carbon and input use. Farmonaut's carbon footprinting tools and satellite-data API let farms of any size generate that documentation without a separate consulting engagement.
Farmonaut: Satellite Monitoring for Yield Management
Farmonaut provides satellite-based crop monitoring, AI-driven advisory, and blockchain traceability tools designed to help farms of every size — from small family operations to large commercial acreage — track and improve yield outcomes in real time, rather than waiting for the combine's yield monitor at harvest to reveal a problem.



The platform combines multispectral satellite imagery, machine learning, and blockchain-based record-keeping to surface NDVI-based vegetation health, soil moisture status, pest risk mapping, and crop advisory recommendations — aimed at helping growers close the gap between their field's realized yield and its soil-and-weather-determined ceiling.
- API and developer tools: Build custom integrations with the Farmonaut API and its developer documentation.
- Fleet and resource management: Track vehicles, machinery, and input logistics through the fleet management solution.
- Crop loan and insurance support: Satellite-based crop verification for faster, fraud-resistant financial products — learn more here.
Subscription plans are transparent and available at every scale:
FAQ: Corn Yield, Wheat Yield & State Data
What is the U.S. national average wheat yield in bushels per acre?
USDA's Small Grains report puts it at 50.6 bu/acre for 2023, 51.2 bu/acre for 2024, and 53.3 bu/acre for 2025 (USDA NASS Small Grains Summary, September 2025). For a specific state or wheat class, filter USDA Quick Stats by WHEAT and your state.
What was Iowa's corn yield around 2019–2021?
We could not confirm Iowa's finalized state-level yield-per-acre figure for 2019, 2020, or 2021 in the USDA sources reviewed for this piece — the releases we checked report total production rather than the per-acre figure for those specific years. Use USDA Quick Stats (filter: CORN, Iowa, YIELD MEASURED IN BU / A, and your target year) to pull the exact confirmed number directly from USDA's database.
What is the state corn yield per acre, and how does it compare across states?
It varies significantly by state and year based on rainfall and soil type. Confirmed 2021 figures: Indiana 194 bu/acre, U.S. national average 177 bu/acre, Kansas 139 bu/acre. Ohio's confirmed 2020 figure was 171 bu/acre against a 172 bu/acre national average that year. See the comparison table above for sources.
What was the Kansas corn yield in 2019 or 2020?
USDA NASS confirmed Kansas at 139 bu/acre for 2021. We did not find a confirmed 2019 or 2020 Kansas figure in the sources reviewed here — pull it directly from USDA Quick Stats (CORN, Kansas, YIELD MEASURED IN BU / A) for the exact number.
What was Ohio's corn production and yield around 2020–2021?
USDA NASS's Ohio Annual Statistical Bulletin confirmed a statewide average of 171 bu/acre for 2020. We did not find a confirmed statewide 2021 figure in the sources reviewed for this piece; check the current bulletin or USDA Quick Stats (CORN, Ohio, YIELD MEASURED IN BU / A, 2021) for the confirmed number, since preliminary and final estimates can differ.
How do I find the current year's corn or wheat yield for my state?
Use USDA NASS Quick Stats at quickstats.nass.usda.gov. Filter by commodity (CORN or WHEAT), data item ("YIELD, MEASURED IN BU / A"), your state or county, and the year you need. Final numbers for a harvest typically post the following January in USDA's Crop Production Annual Summary.
How do Farmonaut's tools help with yield management?
Farmonaut provides satellite imagery and AI-driven analytics for real-time crop health monitoring, resource optimization, traceability, and fleet management — helping growers catch yield-limiting issues during the season rather than only at harvest.
Where can I try Farmonaut's products?
Try the Farmonaut app/web platform, the API, or browse product traceability, carbon footprinting, fleet management, and crop loan/insurance solutions.
Conclusion: Reading Yield Data Correctly
The confirmed figures here — Ohio at 171 bu/acre in 2020, the U.S. national average moving from 167.5 (2019) to 172.0 (2020) to 177.0 (2021), Indiana's 194 bu/acre state record in 2021, Kansas's 139 bu/acre the same year, and national wheat climbing from 50.6 to 53.3 bu/acre between 2023 and 2025 — tell a consistent story: state averages diverge by 50+ bu/acre in the same year because of rainfall and soil, not because one state's farmers are more skilled than another's.
Where this article could not confirm a specific number — Iowa's 2019–2021 state yield, Nebraska's finalized 2021 figure, Kansas's 2019–2020 figures, or state-level wheat yields — that gap is stated plainly above, with the exact USDA Quick Stats filters needed to pull the confirmed number directly. That lookup method does not expire; the specific figures above will be superseded by USDA's next Crop Production Annual Summary, typically released each January.
For farms looking to close the gap between their own field's yield and their state's or region's average, tools that track crop health during the season — not just at harvest — are where the recoverable yield actually sits.

 Inclusive Growth Chain
 AdBio
AdBio MISE Maroc
 Drift-Sense
 NWNS
NWNS Red August Group
 Farm Inc
 WeMe Global
 Agrotoken
 Blue BearX
 Insignito
 Croptimum
 DnCubed
 Field Capacity
 Indosistim Teknologi
 Liquify Digital
 CU Foods
 BeyondTech Global
