

Forestry · Landowner guide
Sustainable Forestry Practices: 9 BMPs for Landowners
Roads can supply up to 90% of the sediment from forestry work (US EPA), so the cheapest wins start with roads, crossings and stream buffers. Nine practices ranked for private forest owners, with FAO and USDA Forest Service data.
Key takeaways
- Road building and use can contribute up to 90% of the sediment from forestry operations (US EPA).
- All US states have forestry BMPs; in some they are required, in others voluntary (National Association of State Foresters).
- Global net forest loss was 4.12 million ha a year in 2015-2025, down from 10.7 million ha a year in 1990-2000 (FAO FRA 2025).
- The USDA Forest Service burned over 72,000 acres on California national forests in FY 2024, against a 150,000-acre target (California Wildfire and Forest Resilience Task Force).
- US forest area stands at 765 million acres (USDA Forest Service).
In this article
- Sustainable forestry practices at a glance
- What sustainable forestry means in practice
- Why forest practices matter now
- 9 best management practices for forest owners
- Will a thinning still pay once stream buffers are set aside?
- Sustainable forestry practices on farms and ranches
- California example: fire, water and treatment pace
- How to choose which practices to start with
- How we checked the numbers
- Rules, permits and professional help
- FAQ
Sustainable forestry practices are the steps that let a forest keep giving timber, clean water, wildlife habitat and stored carbon year after year without running the resource down. For most private owners in the US, Canada, the UK and Australia, the core list is short: a written management plan, careful roads and stream crossings, streamside buffers, thinning, prescribed fire where it fits, prompt regeneration, pest checks, habitat care and an outside audit. The US Environmental Protection Agency notes that roads alone can supply up to 90 percent of the sediment from forestry work, so the cheapest wins often sit on the ground you drive on, not in the trees you cut.
This guide ranks nine best management practices by what they protect, says who each one suits, and gives dated numbers from the FAO, the EPA and the USDA Forest Service. It also has a calculator that tests whether a thinning still pays once stream buffers are set aside, and three charts on forest change and prescribed fire.
Sustainable forestry practices at a glance
The table sums up the nine practices. Each has its own section below, with sources where they exist. The order follows a simple logic: plan first, protect water and soil second, then work the trees.
| Practice | Main thing it protects | Best for | Typical first step |
|---|---|---|---|
| 1. Management plan | Long-term goals and records | Every owner | Walk the land with a forester |
| 2. Roads and crossings | Water quality, soil | Tracts with any road or skid trail | Map roads, culverts and wet spots |
| 3. Streamside zones | Stream shade, banks, fish | Land with creeks, ponds or springs | Mark buffers before any harvest |
| 4. Thinning | Tree growth, fire risk | Dense, even-aged stands | Ask for a timber cruise |
| 5. Prescribed fire | Fuel loads, fire-adapted plants | Pine, oak and western mixed-conifer stands | Contact a burn association |
| 6. Regeneration | Future forest cover | Any tract after harvest | Plan planting or natural seeding |
| 7. Pest checks | Tree health, timber value | Stands near known outbreaks | Set a yearly walk-through |
| 8. Habitat care | Wildlife, old trees, deadwood | Owners who value hunting or birds | Leave snags and den trees |
| 9. Certification | Market access, trust | Owners who sell timber regularly | Join a group certificate |
Look at the whole tract, not only the trees. Many water problems start at a single culvert that is too small or a skid trail that runs straight downhill. Walk the land after a heavy rain: brown water in a ditch or a cut bank that keeps slumping shows where the next repair should go. Fixing one bad crossing can do a lot for a stream.
What sustainable forestry means in practice
The FAO describes sustainable forest management as a changing concept that aims to keep and improve the economic, social and environmental values of all forests for people now and in the future. That is the goal. Best management practices, often shortened to BMPs, are the toolkit used to reach it on the ground.
The two terms are often mixed up, but they answer different questions. “Sustainable” asks whether the forest will still give the same mix of benefits in 50 years. A BMP asks whether a specific job, such as building a road or felling near a creek, was done in a way that keeps soil and water in place. A forest can follow every BMP on one harvest and still be run down over decades if regrowth never catches up with cutting. That is why a plan and regular checks matter as much as any single practice.
A quick test for any claim of “sustainable” is to ask what gets measured and how often. A property in a third-party scheme, such as the Forest Stewardship Council or the Sustainable Forestry Initiative, is audited against a published standard. A property that simply says it uses sustainable methods, without naming a standard or showing records, gives you nothing to check.
Many countries set out their own rules. In the UK, the UK Forestry Standard is the government’s technical standard for sustainable forest management and applies to all woodland, whoever owns it. Its 5th edition applies from 1 October 2024 for woodland work in England; approvals received before that date are still assessed under the 4th edition. In the US there is no single federal rule; each state runs its own BMP program.

▶ Seven simple sustainable practices that protect soil and water on a farm, explained with humor. · 4:34
Why forest practices matter now
Forests are still shrinking worldwide, though more slowly than in the 1990s. The FAO Global Forest Resources Assessment 2025 puts global net forest loss at 10.7 million hectares a year in 1990 to 2000, 3.68 million hectares a year in 2000 to 2015 and 4.12 million hectares a year in 2015 to 2025. The rate rose again in the last period because forest gain slowed, not because clearing sped up.
Chart
Global forest loss per year
Million hectares per year, FAO reporting periods
Clearing itself has fallen. In the tropics, where most loss happens, FAO estimates deforestation fell from 15.9 million hectares a year in 1990 to 2000 to 9.42 million hectares a year in 2015 to 2025. Net change and deforestation are not the same thing: net change subtracts new forest from lost forest, while deforestation counts only forest turned into farms, towns or roads.
In North America the picture is mixed. FAO reports that the United States had a net forest gain of 430,000 hectares a year in 2000 to 2015 and a net loss of 120,000 hectares a year in 2015 to 2025. Canada’s yearly net gain slowed from 513,000 hectares to 82,500 hectares over the same two periods. FAO itself warns that these change estimates should be read with caution, because many countries do not collect data on every part of the change.
The US still has a large forest base. The USDA Forest Service national report on sustainability indicators puts US forest area at 765 million acres. A large share is privately owned, which means the day-to-day choices of landowners, loggers and foresters decide how well much of it is cared for.
Chart
Yearly net forest change in North America
Thousand hectares per year; negative means net loss
9 best management practices for forest owners
These are ranked by how much they protect for the effort needed. The first three prevent the most common damage to water and soil. The later ones need more skill, money or time. Not every practice suits every tract, so each has a “Best for” line.
1. Write a forest management plan
Best for: every owner, from a 10-acre farm woodlot to a large timber holding.
A plan sets out what you want from the land, what is there now, and what work happens in which year. It should include a map of stands, roads and water, a basic inventory of tree species and sizes, and a schedule of jobs. A plan written with a professional forester is often the entry ticket to cost-share programs and certification.
Keep the plan short enough to use. Two or three pages with a map, a stand table and a job list are better than a thick binder no one opens. Review it every few years, and after any big event such as a fire, storm or sale.
Pros: low cost, sets priorities, creates records buyers and auditors want. Cons: only useful if you update it and act on it.
2. Plan roads, landings and stream crossings with care
Best for: any tract with a road, skid trail or log landing.
The EPA’s page on nonpoint source pollution from forestry names road building and road use as the main source of polluted runoff on forest land, contributing up to 90 percent of the sediment from forestry operations. Good practice means roads on gentle grades, water turned off the road surface often, culverts sized for big storms, and landings kept away from streams.
The EPA’s national management measures for forestry give separate guidance for streamside areas, road building and road upkeep. After a harvest, close and seed skid trails and roads you no longer need.
Pros: large water-quality gain, cuts repair bills. Cons: extra upfront cost for culverts, rock and design.
3. Keep streamside management zones
Best for: land with creeks, ponds, springs or wet areas.
A streamside management zone is a strip along water where cutting is limited and machines are kept out. The EPA explains that harvesting beside a stream can raise water temperature by removing shade and can weaken banks by removing plants that hold them. Both harm fish and other aquatic life.
Buffer widths differ by state, stream type and slope, so check your state’s BMP manual. The National Association of State Foresters says all states have developed forestry BMPs, that most began in the 1970s, and that in some states they are required while in others they are voluntary or quasi-regulatory. The calculator further down shows how much of a tract a buffer takes out of a harvest.
Pros: protects water, fish and banks; often required by law. Cons: leaves some timber unharvested.
4. Thin overcrowded stands
Best for: dense, even-aged stands where trees compete for light and water.
Thinning removes some trees so the rest grow faster and stay healthier. In fire-prone western forests it also cuts ladder fuels, the small trees and brush that carry fire from the ground into the crowns. Thinning before a prescribed burn helps the burn run at low intensity.
Whether a thinning pays depends on log prices, haul distance and how much timber is left out for buffers. Early thinnings of small trees often cost money; later ones can earn it. Ask for a written timber cruise and more than one bid before you sign a sale contract.
Pros: faster growth on the best trees, lower fire risk. Cons: may not pay in small-diameter stands; poor work damages the trees left behind.
5. Use prescribed fire where it fits
Best for: fire-adapted forests such as southern pine, oak woodland and western mixed conifer.
A prescribed burn is a planned fire lit under set weather and fuel conditions. It reduces fuel, recycles nutrients and favors plants that need fire. The California Wildfire and Forest Resilience Task Force reports that reintroducing fire also helps limit the spread of pest insects and disease.
Burning needs a plan, trained crew, permits and suitable weather days. Many regions have landowner burn associations that share crews and equipment. Follow local rules and air-quality permits, and never burn without the required approvals.
Pros: low cost per acre once set up, restores fire-adapted habitat. Cons: narrow weather windows, permit limits, escape risk.
6. Regenerate promptly after harvest
Best for: every tract after a final harvest or a disturbance such as fire or windthrow.
A forest is only sustainable if new trees replace those taken. That can happen by planting, by leaving seed trees, or by natural sprouting from stumps and roots. The choice depends on species and site. Check survival a year or two later and replant gaps.
Match the species to the site. Trees suited to the soil, slope and local climate survive better and need less care. Deer and other browsing animals can wipe out young seedlings, so tree shelters or fencing may be needed on small plantings. Keep weeds down around new trees for the first few seasons.
Pros: keeps the forest a forest, protects soil. Cons: planting stock and browse protection cost money.
7. Check for pests and disease every year
Best for: stands near known outbreaks of bark beetles, sudden oak death or invasive insects.
Early detection limits spread. A yearly walk-through, plus a look after drought or storm damage, catches most problems while they are still small. Satellite maps can show where the canopy is losing green faster than the rest of the stand; they flag a change, not its cause, so someone still needs to visit the spot. Follow the label and local rules for any pesticide, and get advice from your state forestry agency or extension service.
Pros: cheap insurance for timber value. Cons: needs someone who knows what to look for.
8. Manage for wildlife, old trees and deadwood
Best for: owners who value hunting, birds or biodiversity alongside timber.
Leave some standing dead trees (snags), den trees and fallen logs. Keep a mix of tree ages and species, and avoid breaking up corridors that link habitat. These steps cost little timber and give a large return in wildlife.
Pros: more wildlife, more resilient stands. Cons: small loss of timber volume; snags near roads and trails must be checked for safety.
9. Get certified or audited
Best for: owners who sell timber often or to buyers who ask for certified wood.
Certification schemes check your practices against a published standard. Small owners can often join group certificates, which share the audit cost. Even without a label, an outside review of your plan and records shows where you are slipping.
Pros: market access, outside check on your work. Cons: fees and paperwork.
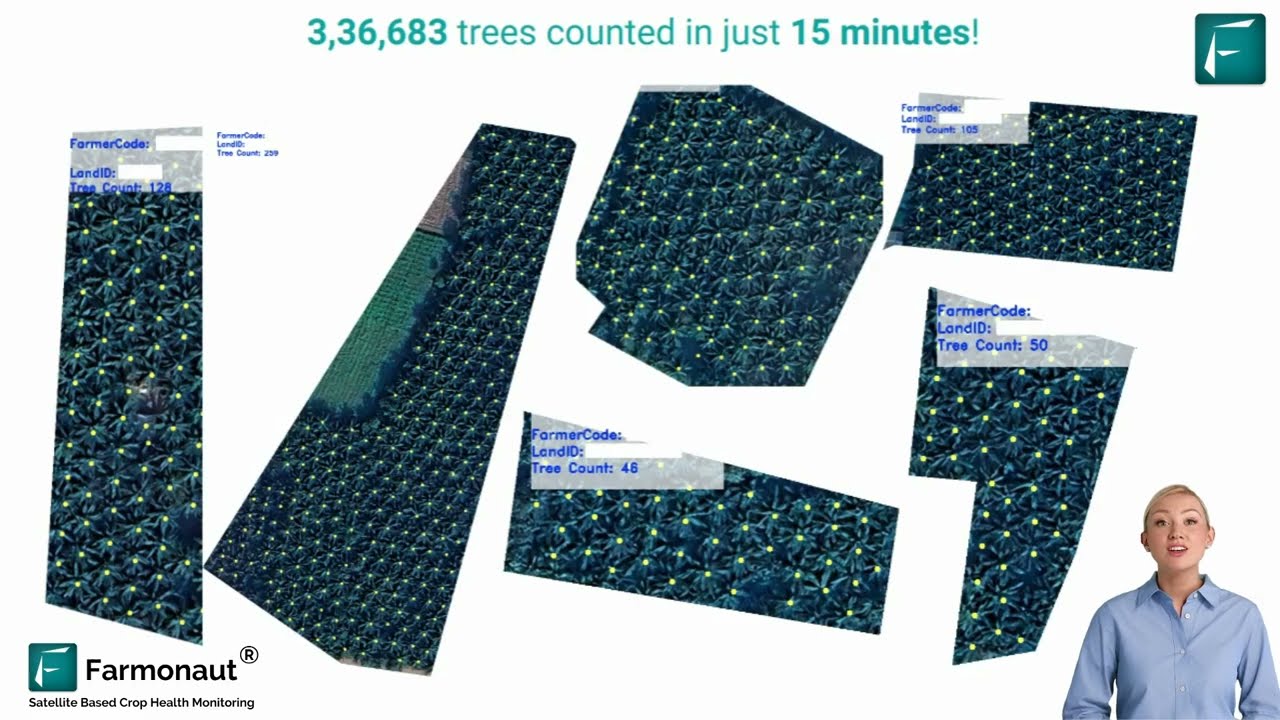
▶ How satellite imagery and AI detect, count and map individual trees across a plantation. · 4:05
Will a thinning still pay once stream buffers are set aside?
Stream buffers keep timber out of a sale. This calculator shows how much area a buffer takes on your tract and what the net result of a thinning looks like on the rest. Enter your own tract size, stream length, buffer width and the per-acre revenue and cost from your forester’s bid.
The default numbers are examples set close to break-even, not benchmarks. Real buffer widths come from your state’s BMP manual, and real prices come from local bids.
Try the numbers for your own farm below.
Calculator
Will a thinning pay after stream buffers?
Enter your own tract, stream and bid numbers.
- Buffer area: 4.6 acres
- Harvestable area: 95.4 acres
- Share of tract in buffers: 0.0%
- Net per harvested acre: $20
Example values only, set near break-even; not benchmarks or forecasts. Buffer area = stream length x buffer width on each side x 2 sides / 43,560 sq ft per acre. The calculator assumes no harvest inside the buffer; many states allow partial harvest there, so check your state’s BMP manual. Revenue and cost per acre should come from your forester’s cruise and bids.
Sustainable forestry practices on farms and ranches
Many farms and ranches include woodland, windbreaks or shelterbelts. The same practices apply at a smaller scale. A farm woodlot benefits from a plan, careful access tracks, buffers along ditches and creeks, and a schedule for thinning and replanting.
Trees on farms also help the crops and livestock around them. Windbreaks cut wind speed and soil loss, shade cuts heat stress in animals, and buffer strips along fields trap sediment and nutrients before they reach water. Agroforestry, which mixes trees with crops or grazing, is one way to combine the two. FAO reports that 91 countries and areas reported 55.4 million hectares of land under agroforestry in 2025, though it says reporting coverage is low.
Forest health and farm health are linked in other ways too. Wildfire that starts in dense forest can reach orchards, vineyards and pasture. Pests can move from stressed forest stands to farm trees. Forested watersheds also supply much of the country’s water: the state foresters’ association estimates that more than 50 percent of US drinking water comes from forested land.
Here is a simple seven-step routine for owners who manage both farm and forest:
- Map your woodland, windbreaks and water on the same farm map.
- Set one goal for each block: timber, shelter, wildlife or water.
- Keep machines and stock out of buffers along creeks and ditches.
- Thin crowded blocks and replant gaps.
- Walk the woodland once a year and after storms.
- Keep fuel low near buildings, orchards and fences.
- Record what you did and when.

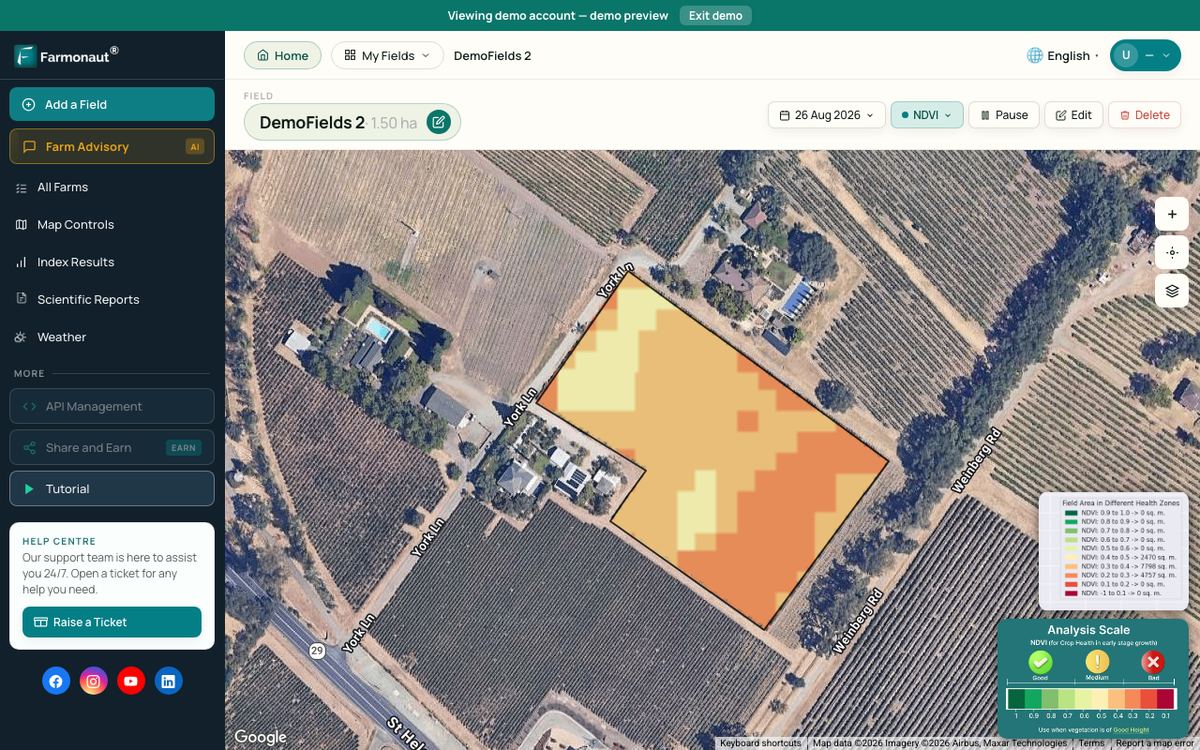
▶ How satellite NDVI maps show plant stress across a large farm before it is visible on the ground. · 4:09
California example: fire, water and treatment pace
California shows why the pace of work matters as much as the choice of practice. The USDA Forest Service treated over 325,000 acres for forest health on California national forests in the 2024 fiscal year, including more than 72,000 acres of prescribed burning. The previous prescribed-fire record, set in 2018, was 63,711 acres.
Chart
Prescribed fire on California national forests
Acres burned by the USDA Forest Service, with the yearly beneficial-fire target
By 24 June 2024 the agency had already treated 63,878 acres with prescribed fire on national forests in the state, passing the 2018 record before the fiscal year ended. Its target under California’s Strategic Plan for Expanding the Use of Beneficial Fire is 150,000 acres of beneficial fire, so the FY 2024 record was still about half of that goal.
For private owners in the state, the same lesson holds at a smaller scale. A plan that lists 50 acres of thinning a year is only useful if crews, permits and burn days allow it. Track acres actually treated against acres planned, and adjust the plan when the gap grows.
How to choose which practices to start with
Few owners can do everything at once. Use these steps to decide the order:
- Start with water. If you have streams or wet areas, fix roads and crossings and mark buffers first. These prevent the damage that is hardest to undo.
- Then fire risk. In fire-prone regions, thinning and fuel work near homes and farm buildings come next.
- Then growth. Thinning for timber value and regeneration after harvest keep the forest productive.
- Then habitat and markets. Wildlife work and certification add value once the basics are in place.
Ask three questions before any job: What will this protect? What will it cost per acre? How will I know it worked? If you cannot answer the third, add a simple check, such as photos from the same spot each year or a note of acres treated.
Costs and grants change often. Check current cost-share programs with your state forestry agency, your local conservation district or, in the UK, the forestry regulator. For tax, contract or legal questions about a timber sale, get professional advice.
How we checked the numbers
We used only figures we could trace to a named publisher and date. Global forest change figures come from FAO’s Global Forest Resources Assessment 2025. US forest area comes from the USDA Forest Service sustainability indicators report. Road sediment and streamside effects come from the US EPA. State BMP facts come from the National Association of State Foresters. California prescribed-fire acres come from the California Wildfire and Forest Resilience Task Force, which reports USDA Forest Service results.
We removed claims from the earlier version of this page that we could not trace to a primary source, such as statewide totals for watershed restoration and figures for reforestation funding. The ranking above reflects our judgment of protection per unit of effort, not a published score.
When you hire a logger, write the BMPs into the contract: where the landings go, which crossings to use, how wide the buffers are and how trails are closed afterwards. Visit during the job, not only at the end. A short checklist signed by both sides avoids most disputes over damage and payment.
Rules, permits and professional help
Forest work is regulated differently in each place. In the US, the state BMP programs range from voluntary to required, and the Clean Water Act exempts normal silvicultural activities from federal discharge permits, though states may still set their own rules. In the UK, woodland work is measured against the UK Forestry Standard.
Before you cut, burn, spray or build a road, check local rules, get the permits you need and follow the label on any chemical. A registered or consulting forester can write your plan, mark buffers, run a timber sale and check the logger’s work.
Farmonaut Satellite + AI Farm Monitoring System can show vegetation maps of a woodlot or farm block over time, which helps you spot areas that need a visit.
Related reading on this site: Billionaires Buying Farmland in California: The Trend of Stockpiling Food.
FAQ
What are sustainable forestry practices?
They are the methods that keep a forest producing timber, water, habitat and carbon over the long term. The main ones are a management plan, careful roads, streamside buffers, thinning, prescribed fire where suited, regeneration, pest checks, habitat care and certification.
What is the difference between sustainable forestry and BMPs?
Sustainable forestry is the long-term goal. Best management practices are specific, repeatable steps, such as building a road on a gentle grade or keeping a buffer along a creek, that protect soil and water during forest work.
Are forestry BMPs required by law?
It depends on where you are. The National Association of State Foresters reports that US states differ: in some BMPs are required, in others voluntary or quasi-regulatory. Check your state forestry agency or local rules.
What are seven strategies for healthy forests?
A common short list is fuel reduction and thinning, prescribed fire, watershed and stream restoration, biodiversity planning, pest and disease control, carbon-minded management and protection of roads and communities. Our list of nine adds a written plan and certification.
How does sustainable forestry help farms?
Healthy forests and windbreaks protect water supplies, cut soil loss and wind damage, and lower the risk of wildfire and pests spreading onto farmland. Farm woodlots can also earn income from timber.
Related pages on our site: carbon footprinting, product traceability, fleet management, agro admin app, crop loan and insurance, satellite and weather API docs and the Farmonaut app.
Farmonaut farm monitoring
See your woodland and fields from space
Draw your farm and woodlot blocks once and Farmonaut shows satellite vegetation maps for them through the season, on web, Android or iOS.



Keep reading
Sources
- US EPA, Nonpoint Source: Forestry: epa.gov
- US EPA, National Management Measures to Control Nonpoint Source Pollution from Forestry: epa.gov
- National Association of State Foresters, Best Management Practices: stateforesters.org
- FAO, Global Forest Resources Assessment 2025, Forest extent and change (2025): openknowledge.fao.org
- FAO, Sustainable forest management: fao.org
- USDA Forest Service, National report on sustainable forests, Indicator 1.01 forest area: research.fs.usda.gov
- UK Government, The UK Forestry Standard (5th edition): gov.uk
- California Wildfire and Forest Resilience Task Force, USFS record prescribed fire year (November 2024): wildfiretaskforce.org
- California Wildfire and Forest Resilience Task Force, California national forests record prescribed fire acres (June 2024): wildfiretaskforce.org
- NC Forest Service, Forestry BMP manual: ncforestservice.gov
Discussion
Questions, corrections or field experience? Share them below. First-time comments are reviewed before they appear, and your email is never published.
No comments yet. Be the first to add a question or your experience.

 Reddane Farming
 Esri North East Africa
 Farmer Amigo
 Cresol
 Atur Kuliner
 MDCV UK
 Zerella Group
 Etech Consulting Madagascar
 Vestlandsforsking
 Agritein
 Delicio
 WB Dev
 Sama Premium
 Prochecker
 Tres Valles
 LACOS Geoinformation
 Magrifly
 LatConnect 60
 Blickwinkel
 Agricultural Credit Policy Council
 Exploration consultancy · South Africa · Gold
 Licence holder · Niger · Gold
 Licence holder · Nigeria · Gold + lithium










