

Reviewed September 2026 against the University of Missouri Rural and Farm Finance Policy Analysis Center’s Fall 2025 Nebraska Farm Income Outlook and USDA’s Economic Research Service farm income data.
Try it: Run your own numbers →
Nebraska farmers are not broke as a group — statewide net farm income is projected to rise in 2025 — but the crop side of the balance sheet has weakened sharply since 2022, and a subset of grain-heavy operations are under real financial stress from tariffs, low commodity prices, and debt costs. Those two facts sound contradictory until you separate statewide averages from what is happening to row-crop farms specifically. This article walks through both, using the most recent published figures, and gives you a way to check the numbers yourself as new data comes out.
Table of Contents
- Nebraska Farm Income: The Actual Numbers
- Impact of Tariffs on Nebraska and American Farmers
- Are Nebraska Farmers “In Trouble”? Sorting the Claim
- Farm Bankruptcies and Debt Nationally
- Soil Health and Drought: The Non-Trade Pressures
- Farming Pressures Beyond the US Border
- Monitoring Tools for Farmers Under Financial Pressure
- Calculator: Crop Receipts Decline Impact
- FAQ
- Try it: Run your own numbers
Nebraska Farm Income: The Actual Numbers
The University of Missouri’s Rural and Farm Finance Policy Analysis Center (RaFF) publishes a Nebraska-specific farm income outlook twice a year, drawing on USDA data and state-level crop and livestock projections. The Fall 2025 edition, released October 2025, projects Nebraska net farm income at $8.42 billion for 2025 — up $2.48 billion from 2024. That increase is real, and it is the headline number that contradicts a blanket “Nebraska farmers are broke” claim.
But the same report identifies the source of the underlying stress: Nebraska crop receipts have fallen roughly 30% since their 2022 peak. Corn and soybean prices spiked in 2022 on the back of the war in Ukraine and tight global grain stocks, then came back down as global supply recovered. Farms that expanded acreage, bought equipment, or locked in higher rent and input costs during the 2022 peak are now collecting substantially less revenue per bushel while carrying costs set at 2022 levels. That is the gap between “state income is up” and “row-crop farmers feel squeezed” — livestock and other income lines are carrying the state average while crop receipts pull the other way. Read the full report at the source below before citing the topline number in isolation.
Fall 2025 Nebraska Farm Income Outlook (University of Missouri RaFF)
Nationally, the picture rhymes. USDA’s December 2024 revision put 2024 US net farm income at $127.8 billion. USDA’s Economic Research Service then projected 2025 net farm income at $179.5 billion — a jump driven substantially by $40.5 billion in projected direct government payments to farmers in 2025, a figure that includes trade-related and disaster assistance programs, not just baseline farm bill payments. Strip out the direct payments and the picture of underlying market income looks considerably weaker than the topline suggests.
USDA ERS farm income and government payment projections
Nebraska vs. US Farm Income at a Glance
| Metric | Nebraska | United States |
|---|---|---|
| Net farm income, most recent full year (2024) | ≈ $5.94 billion (derived: 2025 projection minus stated $2.48B increase) | $127.8 billion (USDA December 2024 revision) |
| Net farm income, 2025 projection | $8.42 billion | $179.5 billion |
| Direction vs. prior year | Up $2.48 billion | Up roughly $51.7 billion |
| Known drag on the total | Crop receipts down ~30% since 2022 peak | Market income offset by $40.5 billion in projected direct government payments |
| Source | Fall 2025 RaFF Report, Univ. of Missouri | USDA ERS / USDA December 2024 revision via DTN |
Both figures are projections tied to a specific reporting cycle, not settled final accounts. USDA ERS revises its farm income forecast three times a year (typically February, August, and November); RaFF publishes Nebraska-specific updates twice a year, spring and fall. If you’re reading this more than a few months after September 2026, go to the RaFF page above and the ERS chart link above directly — both are stable URLs that get updated in place with the newest release.

Impact of Tariffs on Nebraska and American Farmers
Nebraska is a top-five US producer of both corn and soybeans, and soybeans are the crop most exposed to retaliatory tariffs from China, historically the largest export buyer of US soybeans. USDA trade analysis put US soybean exports to China at 218 million bushels for 2025 to date — a volume tracked and reported through USDA’s ongoing trade data releases, meaning the final-year figure will differ from any mid-year snapshot. Farm Policy News at the University of Illinois separately reported that US farmers cut soybean plantings by 3.1 million acres for the 2025 growing season, shifting that acreage toward corn, which had comparatively stronger price support at planting time.
Farm Policy News: tariffs and the 2025 corn-soybean acreage shift
That acreage shift is the direct, measurable channel through which tariffs reach a Nebraska farm’s planting decision: when the export market for one crop looks uncertain, farmers plant less of it and more of a crop with a steadier buyer, regardless of what the land is actually best suited to grow in rotation. The tradeoff shows up later as soil and pest-management costs — continuous corn without a soybean break year increases nitrogen requirements and rootworm pressure, an agronomic cost that doesn’t appear in any trade statistic.
On the question of exact tariff percentages by commodity, the research available for this article documents the trade volume and acreage effects but not a single, current, per-commodity tariff rate — those rates change with negotiation status and are set at the federal level, not the state level. The US Trade Representative’s office (ustr.gov) and USDA’s Foreign Agricultural Service publish current tariff schedules and retaliatory-tariff lists; check those directly for the rate applicable to a specific commodity and trading partner rather than relying on a rate quoted in any single article, because these figures shift with each round of negotiation.

Federal support has partly offset the trade disruption at the national level: the $40.5 billion in projected 2025 direct government payments cited above includes trade-mitigation assistance layered on top of standard farm bill support. Nebraska’s federal and state subsidy programs are the mechanism through which that national figure reaches an individual operation — eligibility and payment rates vary by program and by crop, so a farm’s actual receipt depends on which programs it is enrolled in.
Are Nebraska Farmers “In Trouble”? Sorting the Claim
The honest answer is: it depends which Nebraska farm you mean. The statewide net farm income figure — $8.42 billion projected for 2025, up from roughly $5.94 billion in 2024 — says the sector as a whole is not in crisis. But that total blends crop and livestock income, and cattle prices have been historically strong through this period, which cushions the statewide number even as row-crop margins compress. A farm that is 80% corn and soybean acreage with rent or debt payments locked in during the 2022 price peak is in a materially different position than a diversified operation with a large cattle herd.
The specific claim “Nebraska farmers are going broke” does not hold up against the RaFF income projection, which shows income rising, not falling. What is verifiably true is narrower and less dramatic: crop receipts are down about 30% from a two-year-old peak, which is a real margin squeeze for grain-dependent operations, particularly ones that took on debt or expanded rent obligations when 2022 prices made that expansion look affordable. That is a solvency risk for a specific segment, not evidence of sector-wide collapse.
What Would Actually Indicate Nebraska Farms Are in Trouble
- Falling statewide net farm income for two consecutive RaFF reporting periods, not just falling crop receipts within a rising total — check the RaFF page linked above each time it updates.
- Rising Chapter 12 bankruptcy filings specifically in Nebraska’s federal district — the national Chapter 12 count is documented below, but a state-specific count requires checking the US Courts filings directly (method described in the bankruptcy section).
- Farm debt-to-asset ratios climbing at the state level — USDA’s Economic Research Service and the Federal Reserve Bank of Kansas City (whose district includes Nebraska) both publish quarterly farm credit conditions surveys.
- Land values falling rather than merely flattening — a leading indicator lenders watch closely, published annually by the University of Nebraska–Lincoln’s Department of Agricultural Economics.
None of those four conditions is confirmed by the sources gathered for this article as of the Fall 2025 RaFF report. The accurate framing is “margin pressure on grain farms inside a statewide income increase,” not “Nebraska farms in trouble” as a blanket statement — and that distinction matters for anyone making a lending, land purchase, or policy decision based on the headline.
Farm Bankruptcies and Debt Nationally
Where the debt-stress signal is clearest is in the national Chapter 12 bankruptcy data. US Courts recorded 216 Chapter 12 farm bankruptcy filings in 2024, a 55% increase over 2023, according to Farm Policy News’ analysis of US Courts records. Chapter 12 is a bankruptcy chapter written specifically for family farmers and fishermen with regular income, and a rising filing count is one of the most direct measures of farm financial distress because it requires an actual insolvency event, not a survey response.
Farm Policy News: Chapter 12 farm bankruptcies up 55% in 2024
Total US farm debt was projected at $561.8 billion for 2024, per USDA figures cited by the American Farm Bureau Federation. That is aggregate debt across real estate and operating loans nationwide, and it sits alongside the bankruptcy increase as the two hardest national data points behind “farmers are under financial strain” as a broader story, separate from Nebraska’s specific income trajectory.
These are national figures — the research available for this article did not include a Nebraska-specific Chapter 12 filing count. US Courts publishes bankruptcy statistics by federal judicial district, and Nebraska is its own district (District of Nebraska); to get the state-specific count, check the US Courts website’s bankruptcy statistics tables, which are refiled annually, typically in the first quarter for the prior full year.
Soil Health and Drought: The Non-Trade Pressures
Trade and income are only part of what’s squeezing margins. Soil degradation and water availability set the ceiling on yield regardless of price, and both compound the financial pressure documented above by reducing the bushels a farm has to sell into whatever price the market offers. The University of Nebraska–Lincoln’s agronomy and natural resources faculty maintain ongoing soil health and drought monitoring research; because specific yield-per-acre and drought-severity figures for the current growing season were not part of the research gathered for this piece, check the University of Nebraska–Lincoln Institute of Agriculture and Natural Resources (IANR) site and the US Drought Monitor (maintained jointly by NOAA, USDA, and the University of Nebraska–Lincoln) directly for the current-season numbers, since both update weekly during the growing season.
Practices with documented yield benefit in drought-prone soils include cover cropping, reduced tillage, and crop rotation — all aimed at increasing soil organic matter and water-holding capacity so the same rainfall goes further. These are the same soil-management fundamentals used well beyond Nebraska; the underlying soil management practices apply to any operation trying to build resilience against inconsistent rainfall, and satellite-based soil moisture and vegetation health monitoring gives a farm a earlier read on where a field is falling behind than a visual inspection alone.
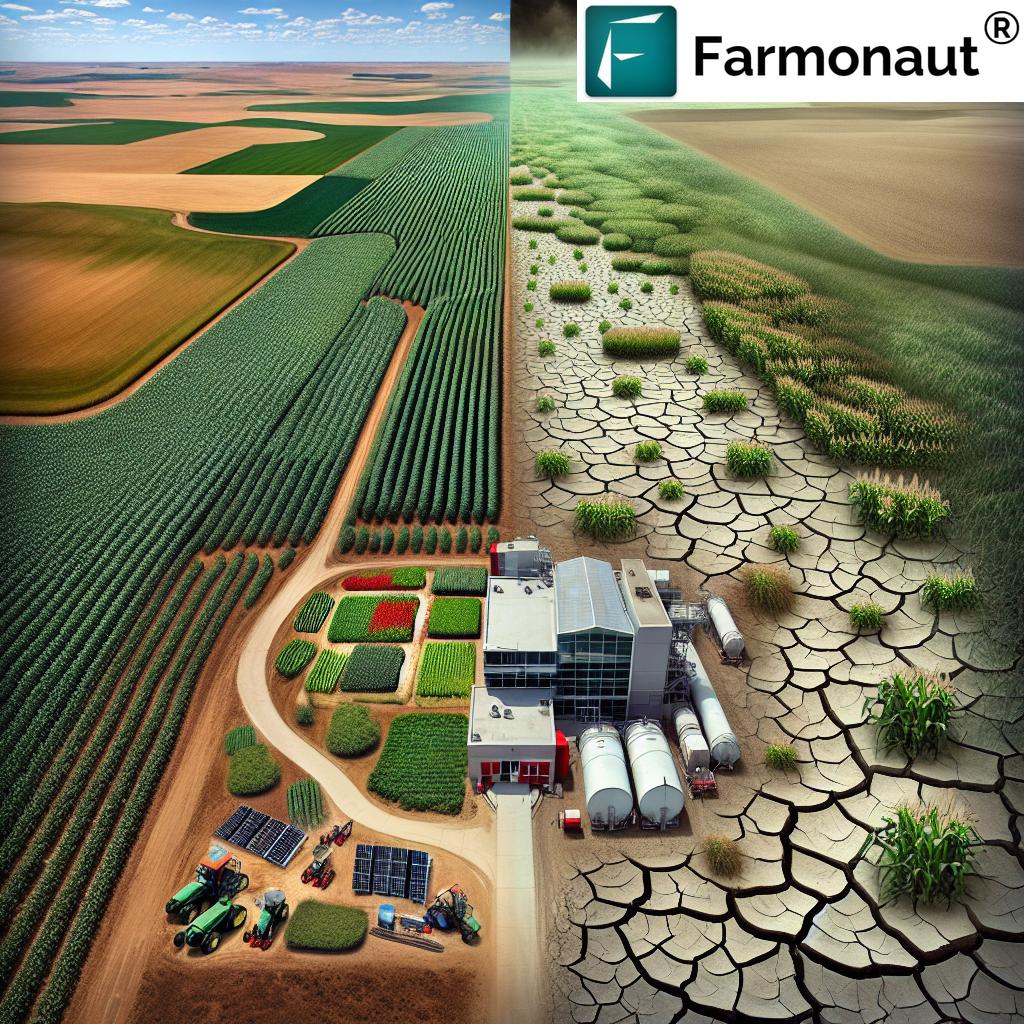
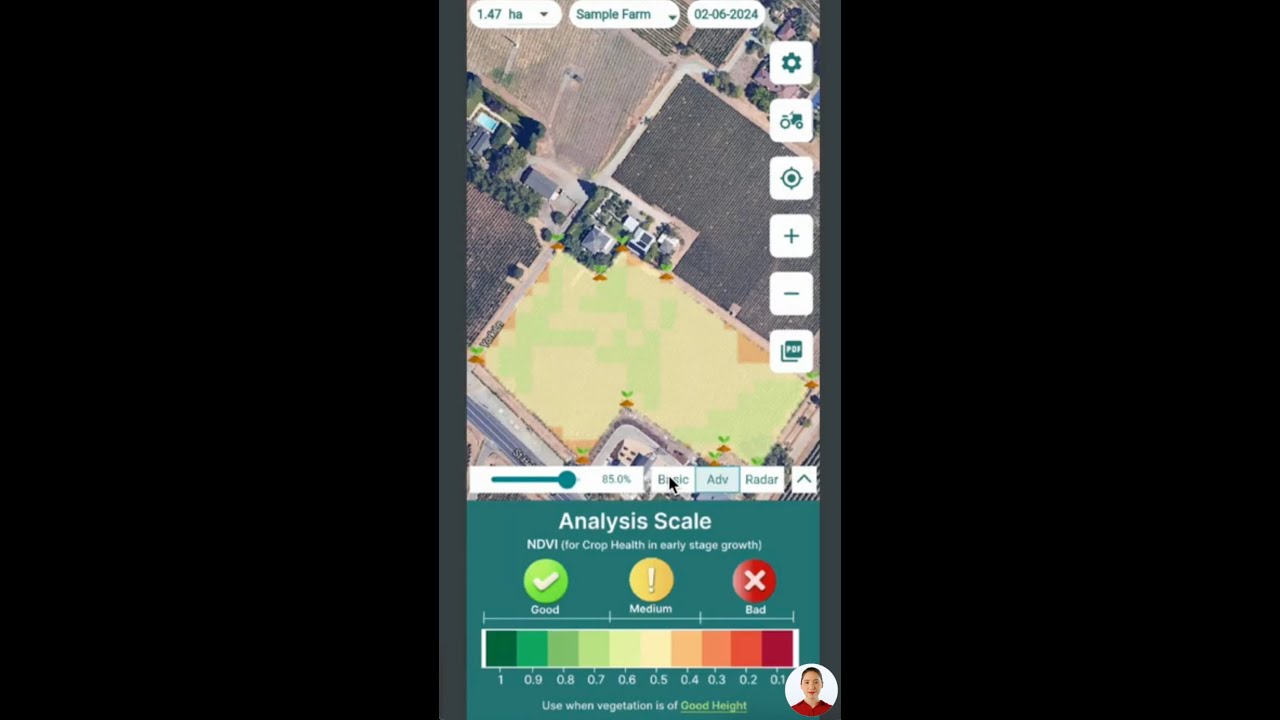
Satellite crop health monitoring, of the kind Farmonaut’s platform provides, doesn’t change a rainfall total or a soybean tariff rate, but it does let a farm catch a moisture-stressed field or a fertility gap early enough to act — adjusting irrigation timing or a targeted fertilizer application — before the yield loss is locked in. On a margin as thin as the one described in the income section above, a few extra bushels per acre recovered through earlier intervention is a meaningfully different outcome at settlement time.
Farming Pressures Beyond the US Border
Farmers south of the US border face a distinct set of structural challenges that are not reducible to the tariff and income pressures described above for Nebraska. Smallholder operations in Mexico’s countryside contend with fragmented land tenure (many holdings are under 5 hectares), limited access to formal credit and crop insurance, rural-to-urban migration that shrinks the available agricultural labor force, and water scarcity that is more acute and more structurally embedded than the drought cycles discussed in the Nebraska soil-health section above. The research gathered for this article did not include current Mexican government agency figures (SADER, INEGI) on these specific pressures, and this piece is scoped to US and Nebraska agriculture — a reader looking for a full treatment of Mexican farming conditions should consult SADER and INEGI directly rather than a US-focused source stretching to cover it secondhand.
What is directly relevant to the US side of this story: Mexico is one of the largest destination markets for US corn exports, and Mexico is also a major supplier of fruits and vegetables into the US market. Trade friction or tariff escalation between the two countries therefore has a two-way transmission — it can affect a Nebraska corn farmer’s export demand at the same time it affects a Mexican grower’s access to the US market. That interdependency is a real link between the two situations, even though the on-the-ground challenges in each country’s countryside are quite different in kind.
Monitoring Tools for Farmers Under Financial Pressure
When margins are as tight as the Nebraska crop-receipts data above suggests, the return on catching a problem early — a moisture deficit, a fertility gap, a pest outbreak — goes up, because there’s less buffer to absorb a preventable yield loss. Farmonaut’s satellite-based platform tracks vegetation health, soil moisture, and weather conditions across a farm’s fields, and its Jeevn AI advisory layer turns that raw satellite data into a specific action recommendation rather than just a map.
- Field-level vegetation health tracking to catch stress before it’s visible on the ground
- Soil moisture data to time irrigation more precisely, relevant directly to the drought pressures described above
- Weather forecasting integrated with crop condition data for planting and harvest timing decisions
- A carbon footprinting feature for operations documenting conservation practices, which increasingly intersects with subsidy and conservation program eligibility

None of this substitutes for the structured decision-making process a farm needs around crop selection, marketing, and debt management in a compressed-margin environment — but it does put better information into that process, which matters more, not less, when the cost of a wrong call is higher.

Calculator: Crop Receipts Decline Impact
Use the Nebraska-documented 30% crop-receipts decline as a starting benchmark, then substitute your own farm’s numbers to see the dollar impact on your operation.
Run your own numbers
Assumptions and exclusions: this tool applies a flat percentage decline to a single peak-year revenue figure you supply and compares it against fixed costs you enter — it does not model crop mix, yield variation, livestock income, government payments, or year-to-year price volatility, and the 30% default reflects Nebraska's statewide crop-receipts decline since 2022 as reported in the Fall 2025 RaFF report, not any individual farm's actual figures. Replace every input with your own operation's numbers before drawing conclusions.
Comparative Snapshot: Nebraska Agriculture Pressures
| Pressure | Documented Figure | Verification / Refresh Path |
|---|---|---|
| Statewide net farm income | $8.42B projected 2025, up $2.48B from 2024 | RaFF Nebraska Farm Income Outlook, updated twice yearly |
| Crop receipts vs. 2022 peak | Down ~30% | Same RaFF report |
| National farm bankruptcies (Chapter 12) | 216 filings in 2024, up 55% from 2023 | US Courts annual bankruptcy statistics by district |
| US total farm debt | $561.8B projected 2024 | USDA farm balance sheet, updated annually |
| Soybean acreage shift (tariff-linked) | Down 3.1 million acres in 2025 plantings | USDA NASS Prospective Plantings / Acreage reports |
| US soybean exports to China | 218 million bushels, 2025 to date | USDA Foreign Agricultural Service trade data |
| Federal direct payments to farmers | $40.5B projected 2025 | USDA ERS farm income forecast, revised 3x yearly |
Further reading:
FAQ
Q: Are Nebraska farmers going broke?
A: Not as a statewide average — the University of Missouri's Fall 2025 RaFF report projects Nebraska net farm income at $8.42 billion for 2025, up $2.48 billion from 2024. The real stress is concentrated in row-crop operations, where crop receipts have fallen about 30% since the 2022 price peak, squeezing margins for farms carrying debt or rent set at that peak.
Q: What is the impact of tariffs on American farmers?
A: The clearest documented effect is a shift away from soybean acreage — US farmers cut soybean plantings by 3.1 million acres for 2025 as trade uncertainty with China weighed on soybean demand, per Farm Policy News' analysis of USDA data. US soybean exports to China stood at 218 million bushels for 2025 to date. Federal programs offset some of this: USDA projected $40.5 billion in direct government payments to farmers for 2025.
Q: Are Nebraska farms in trouble specifically, versus the national picture?
A: Nebraska's projected income increase for 2025 runs counter to a blanket "in trouble" framing, but national data — 216 Chapter 12 farm bankruptcy filings in 2024, up 55% from 2023, and $561.8 billion in total US farm debt — shows real financial strain concentrated in specific segments nationally. A Nebraska-specific bankruptcy count requires checking US Courts' District of Nebraska filings directly.
Q: What challenges do farmers face in Mexico's countryside, and how does that connect to Nebraska?
A: Mexican smallholder agriculture faces fragmented land tenure, limited credit access, and water scarcity — challenges distinct in kind from Nebraska's margin-compression story, and current Mexican-government figures on these were outside this article's research scope (check SADER and INEGI directly). The two are linked commercially: Mexico is a major destination for US corn exports and a major US supplier of produce, so trade friction between the countries affects both sides.
Q: How can Nebraska farmers track their own numbers against the trends in this article?
A: Use the crop-receipts calculator above with your own peak-year revenue and current fixed costs. For updated statewide figures, check the RaFF Nebraska Farm Income Outlook (published twice yearly) and USDA ERS's farm income forecast (revised three times yearly) directly rather than relying on any single article's snapshot.
Earn With Farmonaut: Affiliate Program
Earn 20% recurring commission with Farmonaut's affiliate program by sharing your promo code and helping farmers save 10%. Onboard 10 Elite farmers monthly to earn a minimum of $148,000 annually—start now and grow your income!
For more information on how Farmonaut can help you navigate the financial and agronomic pressures facing Nebraska agriculture, visit our website or download our mobile app:



For developers interested in integrating Farmonaut's agricultural and weather data into their own applications, check out our API and API Developer Docs.

 Godrej Agrovet
 Hayleys Agriculture
 Linx Agritech
 Adinet
 Save Your Soils
 GalaxEye Space
 Grandstream Algérie
 XOS Realty
 Geospatial Lab Africa
 Agro La Gándara
 HIPSAC
 ZOL Zimbabwe
 Juligerm
 AdBio
AdBio MISE Maroc
 NWNS
NWNS Red August Group
 Farm Inc
 WeMe Global
 Agrotoken
 Blue BearX
 Insignito
 DnCubed
 Indosistim Teknologi
 Liquify Digital
 CU Foods
 BeyondTech Global
 Rouge VC
 AgroRisk
 Oath Inc
 Esri North East Africa
 MDCV UK
 Etech Consulting Madagascar
 Vestlandsforsking
 WB Dev
 Sama Premium
 Tres Valles
 Blickwinkel
 Agricultural Credit Policy Council
 eKGIS
eKGIS Mostas Tech
 Andex
Andex Deluxe Conseil
 WICO
WICO Chimera Innovation
 SkyHarvest
 Teledarbas
 Exurbia Geospatial
 FieldZero
