

Lithium · Impact guide
Pros and Cons of Lithium Mining: Data and Calculators
Batteries take 88% of lithium (USGS, 2026) and EU battery cars emit 73% less over their life (ICCT, 2025). The costs are water, carbon, waste and permits, with figures from published studies.
Key takeaways
- Batteries took 88% of global lithium use, and world mine output outside the US reached about 290,000 tonnes of contained lithium in 2025 (USGS, 2026).
- An EU battery electric car emits about 73% less over its life than a gasoline car, and its extra production emissions are paid back after about 17,000 km (ICCT, 2025).
- At two Argentine salt-flat mines in 2021, freshwater use was 51.0 and 135.5 cubic metres per tonne of lithium carbonate; the direct extraction plant used less brine but more freshwater (Heliyon, 2025).
- Greenbushes hard-rock output in 2022 carried 323 kg CO2e, 9.3 tonnes of waste rock and 3.1 tonnes of tailings per tonne of concentrate (University of Melbourne study).
- The USGS annual average carbonate price fell from US$63,700 per tonne in 2022 to US$9,000 in 2025, and Benchmark assessed spot carbonate (CIF Asia) at US$19,750 on 2 September 2026, a different basis from the USGS annual average.
In this article
- Lithium mining pros and cons at a glance
- How lithium is mined: brine, hard rock and clay
- The pros of lithium mining
- The cons of lithium mining: water
- The cons of lithium mining: carbon, waste rock and tailings
- Land, communities and permits
- Prices: why the economics swing
- What reduces the cons: DLE, recycling and monitoring
- What to check before backing or permitting a lithium project
- Frequently asked questions
Lithium mining has clear gains and clear costs. Batteries take about 88% of global lithium use (USGS, 2026), and a battery electric car in the European Union emits about 73% less over its life than a gasoline car (ICCT, 2025). The costs are local: water drawn from dry basins, carbon and waste from processing, and land and community disputes. This page puts the numbers from published studies side by side, with the year and the place they apply to, so you can see which pros and cons hold in your case.
It is written for consultants and project owners who need to weigh a lithium project, not for readers who want a slogan. Where a figure comes from one mine, the text says so. Two calculators let you scale the published per-tonne figures to a project of your own size.
Lithium mining pros and cons at a glance
The table lists the main effects, who feels them, and what the evidence shows. Each row is explained with sources in the sections below.
| Effect | Pro | Con | What the evidence shows |
|---|---|---|---|
| Clean energy supply | Batteries use 88% of lithium | Demand pulls new mines into new places | USGS, 2026 |
| Vehicle emissions | EU battery cars emit 73% less over their life | Battery production emits about 40% more than for a petrol car | ICCT, 2025 (EU average) |
| Water | Thacker Pass (clay) is designed to recycle about 85% of its process water | Brine projects pump large volumes in desert basins | Two Argentine mines, 2021 data |
| Land and waste | Pits can be shallow, with filtered tailings | Hard-rock mining moves several tonnes of waste per tonne of concentrate | Greenbushes life-cycle study, 2022 data |
| Jobs and revenue | Large construction and operating payrolls | Prices swing and projects slip | Company fact sheet; CalMatters, 2026 |
| Communities | Local hiring and tax payments | Water and consultation disputes | Heliyon study; court review in California |
How lithium is mined: brine, hard rock and clay
Three ore types matter. In a brine project, pumps bring salty groundwater from under a salt flat into shallow ponds, where the sun evaporates the water over many months until the lithium is concentrated enough to process. In a hard-rock project, a pit or underground mine produces an ore such as spodumene, a lithium-aluminium silicate; the rock is crushed and floated into a concentrate that is sold to chemical plants. Clay deposits, such as the one at Thacker Pass in Nevada, are mined in open pits and treated with acid. A newer family of methods, direct lithium extraction (DLE), pulls lithium out of brine with sorbents or solvents instead of ponds. For a longer guide to the ore types, see our page on lithium deposits: pegmatite, brine and clay.
Chart
Lithium mine production, selected countries
Tonnes of contained lithium, 2025 estimate
The industry’s size explains why the debate is loud. World mine output outside the United States (whose output USGS withholds) was an estimated 290,000 tonnes of contained lithium in 2025, up 31% from 222,000 tonnes in 2024, and the USGS puts world reserves at 37 million tonnes. Production is concentrated in a few countries, as the chart shows.
Australia’s output is almost all hard rock, mostly from Western Australia; our guide to lithium in Australia covers those deposits. Chile and Argentina produce from brine, and Zimbabwe, Brazil, Mali and Canada from hard rock.
The pros of lithium mining
It supplies the battery industry
The USGS estimates that batteries took 88% of global lithium use, against 4% for ceramics and glass and 2% for greases. Global consumption was about 263,000 tonnes of contained lithium in 2025, up 20% from 2024, driven by electric vehicle (EV) sales in China and Europe and by grid storage. The USGS notes that substitutes exist for lithium compounds in batteries, ceramics, greases and glass, but battery demand is the large and growing part.
The cars it enables emit less over their life
The International Council on Clean Transportation (ICCT) estimates that a medium-size battery electric car sold in the EU emits 63 grams of CO2-equivalent per kilometre over its life, against 235 grams for a gasoline car, a cut of 73%. That counts battery production, fuel and electricity supply, use and recycling. The same report finds that battery cars carry about 40% higher production emissions, which are paid back after roughly 17,000 km of driving. The result depends on the electricity grid, so a figure for the EU average does not transfer to a coal-heavy grid.
It creates jobs and tax revenue, but the numbers are projections
The best-documented example is Thacker Pass in Nevada. Its owner, Lithium Americas, says the project will employ 2,000 people in construction and 1,100 full-time staff for the life of the mine, and will pay an estimated US$23.4 billion in taxes over an 85-year life of mine covering all five planned phases (company fact sheet, February 2025). These are the company’s own projections. Phase 1 is still under construction, with mechanical completion targeted for late 2027 (Lithium Americas, Q2 2026 results).
Existing operations show a smaller picture. The USGS reports US lithium mine and mill employment of 70 people in each year from 2021 to 2025, because the only commercial-scale producer is a single brine operation in Nevada. Lithium jobs are real, but a mine is capital-heavy and employs few people per tonne compared with its construction phase.
It can come with better engineering
Newer designs aim to cut waste. The Thacker Pass plan, for example, uses a shallow pit (under 400 feet), filtered clay tailings and a closed-loop water circuit that the company says recycles about 85% of process water, based on its 2022 feasibility study. Treat these as design targets: the plant is not yet operating. The University of Melbourne study of the Greenbushes hard-rock mine in Western Australia, by contrast, rests on measured 2022 operating data, covered below.
The cons of lithium mining: water
Water is the most argued point, and the numbers are easy to misquote. A figure often repeated online, 500,000 gallons per tonne of lithium, is not supported by the measured studies cited on this page, so we do not use it. The best open dataset comes from a 2025 study in the journal Heliyon, which used the environmental impact reports of two Argentine salt-flat projects: Olaroz, which uses evaporation ponds, and Fénix, which uses a form of DLE.
Chart
Water per tonne of lithium carbonate, two Argentine mines
Cubic metres per tonne, 2021 data from environmental impact reports
The authors separate two things. Freshwater footprint is the water consumed from surface and groundwater (the study’s blue footprint) plus a small allowance for water needed to dilute pollutants (the gray footprint; 4.3 of Olaroz’s 51.0 cubic metres per tonne). Brine consumption is brine pumped from the salt flat and lost to evaporation. Per tonne of battery-grade lithium carbonate, the 2021 results were:
- Olaroz (ponds): 51.0 cubic metres of freshwater and 537.4 cubic metres of brine.
- Fénix (DLE): 135.5 cubic metres of freshwater and 319.6 cubic metres of brine.
The finding runs against a common claim. DLE cut brine consumption but not freshwater use: per tonne of product, Fénix used 2.7 times more freshwater than Olaroz. The authors add that Fénix sits in a basin with more available water, so its freshwater use was about 10% of the available blue water in the basin, against about 30% at Olaroz. They state that the findings are not conclusive and call for longer studies. Any claim that DLE “cuts water use by 80%” needs a project-specific source.
The study also puts the draw in human terms. The freshwater used at Olaroz in 2021 equalled about 8 times the yearly water use of the Susques department’s 3,980 residents; Fénix’s was about 70 times that of the 2,022 residents of Antofagasta de la Sierra. Both places are very small, which is why the comparison sounds large, and the authors add that local worry is as much about uncertainty over future water as about volume.
Ground sinking at the Salar de Atacama
Brine pumping can also change the ground. A University of Chile team used radar satellites over 2020 to 2023 and found that part of the Atacama salt flat in Chile is sinking by 1 to 2 centimetres a year, over an area of roughly 8 by 5 kilometres where miners operate (Reuters report of a study in IEEE Transactions on Geoscience and Remote Sensing, August 2024). The lead author said it was not the whole salt flat. The suggested cause is pumping faster than the aquifers refill. The data came from Argentina’s SAOCOM-1 radar satellites, and the study covers a period of only three years, so longer independent monitoring is useful.
What this means for a hard-rock mine
Hard-rock mines use water too. The Greenbushes life-cycle study reports a water-consumption impact of 3.88 cubic metres-equivalent per tonne of spodumene concentrate, but it uses a different method from the Argentine study, so the two figures cannot be compared directly. Water risk in hard rock also comes from pit dewatering and tailings storage, which is site-specific. Hard-rock projects also need heavy equipment; see our overview of hard-rock mining equipment and drilling.
Calculator
How much water does a brine project use per year?
Enter your project’s output and per-tonne water figures. Results update as you type.
- Brine consumed per year: 5,374,000 m3
- Freshwater per day: 1,397 m3
- Share of basin freshwater: 30.0 %
Example values only, not benchmarks. Defaults are the Olaroz figures (Heliyon, 2025, 2021 data); replace them with your project’s own. The basin default of 1,700,000 m3/year is set so the default output reproduces the roughly 30% of available blue water that the study reports for Olaroz (Fenix about 10%); it is not a measured basin figure, so replace it with your own.
The cons of lithium mining: carbon, waste rock and tailings
The carbon cost of lithium depends on the ore and on the product. The International Institute for Sustainable Development (IISD) reproduces International Energy Agency (2021) and Gielen and Lyons (2022) figures for greenhouse gas emissions per tonne of lithium carbonate equivalent (LCE): lithium carbonate from brine at 2.8 tonnes of CO2e, from hard rock at 9.6, lithium hydroxide from brine at 5.68 and from hard rock at 17.05. Hydroxide from hard rock is the highest of the four routes.
Chart
Greenhouse gas emissions per tonne of lithium carbonate equivalent
Tonnes CO2e per tonne LCE, by product and ore
Mining itself is a smaller part. The Greenbushes life-cycle study measured, for the mine and concentrator in 2022, 323 kilograms of CO2e per tonne of spodumene concentrate. Electricity was the largest source at 39%, followed by steel grinding balls at 25% and diesel at 14%; the mined ore itself accounted for 13%. The same inventory records about 9.3 tonnes of waste rock and 3.1 tonnes of tailings for each tonne of concentrate. Waste rock is rock moved to reach the ore; tailings are the fine, crushed leftovers after the lithium mineral is taken out, usually stored in a dam or as a dry stack. Neither is harmful in every case, but tailings chemistry varies by site and both take land and need long-term management. A leaking tailings dam or a poorly sited waste dump is a risk to soil and streams; for the soil side of that, see our guide to soil pollution and its remedies.
The Greenbushes figures are from one mine, one year and one ore. A different grade or a different power source will change them, so they are a reference point, not an industry average.
Calculator
How much waste does a hard-rock mine make?
Enter your concentrate output, ratios and price.
- Tailings per year: 308,000 tonnes
- CO2e per year: 32,300 tonnes
- Concentrate sales per year: $200,000,000
- Waste rock plus tailings per US$1,000 of sales: 6.20 tonnes
Example values only, not benchmarks. Defaults are the Greenbushes 2022 life-cycle figures per tonne of spodumene concentrate (University of Melbourne study); your mine will differ. The price is an input: use today’s price.
Land, communities and permits
Social disputes are a cost that rarely appears in a feasibility study. In California’s Imperial County, the plan to produce lithium from geothermal brine at the Salton Sea was once promoted as a major economic opportunity. CalMatters reported in September 2026 that an appeals court had sent the Hell’s Kitchen environmental review back to the county to fix gaps on water and air quality, that two other projects were still in development and that none was near full operation. Local workers were still waiting for jobs.
The lesson for any project is that permits can fail on process as well as on substance. A thin environmental report invites a lawsuit, and a lawsuit adds years. In the Argentine study, the authors note that company and government reports often give water data without enough context, which leaves communities guessing.
For projects on or near farmland, check land use and water rights early, but do it on the facts of the site. This page does not claim that lithium mining harms crops in general; the evidence we found concerns water in dry basins and land used by the mine itself.

▶ The seven environmental impacts of mining, explained in clay with satellite maps. · 2:31
Prices: why the economics swing
A lithium project is exposed to a volatile price. The USGS annual average price of battery-grade lithium carbonate went from US$11,700 per tonne in 2021 to US$63,700 in 2022, then fell to US$9,000 in 2025. That is a drop of more than 85% from the peak, and the swing shows in project finance: planned mines slow down when prices fall.
Chart
Annual average battery-grade lithium carbonate price
US$ per tonne, real terms
Prices recovered in 2026. S&P Global data cited by Investing News Network put battery-grade carbonate in China at a two-year high of US$30,032 per tonne on 12 May 2026; by the end of the third quarter, Benchmark data showed US$19,025 per tonne (ex-works China), down 20.8% on the quarter. Benchmark assessed carbonate delivered to Asia at US$19,750 per tonne on 2 September 2026. These are dated snapshots; check a live source for today’s price.
What reduces the cons: DLE, recycling and monitoring
Three developments are changing the balance. First, DLE is moving from pilot to plant. Eramet reported that its Centenario plant in Argentina reached 90% of nameplate capacity in June 2026, with 2026 output guided to 17,000 to 20,000 tonnes of carbonate equivalent. IISD still describes DLE as at an early stage of commercial deployment, and the Argentine data above shows why freshwater use needs checking project by project.
Second, recycling. The IISD profile puts secondary supply, mostly recycling in China, at about 3.5% of global lithium production in 2024, and the USGS notes that recycling plants kept being built through 2025. That share is small, so recycling reduces demand for new mines only slowly.
Third, monitoring from space. Satellites can show pond area growth, vegetation change, surface sinking from radar and disturbed ground around a mine, which gives consultants an independent record to set against a company’s reports. Farmonaut maps licence areas from satellite data; it shows surface change and does not replace a groundwater study or an environmental impact assessment.

▶ How satellites are used to look for lithium in Nigeria, from a Farmonaut case-study video. · 10:49
What to check before backing or permitting a lithium project
Use this list when reading a feasibility study or an environmental report.
- Ore and route. Brine, hard rock or clay? Carbon, water and waste differ greatly between them, as the figures above show.
- Water in both forms. Does the report give freshwater and brine separately, per tonne of product, and the basin’s available supply?
- Waste ratios. Tonnes of waste rock and tailings per tonne of concentrate, and where they will be stored.
- Processing location. Where is carbonate or hydroxide made, and on what power? That sets much of the carbon figure.
- Baseline data. Does the report give groundwater levels, ground movement and vegetation records from before mining, so change can be measured later?
- Consultation record. Who was consulted, when, and what was changed as a result?
- Price case. Does the project still work at the low prices of recent years?
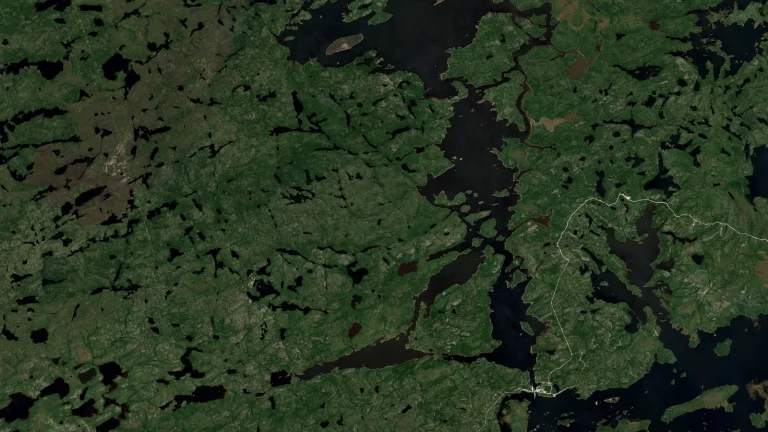
Our page on the James Bay spodumene pegmatites gives a hard-rock example, and the James Bay Sentinel-2 outcrop survey shows what satellite images can and cannot say about a pegmatite district.
For a closer look at a related question, see our guide: AI in Mineral Crushing and Grinding: Pros and Cons.
If this topic matters to you, read Contract Mining vs Owner Mining for Gold: Costs and Risks next.
Frequently asked questions
What are the main pros and cons of lithium mining?
The main pro is supply for batteries, which take 88% of lithium use (USGS, 2026), and the lower life-cycle emissions of the cars they power. The main cons are water use in dry basins, carbon and waste from processing, and disputes over land and permits. See the table at the top for the evidence on each.
How bad is lithium mining for the environment?
It depends on the ore and the site. Per tonne of carbonate equivalent, IEA (2021) and Gielen and Lyons (2022) figures reproduced by IISD range from 2.8 tonnes of CO2e for carbonate from brine to 17.05 for hydroxide from hard rock. Brine projects add water and ground-movement questions, while hard-rock projects add waste rock and tailings.
How much water does lithium mining use?
At two Argentine salt-flat projects in 2021, freshwater use was 51.0 and 135.5 cubic metres per tonne of lithium carbonate, with brine consumption of 537.4 and 319.6 cubic metres (Heliyon, 2025). Other sites will differ.
Is lithium mining worse than gold or copper mining?
This page does not compare metals, because a fair comparison needs the same basis, such as water per unit of metal and the local water supply. The Heliyon authors note that companies and officials argue lithium uses less water than farming or gold and copper mining, and they say the claim needs context at basin level.
Does direct lithium extraction fix the water problem?
Not by itself. In the Argentine comparison, the DLE plant used less brine per tonne but more freshwater than the pond plant. DLE is also at an early stage of commercial use, per IISD. Ask any project for measured freshwater use per tonne.
How many jobs does a lithium mine create?
Projected numbers can be large for construction, such as 2,000 jobs at Thacker Pass, and smaller for operations, with 1,100 full-time staff planned there (company fact sheet, 2025). The only operating US lithium mine and mill reported 70 employees in USGS tables for 2021 to 2025.
Which countries mine the most lithium?
By contained lithium in 2025, the USGS estimates Australia at 92,000 tonnes, China 62,000, Chile 56,000, Zimbabwe 28,000 and Argentina 23,000. US production is withheld to protect company data.
Why is the lithium price so volatile?
Supply additions and demand growth do not move together. The USGS annual average carbonate price was US$63,700 per tonne in 2022 and US$9,000 in 2025, and Investing News Network reported a two-year high in May 2026 followed by a fall of 20.8% in the third quarter.
Can lithium be recycled instead of mined?
Partly. Recycling was about 3.5% of global lithium production in 2024 (IISD), and new recycling plants were being built in 2025 (USGS). It will take years of scrap build-up before recycling replaces a large share of mining.
Can satellites monitor the effects of lithium mining?
They can track surface change: pond growth, cleared land, vegetation and, with radar, ground movement such as the 1 to 2 centimetres a year reported at Atacama. They cannot measure groundwater volume directly, so they supplement field monitoring rather than replace it.
This page is for information only. It is not investment advice. Confirm project figures against company filings and regulator documents.
Farmonaut mining
Map your mining site from space
Check surface change around a licence area with satellite imagery.

Mining Pro sample view, synthetic data
Keep reading
Sources
- USGS, Mineral Commodity Summaries 2026: Lithium: pubs.usgs.gov
- Díaz Paz et al., The water footprint of lithium extraction technologies, Heliyon (2025): pmc.ncbi.nlm.nih.gov
- IISD, Commodity Profile: Lithium (2026): iisd.org
- Khakmardan et al., Life cycle inventory of spodumene concentrate production, Greenbushes, Journal of Cleaner Production 496 (2025), 145123 (University of Melbourne repository): minerva-access.unimelb.edu.au
- ICCT, Life-cycle greenhouse gas emissions from passenger cars in the EU: 2025 update: theicct.org
- Reuters via Kitco, Lithium mining is slowly sinking Chile’s Atacama salt flat (22 August 2024): kitco.com
- CalMatters, Is California’s lithium valley dream fading? (September 2026): calmatters.org
- Investing News Network, Lithium Market Trends: Q3 2026 Review and Forecast (14 October 2026): investingnews.com
- Benchmark Mineral Intelligence, Lithium prices (assessment of 2 September 2026): benchmarkminerals.com
- Lithium Americas, Thacker Pass Overview (February 2025): s203.q4cdn.com
- Eramet, H1 2026 results (29 July 2026): eramet.com
Discussion
Questions, corrections or field experience? Share them below. First-time comments are reviewed before they appear, and your email is never published.
No comments yet. Be the first to add a question or your experience.

 SG Gold Mining LLC
 VRV Global Pte Ltd
 Omsri International FZE
 G.I.T.T.
 Jaunita Erss Ltd
 Almosi SARL
 SRK Consulting
 Berks Gold Limited
 Mwerezi Minerals Company Limited
 Mining SARL
 SenGold Invest SAS
 Sean Mining Limited
 NTS Group (Pty) Ltd
 Mine4Africa
 Lithspo Minerals Limited
 Tintina Mining Group

 Licence holder · Nigeria · Gold + lithium










