

Reviewed September 2026 against USDA NASS Trout Production reports and the Agricultural Marketing Resource Center (Iowa State University).
Try it: Satellite monitoring ROI: what it returns on your acreage →
Trout Farming: Costs, Setup Steps & Real USDA Numbers
Commercial trout farming in the United States is a $134.1 million business built on just 335 farms, according to the USDA’s 2023 Agricultural Census — a small, concentrated industry, not a mass commodity market. Food-size trout (12 inches and up) sold for an average farm price of $2.40 per pound in 2025, with 25.3 million fish sold nationally, per USDA NASS’s February 2026 Trout Production report. This guide covers what those numbers mean for anyone planning a trout farm — indoor, outdoor, DIY, or aquaponic — plus how to look up next year’s figures yourself.
Table of Contents
- How Big Is US Trout Farming, Really?
- Why Trout Aquaculture Beats Other Species for Inland Farms
- How to Make a Fish Farm: Site, System, Stock, Feed
- Indoor Trout Farming and Recirculating Systems
- DIY Trout Farms and Hydroponic-With-Fish Systems (Aquaponics)
- Stocking Cost Calculator
- Trout Farm Systems Compared
- Prices, Losses, and Where the Money Goes
- Challenges Every Trout Farm Faces
- Monitoring a Trout Farm With Satellite Data
- Frequently Asked Questions
- Getting Started
- Try it: Satellite monitoring ROI: what it returns on your acreage
How Big Is US Trout Farming, Really?
US trout aquaculture generated $134.1 million in total sales in 2023 — food-size fish, eggs, fry, fingerlings, and broodstock combined — spread across 335 rearing farms nationwide, according to the USDA’s Agricultural Census as compiled by the Agricultural Marketing Resource Center at Iowa State University. Idaho is the clear leader, producing $41.45 million of that total in 2023 alone, roughly 31% of the entire US trout economy, thanks to the Snake River aquifer’s steady cold-water flow through the Magic Valley region.
That concentration matters for anyone asking “how to make a fish farm” as a new entrant: this is not a fragmented commodity market where a small producer disappears into the noise. With 335 total farms, a new indoor or outdoor trout operation is a visible, competable business, not a rounding error.
On production volume: USDA NASS’s most recent Trout Production report (covering 2025, published February 2026) counted 25.3 million food-size fish (12 inches or longer) sold, up from 22.7 million in 2024. Medium trout (6–12 inches) sales were smaller in count — 3.51 million fish in 2024 — but commanded a much higher per-pound price, which the pricing section below breaks down.

Why Trout Aquaculture Beats Other Species for Inland Farms
Rainbow trout aquaculture works almost anywhere with a reliable supply of cold, well-oxygenated water — springs, boreholes, or regulated streams in the 50–61°F (10–16°C) range. That is the core advantage over marine species: no coastline required, no saltwater intake infrastructure, no reliance on a single climate zone.
- Freshwater flexibility: earthen ponds, concrete raceways, or fully recirculating tanks all work for rainbow trout.
- Established buyer channel: 67.9% of large food-size trout sold in 2024 went to processors rather than live/direct markets, per USDA NASS — meaning a wholesale off-take path already exists in most trout-producing states.
- Documented yields: intensively fed outdoor pond systems commonly produce 1,000–2,000 pounds of fish per acre, per USDA and academic aquaculture guidance compiled by AGMRC.
- Regional concentration: Idaho, North Carolina, and a handful of other states account for the bulk of US production, so state extension offices and processors in those regions already have trout-specific expertise.
The tradeoff against a commercial trout production model built around marine species like tuna is scale versus footprint: trout farms are inland, freshwater, and modest in acreage; tuna farming requires ocean net-pens or large saltwater tank systems and sits outside the scope of what a US inland operator can realistically permit and build.
What “Commercial Trout Production” Actually Requires
A commercial trout production operation — as distinct from a hobby DIY tank — means consistent water chemistry, certified fingerling sourcing, and a sales channel lined up before the first fish are stocked. USDA’s per-farm sales data implies most of the 335 US trout farms are running well above hobbyist scale; the $134.1 million in 2023 sales divided across 335 farms averages exactly to real commercial throughput, not backyard production.

How to Make a Fish Farm: Site, System, Stock, Feed
Building a trout farm — whether a small trout fishing farm for a pay-to-fish pond or a full commercial trout production site — follows the same sequence of decisions. Here is the order that matters:
-
Site Selection:
- Water temperature in the 50–61°F range year-round, or the ability to condition it mechanically indoors.
- A legal water right or permitted well/spring source — state fish and game or water resource agencies handle this, and requirements differ by state.
- Proximity to a processor or direct-market buyer, since 67.9% of large food-size trout moved through processors in 2024.
-
System Design:
- Earthen ponds and concrete raceways suit outdoor sites with strong natural flow.
- Recirculating aquaculture systems (RAS) suit indoor trout farming where land or water rights are limited — see the dedicated section below.
- A DIY fish farm can start with IBC totes or livestock tanks plus a pump, biofilter, and aerator.
-
Stocking:
- Source fingerlings from a certified hatchery to limit disease introduction.
- USDA’s fry/fingerling/egg sales category totaled roughly $1.8 million nationally in 2023 (within the $134.1 million total), but per-unit fingerling pricing is not broken out in public USDA data — get a quote directly from a state-licensed hatchery for current cost per thousand.
-
Feed & Nutrition:
- Feed conversion ratio (FCR) for commercial rainbow trout is commonly cited in academic literature as 1.0–1.5 pounds of feed per pound of gain, but there is no single standardized US farm benchmark published by USDA — treat any FCR figure you see as a starting estimate to validate against your own feed records.
-
Water Quality Management:
- Continuous monitoring of dissolved oxygen, temperature, pH, and ammonia is standard at every scale above a backyard tank.
-
Loss Management:
- USDA NASS recorded 10.3 million total fish lost in 2024 to disease, predation, low oxygen, and other causes combined — a reminder that loss planning belongs in the budget from day one, not as an afterthought.
-
Harvest and Sales:
- Plan harvest timing against buyer demand — processor contracts, a farm store, or a trout fishing farm pay-to-catch model.
- Use traceability tools such as Farmonaut’s blockchain-based product traceability platform to document origin for buyers who ask.
Satellite monitoring ROI: what it returns on your acreage
Change any figure. Nothing is pre-assumed about your farm.
Your inputs only — this tool contains no benchmark yield or price data. Use your own last-season figures, and treat any vendor’s yield-gain percentage as unproven until they show you two contrasting seasons.

Indoor Trout Farming and Recirculating Systems
Indoor trout farming solves the two biggest constraints on outdoor sites: land and year-round water temperature control. A recirculating aquaculture system (RAS) filters and reoxygenates water in a closed loop, so an indoor trout farm can hold stable 50–61°F water regardless of outside climate — relevant for anyone outside the traditional cold-spring belt of Idaho or the Appalachians.
On yield: theoretical high-density RAS designs are sometimes cited at 40,000-plus pounds per acre-equivalent of tank footprint, but this figure comes from general engineering references, not a USDA commercial farm survey — there is no published US industry-wide RAS adoption rate or verified per-farm RAS yield dataset. Treat any RAS yield number you see (including that one) as a design target to validate with your own equipment supplier, not an industry average.
What IS documented: outdoor intensively-fed pond systems producing 1,000–2,000 pounds per acre, per USDA/academic guidance via AGMRC. An indoor RAS system’s realistic yield sits above that outdoor pond range because of stacked tank density and controlled flow, but exactly how far above it depends on tank depth, oxygenation equipment, and stocking density — figures your equipment vendor should quote against your specific tank design.
- Capital costs — pond/tank construction, biofiltration, aeration, and backup power — are not published by USDA; industry associations and equipment vendors hold this data. Request itemized quotes from at least two RAS equipment suppliers before committing to a design.
- Stocking density in fish per gallon or fish per cubic meter for commercial systems is documented in academic extension publications but not standardized in official USDA reporting — check your state’s aquaculture extension program (many land-grant universities publish trout-specific guides) for a density recommendation matched to your tank depth and flow rate.

DIY Trout Farms and Hydroponic-With-Fish Systems (Aquaponics)
A DIY fish farm scales the same principles down to IBC totes, stock tanks, or backyard ponds with basic filtration and aeration. It is the natural entry point for anyone testing “hydroponic with fish” — the aquaponics model — before committing capital to a commercial build.
- IBC totes or prefabricated tanks with a mechanical filter, biofilter, and air stone cover the minimum build.
- Combine with a grow bed for aquaponics: fish waste water feeds plants, plant roots strip nutrients, and cleaned water returns to the tank.
- Useful for personal supply, education, or as a proof-of-concept before a commercial trout production build.
Aquaponics — the formal term for hydroponic-with-fish systems — pairs a trout (or tilapia, in warmer setups) tank with a hydroponic plant bed in a closed nutrient loop. It reduces synthetic fertilizer use for the plant side and cuts total water turnover versus a fish-only pond, since the same water cycles between tank and grow bed rather than being discharged. For the crop-management side of a combined operation, sustainable growing practices that apply to any hydroponic bed apply here too — nutrient balance, root zone monitoring, and light scheduling all carry over from soil-based hydroponics.

Trout Farm Systems Compared
| System | Typical Setup | Documented Yield | Water Reuse | Best Fit |
|---|---|---|---|---|
| Outdoor pond/raceway | Earthen pond or concrete raceway, flow-through | 1,000–2,000 lb/acre (intensively fed) | Low — flow-through | Sites with strong natural cold-water flow |
| Indoor RAS | Tanks + biofilter + mechanical filtration | Not USDA-surveyed; vendor design-dependent | High — closed loop | Land-limited or off-climate-belt sites |
| DIY tank/tote | IBC tote or stock tank + aerator | Not commercially benchmarked | Medium — partial recirculation | Home supply, education, proof-of-concept |
| Aquaponics (hydroponic + fish) | Fish tank + hydroponic grow bed | Not commercially benchmarked | High — closed nutrient loop | Combined fish + vegetable production |
Sources: Yield figures for outdoor ponds are from USDA/academic aquaculture guidelines as compiled by AGMRC (Iowa State University). RAS, DIY, and aquaponic yields are not covered by a USDA commercial farm survey as of this review — do not treat vendor marketing figures for these as verified industry averages.
Monitoring Water and Land Resources
Whichever system you choose, tracking water source health and surrounding land use over time supports both compliance and long-term planning. Tools like Carbon Footprinting help operators quantify and report on resource use trends across a farm site.
Prices, Losses, and Where the Money Goes
USDA NASS publishes trout prices and volumes annually every February, covering the prior year. The two most recent releases show a clear price and volume shift:
Medium trout (6–12 inches) tell a different story — much smaller volume but a far higher unit price, since these fish typically go to stocking programs (private ponds, put-and-take fisheries) rather than food processors:
The gap between food-size and medium trout pricing is the clearest business signal in the entire dataset: medium trout sold for $6.27 per pound in 2025 versus $2.40 for food-size fish — more than double, because medium trout serve a stocking market willing to pay for live delivery rather than a processed-food market paying by the pound of meat. A new trout fishing farm or trout lake operation selling live medium fish for stocking is playing in a materially higher-margin lane than a food-size processor supplier.
On losses: USDA NASS recorded 10.3 million total fish lost nationally in 2024 across disease, predation, low dissolved oxygen, and other causes. That is a real, USDA-counted number worth budgeting against — if your farm’s loss rate runs well above what the national aggregate implies for your scale, water quality management is the first place to check.
For current-quarter figures beyond what is cited here, USDA NASS Quick Stats (quickstats.nass.usda.gov) lets you filter live “Trout” commodity data by state, and a new national release comes out every February covering the prior year. The USDA Agricultural Marketing Service also publishes weekly aquaculture prices, though trout-specific updates typically lag behind catfish and salmon reporting. Idaho Trout Producers Association and Washington-state trout associations publish quarterly newsletters with regional price signals for producers who want a more localized read than the national NASS average.

Challenges Every Trout Farm Faces
The 10.3 million fish lost in 2024 to disease, predation, and oxygen depletion is the single clearest data point on why biosecurity and water monitoring are not optional line items:
- Disease and biosecurity: certified hatchery sourcing and quarantine protocols are standard risk controls; a single outbreak can wipe out a season’s stocking investment.
- Water temperature stability: trout tolerate a narrow 50–61°F band; sites without natural spring flow need mechanical cooling or heating, which raises both indoor trout farming capital and energy costs.
- Regulatory variation: water rights, discharge permits, and aquaculture licensing requirements differ by state, and there is no single consolidated USDA reference covering fees and timelines — check your state department of agriculture or fish and wildlife agency directly before site selection.
- Capital and equipment costs: pond construction, aeration, and RAS filtration costs are not USDA-published; get direct vendor quotes rather than relying on generic per-pound cost figures circulated online.
- Market concentration: with 67.9% of large food-size trout moving through processors, a farm without a processor relationship or an established direct-sales channel faces a real market-access gap at harvest time.

Monitoring a Trout Farm With Satellite Data
A trout farm’s water source doesn’t exist in isolation — upstream land use, vegetation cover, and watershed conditions all affect the cold, clean flow a trout operation depends on. Farmonaut’s tools apply here alongside the aquaculture-specific systems covered above:
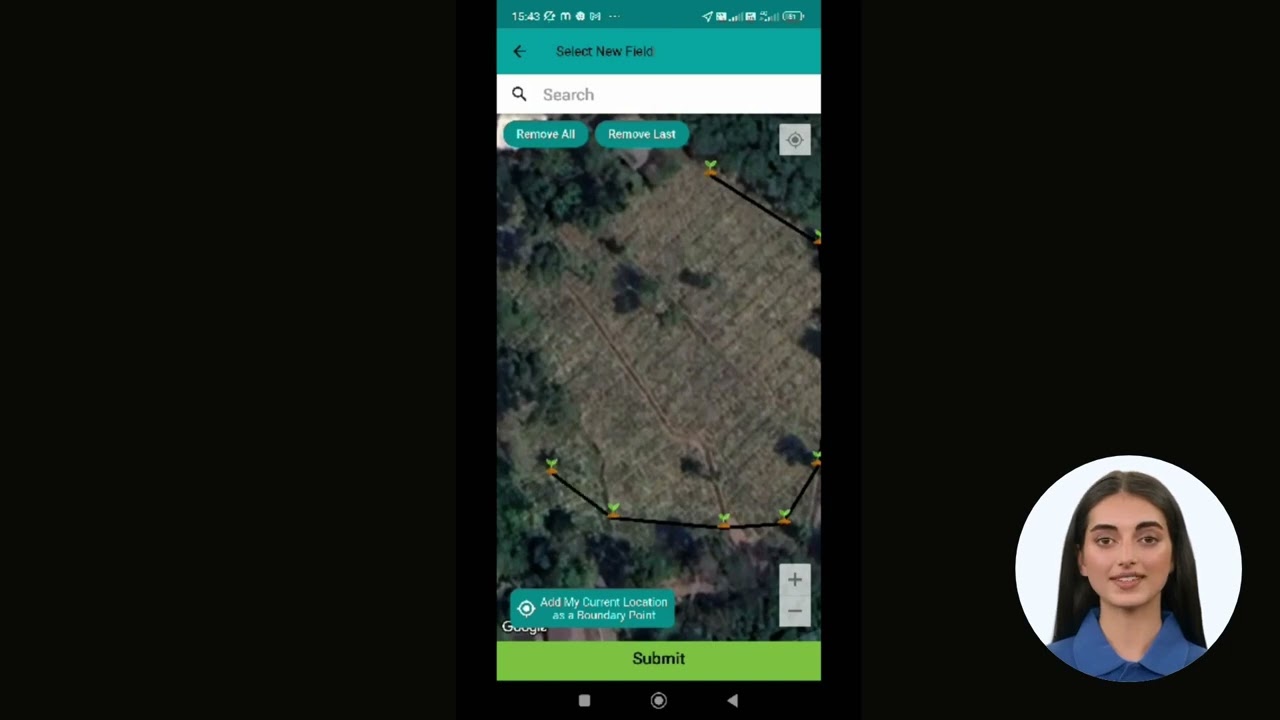
- Satellite Monitoring: track vegetation and land conditions around a water source through the Farmonaut farm management platform, accessible via web and mobile.
- Traceability: document fish origin and handling with blockchain-based product traceability, useful for processor and direct-sale buyers who ask for chain-of-custody records.
- Carbon and Resource Tracking: quantify farm-level environmental metrics with carbon footprinting tools.
- Fleet and Logistics: for multi-site operators moving feed, fingerlings, or harvested fish, fleet management tools help coordinate transport.
- Developer Access: integrate satellite and weather data directly via the Farmonaut API, documented at the API developer docs.
Frequently Asked Questions
Getting Started
The durable checklist for any trout farming plan — DIY, indoor, outdoor, or aquaponic — comes down to four checks before you stock a single fingerling: confirm your water source holds 50–61°F year-round, confirm your state’s water rights and aquaculture permitting requirements, line up a certified hatchery for fingerlings, and identify your buyer (processor, direct-sale, or stocking market) before harvest, not after. Every one of those checks stays valid regardless of what USDA’s prices do next year.
For the numbers themselves, USDA NASS’s Trout Production report updates every February, and USDA NASS Quick Stats gives state-level detail between annual releases. Run this year’s figures against what is cited here before finalizing a business plan — prices in this fast-moving a market shift enough year to year that a 2025 number is a starting point, not a guarantee.
Ready to add satellite-based land and water monitoring to your operation? Explore the Farmonaut app, the Farmonaut API, or the carbon footprint tracking service.

 Aerospect
 Delicio
 Payagri
 WB Dev
 Sama Premium
 Prochecker
 Tres Valles
 LACOS Geoinformation
 Pulsar Supernova
 Magrifly
 LatConnect 60
 WebsEdge
 Blickwinkel
 Agricultural Credit Policy Council
 Marei Nursery
 eKGIS
eKGIS Mostas Tech
 Andex
Andex FCF India
 Unifrutti Gulf
 Deluxe Conseil
