

Reviewed August 2026 against USDA Economic Research Service (ERS) farm sector debt data and USDA Farm Service Agency (FSA) lending rate announcements.
Try it: Run your own numbers →
Alternative agriculture lending is credit for farmers that does not come from a conventional bank mortgage or an FSA direct loan — it includes fintech platforms that underwrite with satellite and yield data, supply-chain and contract financing tied to buyer purchase orders, and cooperative or peer-funded capital pools. It exists because US farm sector debt is forecast at $624.7 billion for 2026, up 5.2% year-over-year, and a meaningful share of that borrowing base — particularly smaller and diversified operations — does not fit neatly into the collateral and documentation requirements traditional lenders use. This article covers what the model looks like today, how it compares to agricultural lending APIs and traditional bank credit, and what a lender or farm operator can verify for themselves rather than take on faith.
Table of Contents
- What Is Alternative Agriculture Lending?
- The US Farm Debt Picture Driving Demand
- Key Models of Alternative Agriculture Lending
- Comparing the Models
- Agricultural Lending APIs: What They Actually Do
- Interest Rates: Traditional vs. Alternative
- Risks, Gaps, and What’s Actually Unknown
- Where Satellite Data Fits Into a Lending Decision
- Loan Cost Comparison Calculator
- Frequently Asked Questions



What Is Alternative Agriculture Lending?
“Agriculture alternative” financing and “alternative agriculture lending” describe the same thing from two search angles: credit mechanisms that sit outside the standard bank-loan-plus-collateral structure. In the US, the baseline system runs through commercial banks, the Farm Credit System, and USDA’s Farm Service Agency, which sets its own direct lending rates monthly. Alternative agriculture lending layers on top of — or works around — that baseline using three levers traditional lenders rarely use at scale: remote-sensed field data instead of only paper credit history, revenue or contract-based underwriting instead of only real-estate collateral, and pooled or peer capital instead of only balance-sheet lending.
This matters most for operations that don’t fit the traditional underwriting box: diversified specialty-crop growers, first-generation farmers without decades of tax returns, and operations transitioning to sustainable or regenerative practices whose value is partly in soil and carbon metrics a bank loan officer isn’t equipped to price.
The US Farm Debt Picture Driving Demand
The scale of US farm borrowing explains why alternative channels have room to grow. USDA’s Economic Research Service forecasts total US farm sector debt at $624.7 billion for 2026, split between $404.3 billion in real estate debt and $220.4 billion in non-real estate debt (equipment, operating lines, inputs) — a 5.2% increase over the prior year. The farm sector’s debt-to-asset ratio sits at 13.75% for 2026, which USDA ERS still classifies as a historically manageable level, though the trend line matters more than the single-year snapshot: farm debt has risen 73% since 2012, per USDA ERS’s farm sector debt publication. That’s a structural increase in how much capital agriculture requires per acre, driven by input costs, land values, and equipment prices rising faster than commodity receipts in most years.
None of these figures are static. USDA ERS revises its farm sector income and finances forecasts each year and republishes the assets-debt-and-wealth series directly at USDA ERS: Assets, Debt, and Wealth — check that page directly for the current-year figure rather than treating the 2026 forecast above as fixed once a newer release is out.
Key Models of Alternative Agriculture Lending
1. Digital & Fintech Lending Platforms
Fintech agricultural lenders underwrite using field-level data rather than relying solely on two or three years of tax returns:
- ✔ Satellite imagery and remote-sensing data feed risk models that estimate yield potential and field condition independent of a farmer’s paper credit history.
- 📲 Automated underwriting shortens approval timelines relative to manual loan-file review, though exact turnaround times are lender-specific and not something a general market figure can responsibly represent — ask any platform for its stated SLA before assuming a number.
- ✔ Line-of-credit structures tied to the crop cycle release capital at planting and input-purchase points rather than as a single lump sum.
- Try it: Run your own numbers

2. Peer-to-Peer Lending & Crowdfunding
P2P and crowdfunding platforms connect individual investors directly to specific farm projects, most commonly specialty crops, agroforestry, or first-generation farm startups that a commercial bank would treat as too small or too undocumented to underwrite efficiently.
- ✔ Typically structured around a specific project or season rather than a general operating line.
- 🤝 Terms are negotiated per-platform; there is no single published national average rate for this category, unlike bank and FSA lending, where USDA FSA publishes rates monthly.
- ✔ Investors often receive a revenue share or fixed return rather than pure interest, which changes the tax and structuring treatment versus a conventional loan.

3. Contract Farming & Supply Chain Finance
Supply-chain lending advances capital against a purchase order or delivery contract rather than land or equipment:
- ✔ Processors, cooperatives, and large buyers finance growers directly against a signed contract, which reduces both the buyer’s supply risk and the grower’s need to secure a separate operating loan.
- ✔ Receivables-based advances release working capital for seed, fertilizer, and labor ahead of harvest and delivery.
- ✔ Because repayment is tied to a specific contract, underwriting can move faster than a full balance-sheet loan review — the credit risk is the buyer’s ability to pay, not solely the farm’s financial history.

4. Cooperative & Pooled Community Lending
Agricultural cooperatives and grower associations pool capital and credit standing so individual members can borrow on better terms than they’d access alone:
- ✔ Pooling collateral and repayment history across members lowers the effective risk per borrower for the lender extending credit to the co-op.
- 🤗 Peer accountability within a co-op structure functions as an informal underwriting layer.
- ✔ Capital recirculates within the membership rather than leaving the local economy, which is part of why USDA and state agricultural agencies continue to support cooperative lending structures alongside direct FSA credit.

Comparing the Models
| Model | Underwriting basis | Typical use case | Where documented rates exist |
|---|---|---|---|
| Traditional bank / Farm Credit System | Collateral, tax returns, credit score | Established operations, real estate purchase | Individual lender rate sheets; not centrally published |
| USDA FSA direct/guaranteed loans | FSA eligibility criteria, farm ownership/operating rules | Beginning farmers, underserved operations, disaster recovery | Published monthly by FSA — see rate source below |
| Fintech / digital lending platforms | Remote-sensing data, cash-flow analytics, alternative credit signals | Fast operating capital, operations without long credit history | Platform-specific; not centrally published |
| Peer-to-peer / crowdfunding | Project-specific investor terms | Specialty crops, agroforestry, farm startups | Platform-specific; not centrally published |
| Supply chain / contract finance | Buyer contract or purchase order | Pre-harvest working capital tied to a guaranteed sale | Negotiated per contract; not centrally published |
| Cooperative / pooled lending | Pooled member collateral and repayment history | Smallholder and first-generation members without individual credit history | Co-op specific; not centrally published |
The one column above worth being honest about is “adoption rate.” No US-specific figure for farmer adoption of alternative lending channels, or for total dollar volume moved through agri-fintech platforms, is published by USDA, the Federal Reserve, or any other primary source available for this article. The research base for this piece — see the Gaps section below — confirms the market-size and growth-rate literature exists (for instance Research and Markets’ US alternative lending market report) but does not break out agriculture-specific loan volume in dollars. Treat any adoption percentage you see elsewhere quoting agriculture-specific fintech lending as unsourced unless the publisher names its methodology.

Agricultural Lending APIs: What They Actually Do
An agricultural lending API is the infrastructure layer underneath most alternative lending models above — it’s how a fintech platform, bank, or insurer pulls field-level data into an underwriting decision without manually reviewing satellite imagery or site visits. In practice, these APIs return structured data — crop health indices, field boundaries, historical yield estimates, weather exposure — that a lender’s own risk model consumes programmatically.
- ✔ API-driven field verification lets a lender confirm a borrower’s stated acreage, crop type, and field condition remotely instead of dispatching a loan officer. Farmonaut’s satellite API is one such data source, alongside Farmonaut’s general API.
- 💡 Blockchain-based traceability layered on top of product traceability systems gives lenders and buyers an auditable record from field to sale.
- ✔ Documentation for building against a weather-and-satellite data feed is available at Farmonaut’s API developer docs, which cover the specific endpoints a lending or insurance system would call.
- ✔ APIs also feed crop loan and insurance verification workflows, where the same field data supports both the lending decision and any linked insurance product.
What no public source quantifies, as of this review, is total API-enabled lending volume in US agriculture — how many dollars of farm credit were underwritten with an API-sourced data feed in a given year. That figure isn’t published by USDA, the FDIC, or any ag-fintech trade body identified in the research for this piece. If you need it for a specific business case, the closest proxy is asking individual lending platforms directly what share of their originated loan volume used API-based verification — it is not a number that exists at the market level.

Interest Rates: Traditional vs. Alternative
USDA’s Farm Service Agency publishes lending rates monthly, on the first Wednesday of each month, at fsa.usda.gov. As a reference point, farm credit land loan rates averaged around 5.5% in 2025 per FSA’s published guidance. That’s the clearest anchor point available for comparison, because it’s the only lending-rate figure in this space with a fixed, dated, government-published source.
Alternative lending platforms — fintech, P2P, and supply-chain finance — do not publish a comparable aggregate rate. Rates on these products vary by platform, borrower risk profile, and loan structure, and no primary source in this research consolidates them into a single average. Rather than guess at a spread, the honest position is: get FSA’s current published rate from the link above for the government-backed baseline, then request the specific APR from any alternative lender you’re evaluating and compare the two directly for your loan amount, term, and collateral situation.
Risks, Gaps, and What’s Actually Unknown
Challenges Facing Alternative Agrilending
- ⚠ No centralized rate transparency: unlike FSA’s published monthly rates, alternative lenders set terms platform-by-platform, making it hard for a borrower to comparison-shop without contacting each one directly.
- ⚠ Regulatory treatment is still evolving for fintech and P2P agricultural lenders at the state level, which affects consistency of consumer protections across platforms.
- ⚠ Over-leverage risk compounds when farm debt is already rising 5.2% year-over-year against a 13.75% debt-to-asset ratio — additional easy-access credit needs to be matched with realistic repayment capacity, not just fast approval.
- ⚠ Data privacy in field-level and financial data sharing needs the same scrutiny farmers apply to any financial services relationship.
What’s Genuinely Not Published (and How to Get It Yourself)
- Total dollar volume moved through US agri-fintech lending platforms — not broken out by any source used here. Market-size research such as Research and Markets’ alternative lending market report covers growth trajectory, not agriculture-specific loan dollars; request platform-level origination data directly from individual lenders for a specific figure.
- US farmer adoption rate of alternative lending channels as a percentage of all borrowers — not tracked at the national level in USDA ERS or FSA releases reviewed for this piece.
- A direct interest-rate comparison between alternative ag lending and bank lending for sustainable-practice loans specifically — request current APRs from individual lenders and compare against the FSA rate above.
- Total FSA loan portfolio outstanding — FSA publishes delinquency and debt-assistance data but not a single outstanding-portfolio total in the sources reviewed; check FSA’s news and data releases directly for the current breakdown.
Where Farm Credit Analysis on This Site Goes Deeper
For a closer look at credit sourced from private and non-bank lenders specifically, see Agriculture Lending: Credit & Private Money Lenders, and for the sustainable-practice angle that many alternative lenders now underwrite against, see the benefits of sustainable agriculture and farming alternatives for sustainable agriculture.
- 🌎 Data-Backed Underwriting
- 🔗 Traceability
- 📱 Mobile Accessibility
- 🛰 Satellite Field Verification
- 🌱 Sustainability Data
Where Satellite Data Fits Into a Lending Decision
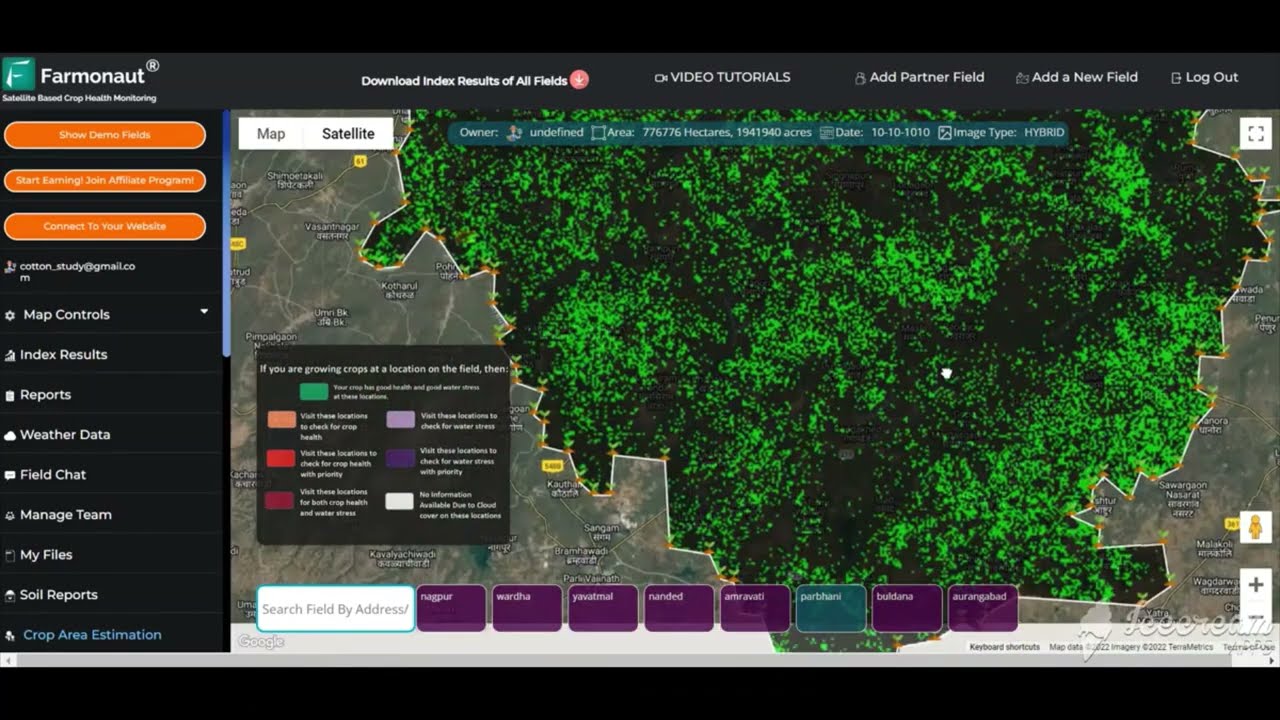
Farmonaut provides the field-data layer that alternative lenders, insurers, and cooperatives use to verify what a borrower reports without a manual site visit:
- ✔ Satellite-based crop monitoring accessible through web and mobile apps.
- ✔ Jeevn AI advisory for weather, yield, and field-risk signals that can inform a loan application’s supporting evidence.
- ✔ Traceability from field to output via Farmonaut’s product traceability tools.
- ✔ Carbon and environmental tracking through Farmonaut’s Carbon Footprinting solution, relevant for lenders offering climate-linked terms.
- ✔ APIs for lenders and institutions to automate field verification at scale — see API access.
Additional Farmonaut Tools Relevant to Lending Workflows
- ✔ Large-scale farm management for cooperatives and agribusinesses tracking multiple borrower operations.
- ✔ Crop and forest advisory platform.
- ✔ Fleet management for input-logistics tracking that supply-chain lenders can reference.
- ✔ Product traceability for supply-chain finance documentation.
Loan Cost Comparison Calculator
Compare the total interest cost of an FSA-rate loan against an alternative lender’s quoted APR for the same principal and term — enter your own numbers below.
Run your own numbers
Assumes simple interest for comparison purposes only — it does not model amortization, fees, origination costs, or compounding, and it does not account for speed-of-access or collateral requirements that may justify a rate difference. Use it to compare stated APRs side by side, not as a binding cost estimate. Enter your own FSA rate from FSA's current monthly rate release and your lender's actual quoted APR.
Farmonaut Subscription Plans
Access scalable satellite-based agrilending verification, crop monitoring, and digital advisory with Farmonaut plans for individuals, businesses, and institutions:
Frequently Asked Questions (FAQ)
- What is alternative agriculture lending?
- Credit for farm operations sourced outside a conventional bank mortgage or FSA direct loan — including fintech platforms underwriting with satellite and field data, supply-chain/contract finance, peer-to-peer funding, and cooperative pooled lending. It supplements, rather than replaces, the roughly $624.7 billion in total US farm sector debt USDA ERS forecasts for 2026.
- What is agriculture alternative lending used for?
- Most commonly: fast operating capital ahead of input purchases, financing for operations without a long tax-return credit history, and working capital for specialty or transitional (organic/regenerative) crops that traditional collateral-based underwriting undervalues.
- What is an agricultural lending API and who uses one?
- A programmatic data feed — typically satellite, weather, or yield data — that lenders, insurers, and fintech platforms integrate into their own underwriting systems to verify a borrower's field conditions and claims without a manual visit. See Farmonaut's API developer docs for one implementation example.
- How do alternative agriculture lending interest rates compare to bank or FSA rates?
- USDA FSA published farm credit land loan rates averaging around 5.5% in 2025, refreshed monthly at fsa.usda.gov. Alternative lenders do not publish an aggregate comparable rate — request the specific APR from each platform and compare it directly against FSA's current published figure.
- Is US-specific data on alternative agriculture lending adoption available?
- Not at the national level from USDA, FSA, or the market research reviewed for this article. Total agri-fintech dollar volume and farmer adoption percentage specific to agriculture are not broken out in current public sources — ask individual platforms for origination volume directly if you need that figure.
Conclusion: What Actually Determines Whether Alternative Lending Fits
Alternative agriculture lending is a real, growing parallel channel to bank and FSA credit in the United States, driven by the same forces pushing total farm debt to a forecast $624.7 billion in 2026: rising input costs, tighter margins, and operations that don't fit conventional underwriting. The decision for any individual farm comes down to three checkable things — the reference rate (get FSA's current monthly rate at the source linked above), the alternative lender's actual quoted APR for your specific loan, and whether your operation's documentation (yield history, contracts, field data) is stronger on the alternative-lender side or the traditional-lender side.
Where public data runs out — total agri-fintech lending volume, national adoption rates, API-enabled loan dollars — this article has said so directly rather than filling the gap with an invented number. Use the comparison table, the FSA rate link, and the calculator above to run your own numbers, and check USDA ERS's Assets, Debt, and Wealth page periodically since farm debt figures are forecast and revised on a recurring cycle, not fixed once a year.

 Yaduka Agrotech
 Kalustyan
 Tucor
Tucor Geno
Geno Hayleys Agriculture
 Linx Agritech
 Adinet
 Save Your Soils
 Grandstream Algérie
 XOS Realty
 Geospatial Lab Africa
 Agro La Gándara
 HIPSAC
 ZOL Zimbabwe
 Juligerm
 MISE Maroc
