

Sustainable Agricultural Development: What It Means, With Data
Reviewed September 2026 against USDA NASS (2024 Census of Agriculture), USDA ERS, and Eurostat/USDA FAS reporting.
Try it: Enter your numbers above to see estimated payback. →
Sustainable agricultural development is farming that maintains or increases yield while conserving the soil, water, and biodiversity that future harvests depend on — measured, in practice, by acres under conservation practices, organic certification, and cover cropping rather than by intention alone. In the United States, that meant 3.6 million acres of certified organic cropland and 17,445 certified organic operations as of 2021, out of 876 million total acres of agricultural land counted in the 2024 Census of Agriculture. A sustainable agricultural development fund, in the US context, usually refers to conservation cost-share and incentive programs — USDA spent an average of $6.0–6.5 billion a year (2023 dollars) on conservation programs — rather than a single named federal fund. This article works through the definition, the acreage and dollar figures that back it up, the US programs that fund it, and a calculator you can use to size a cover-crop or conservation investment on your own operation.
Table of Contents
- What Is Sustainable Agricultural Development?
- US Adoption by the Numbers: Acres, Farms, Dollars
- Sustainable Agricultural Development Funds: What Actually Pays for This
- The Core Practices, Ranked by Adoption
- How US Adoption Compares to the EU
- Monitoring Progress: Satellite and Data Tools
- Cover Crop & Conservation ROI Calculator
- A Durable Checklist: How to Verify Any Claim on This Page
- FAQ
- References
- Try it: Enter your numbers above to see estimated payback.
What Is Sustainable Agricultural Development?
The FAO frames sustainable agricultural development as managing land, water, and biological resources to meet current food and fiber needs while safeguarding the resource base for future generations — the standard reference is the FAO’s Sustainable Food and Agriculture policy gateway, which ties the concept to the UN Sustainable Development Goals rather than to any single country’s program. In practice, on a US operation, that definition cashes out into a short list of measurable choices:
- ✔ Soil-conserving rotation and tillage — reduced or no-till, cover cropping between cash crops.
- 📊 Certified organic transition — a three-year process regulated by USDA, ending in National Organic Program certification.
- 🌱 Integrated conservation practices — buffer strips, nutrient management plans, and rotational grazing, typically supported through USDA Farm Service Agency and Natural Resources Conservation Service (NRCS) programs.
- 🔒 Water and input efficiency — irrigation scheduling and precision nutrient application that reduce runoff without cutting yield.
None of these is optional add-on marketing — each has a USDA-tracked acreage or dollar figure attached, which is what separates “sustainable agricultural development” as a working definition from “sustainable agricultural development” as a slogan. The next section lays out those figures.

US Adoption by the Numbers: Acres, Farms, Dollars
The 2024 Census of Agriculture counted 1.88 million US farms working 876 million acres, for an average farm size of 466 acres, per USDA NASS Farms and Land in Farms. Against that base, certified organic operations numbered 17,445 farming 3.6 million acres as of 2021 — under half a percent of total farmland, according to USDA ERS organic agriculture data. Organic product sales, however, reached $71.6 billion in 2024 (USDA ERS), showing the market is scaling faster than certified acreage — a gap that matters for anyone weighing organic transition against other conservation routes.
Cover cropping is the fastest-moving practice in the dataset: the 2022 Census of Agriculture recorded a 16.9% increase in acres planted to cover crops compared with the prior census cycle, per USDA NASS figures compiled by the National Young Farmers Coalition. Cotton growers were early adopters of a related practice — double-cropping and cover crops covered 32% of US cotton acres as of 2019, per USDA ERS soil tillage and crop rotation data.
| Metric | Figure | Vintage | Source |
|---|---|---|---|
| Total US farms | 1.88 million | 2024 Census of Agriculture | USDA NASS |
| Total US agricultural land | 876 million acres | 2024 Census of Agriculture | USDA NASS |
| Average farm size | 466 acres | 2024 Census of Agriculture | USDA ERS |
| Certified organic cropland | 3.6 million acres | 2021 | USDA ERS |
| Certified organic operations | 17,445 farms | 2021 | USDA NASS |
| US organic product sales | $71.6 billion | 2024 | USDA ERS |
| Cover crop acreage growth | +16.9% | 2022 Census vs. prior census | USDA NASS |
| Cotton acres in cover/double-crop | 32% | 2019 | USDA ERS |
| Annual USDA conservation program spending | $6.0–6.5 billion | 2023 average, 2023 dollars | USDA ERS |
These figures are refiled on a Census cycle (every five years, most recently 2024) or annually for ERS series — none of them are static, and the next Census is due in 2029. For a real-time read between Census years, USDA NASS operates the Quick Stats database, which lets you query cover crop, organic, and conservation adoption by commodity, state, and year directly at quickstats.nass.usda.gov — this is the tool to check before quoting any acreage figure as current.
Sustainable Agricultural Development Funds: What Actually Pays for This
There is no single federal entity named “the sustainable agricultural development fund” — the phrase most often points searchers toward the mix of USDA conservation cost-share programs (EQIP, CSP, and related Farm Bill conservation titles administered through NRCS and FSA) that collectively spent an average of $6.0–6.5 billion annually in 2023 dollars, per USDA ERS figures compiled by sustainable agriculture policy groups. That spending funds cost-share for cover crop seed, fencing for rotational grazing, irrigation efficiency upgrades, and nutrient management planning — the practical mechanisms behind every acreage figure in the table above.
Beyond public programs, private capital has moved into the same space under the “regenerative agriculture” label, which overlaps heavily with sustainable agricultural development but is tracked separately. ADM reported 5 million acres enrolled in its regenerative agriculture program as of September 2025, and the global regenerative agriculture market was sized at $14.5 billion in 2025 by market research firms. USDA’s Agricultural Research Service, together with McKinsey analysis published in 2024–2025, found regenerative practices deliver a 10–20% yield improvement over the long term — a range, not a guarantee, and one that depends on baseline soil condition and years since adoption.
If you’re a producer looking for funding rather than just data, the starting point is your local USDA NRCS field office, which administers EQIP and CSP applications on a rolling or annual sign-up basis that changes by state and fiscal year — check with your office directly rather than relying on a fixed date here, since sign-up windows shift with each Farm Bill cycle.
The Core Practices, Ranked by Adoption
Not every sustainable practice has the same reach. Ranked by the most recent US adoption figures available, from broadest to narrowest:
- Cover cropping — up 16.9% in acreage between the two most recent Census cycles (2022 Census of Agriculture, USDA NASS); the broadest-reaching practice because it requires no certification, only a seed and a planting window.
- Reduced tillage / soil-conserving rotation in row crops — best documented in cotton, where 32% of acres carried cover or double-crop treatment as of 2019 (USDA ERS).
- Regenerative agriculture programs (private, contract-based) — 5 million acres under ADM’s program alone as of September 2025; other grain buyers and food companies run parallel programs not separately totaled here.
- Certified organic production — the narrowest by acreage (3.6 million acres, 2021) but the most economically visible, generating $71.6 billion in sales in 2024.
🥗 Food security and productivity connect directly to this ranking: cover cropping and reduced tillage protect yield stability in drought years by holding soil moisture and structure, which is why USDA extension guidance treats them as the entry point for producers new to conservation practices, ahead of organic transition’s three-year certification process.
✔ Five Things a Sustainable Agricultural Development Program Should Measure:
- ✅ Acres under active conservation practice, not acres merely enrolled
- ✅ Yield trend over a multi-year rolling average, not a single season
- ✅ Input cost per acre before and after transition
- ✅ Water use against a documented baseline
- ✅ Certification or program status (organic, regenerative contract, conservation cost-share) with renewal dates tracked



Producers managing multiple fields or a large operation can track conservation-practice compliance and field-by-field status through our large-farm management and satellite monitoring solution, which flags fields due for cover crop planting windows or nutrient management review.
How US Adoption Compares to the EU
For context on scale, the European Union’s organic farmland share is far ahead of the US on a percentage basis: 3% of EU agricultural land was under organic farming as of 2024, according to Eurostat data reported via USDA FAS. Italy alone carried 2.46 million hectares of organic farmland in 2023 — nearly two-thirds of the entire US certified organic footprint (3.6 million acres ≈ 1.46 million hectares) concentrated in a single EU member state. That gap reflects decades of EU Common Agricultural Policy subsidy specifically targeting organic conversion, a policy structure the US conservation program mix does not mirror directly.
The comparison matters for US producers evaluating export markets or EU-linked supply chains: buyers sourcing for EU retail increasingly expect organic or regenerative documentation as standard, not premium, given the EU’s higher baseline adoption rate.

Monitoring Progress: Satellite and Data Tools
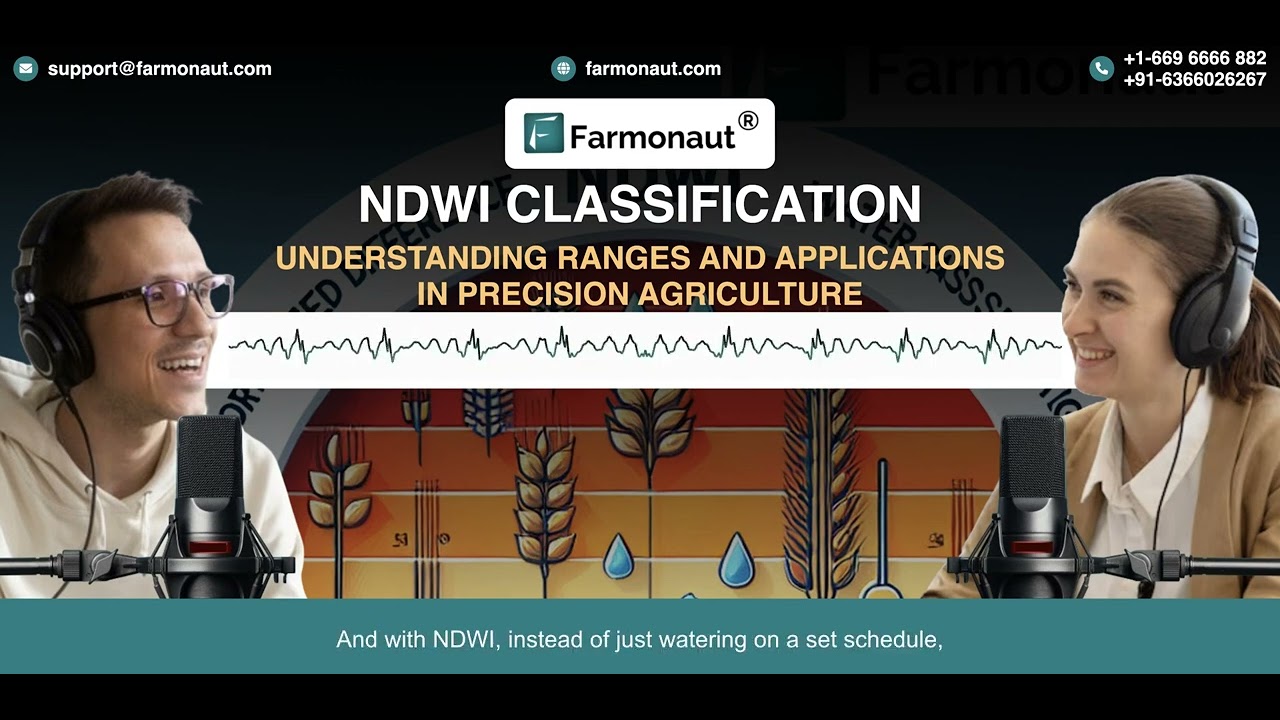
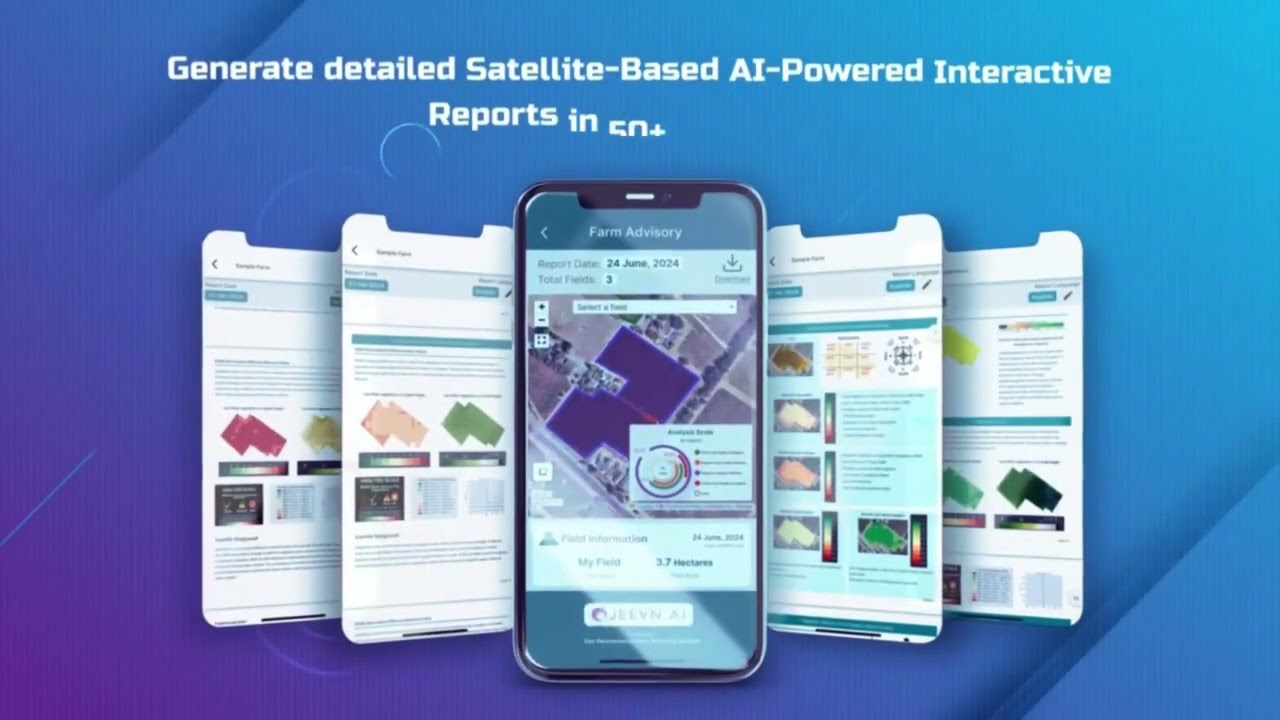
Every figure above answers “how much sustainable practice exists” at a national or program level. The harder question for an individual operation is “is my field actually progressing” — soil health, canopy vigor, and water stress don’t show up in a Census table. Satellite monitoring platforms, including ours at Farmonaut, close that gap between annual USDA reporting and week-to-week field conditions:
- ✔ Multispectral imagery to track crop health, canopy vigor, and early stress signals tied to conservation practice performance.
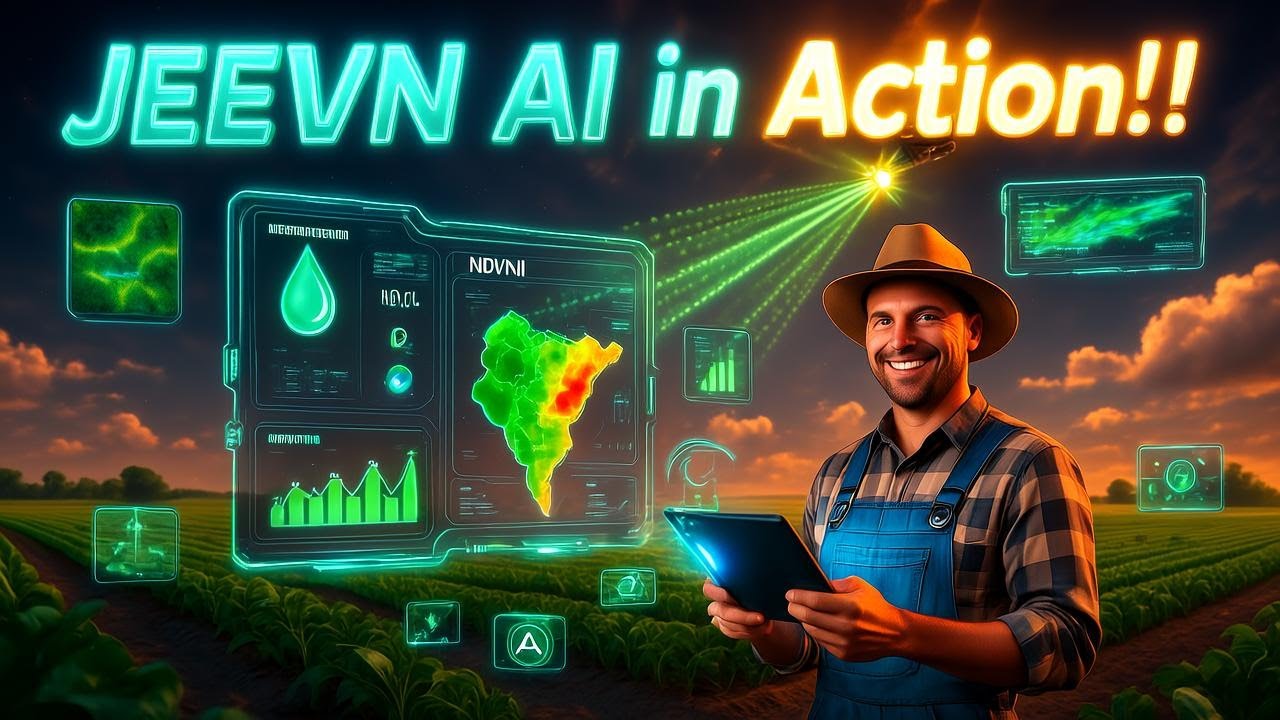
- 📊 Weather and advisory data via the Jeevn AI Advisory System, supporting planting-window and cover-crop-termination decisions.
- 🌱 Blockchain-based traceability to document supply chain transparency for organic or regenerative-contract buyers who require verified sourcing.
- ⚠ Carbon footprint tracking through emissions monitoring, relevant for regenerative program enrollment and carbon-credit documentation.
- 🚚 Remote fleet and equipment management to reduce fuel use and input overlap, both cost and emissions levers.
- 💰 Satellite-based verification for loans and crop insurance, useful when conservation-linked lending requires field documentation.

Developers and institutions building conservation-tracking tools of their own can integrate directly through the Farmonaut API and the accompanying developer documentation, which expose the same imagery and advisory feeds used in the consumer app.

Cover Crop & Conservation ROI Calculator
Use the figures you actually have for your operation — acreage, seed cost, and the USDA-documented 10–20% long-term yield range for regenerative practices — to estimate a multi-year payback on a cover crop or conservation investment.
Enter your numbers above to see estimated payback.
A Durable Checklist: How to Verify Any Claim on This Page
Every figure in this article carries a source and a date because every one of these figures will be superseded. Use this method, not the numbers above, as the lasting part of this page:
- Check the Census cycle first. USDA runs the Census of Agriculture every five years; the 2024 Census is the current baseline, the next is due in 2029. Farm count, total acreage, and average farm size all reset on that cycle.
- Use NASS Quick Stats for anything between Census years. Cover crop, organic, and conservation-practice acreage can be queried by state, commodity, and year at quickstats.nass.usda.gov.
- Treat ERS series as annual, not fixed. Organic sales figures ($71.6 billion for 2024) update yearly through USDA ERS; check the USDA ERS organic agriculture page for the latest release before citing this figure past 2026.
- Confirm conservation program funding levels with your local NRCS or FSA office each fiscal year — Farm Bill appropriations change the $6.0–6.5 billion baseline annually.
- For EU comparisons, go to Eurostat directly or the USDA FAS GAIN report series, since the 3% EU organic-land figure updates as EU member states report.
Explore related coverage
For a practices-first look at sustainable agribusiness techniques applicable across regions, see our companion article on 8 sustainable agriculture practices in agribusiness.
FAQ
What is sustainable agricultural development?
It is farming and land management that maintains productivity while conserving soil, water, and biodiversity for future use — defined at the policy level by the FAO's Sustainable Food and Agriculture framework and measured in practice through metrics like certified organic acreage (3.6 million acres in the US as of 2021), cover crop adoption (up 16.9% per the 2022 Census of Agriculture), and conservation program participation.
What is a sustainable agricultural development fund?
In the US, there is no single fund by that name. The phrase most commonly refers to the combination of USDA conservation cost-share programs — chiefly EQIP and CSP, administered through NRCS and FSA — which together averaged $6.0–6.5 billion in annual spending (2023 dollars) per USDA ERS figures. Apply through your local USDA NRCS field office.
How is sustainable agricultural development different from agricultural sustainable development?
They describe the same concept — the word order doesn't change the meaning. Both refer to farming practices and policy that balance production with long-term resource conservation, tracked through the same USDA and FAO metrics referenced throughout this article.
How much US farmland is under sustainable or organic management right now?
As of the most recent published figures: 3.6 million acres were certified organic (2021, USDA ERS) out of 876 million total agricultural acres (2024 Census of Agriculture) — under 0.5% by certification, though a much larger uncounted share uses cover cropping, reduced tillage, or private regenerative-program practices that don't require certification. Query USDA NASS Quick Stats for a state-by-state, year-by-year breakdown.
How can I track sustainable practices on my own farm?
Beyond USDA program enrollment, satellite monitoring platforms such as our Farmonaut app let you track field-level crop health, water stress, and carbon footprint against a documented baseline — useful both for on-farm decisions and for the verification records that conservation and regenerative programs increasingly require.
References & Resources
- USDA Economic Research Service — Organic Agriculture
- FAO — Sustainable Food and Agriculture Policy Gateway
- USDA NASS — Farms and Land in Farms
- USDA ERS — Soil Tillage and Crop Rotation
- USDA NASS Quick Stats Database
- Farmonaut — Satellite Crop Monitoring and Traceability
Discussion
Questions, corrections or field experience? Share them below. First-time comments are reviewed before they appear, and your email is never published.
No comments yet. Be the first to add a question or your experience.

 Sama Premium
 Mahaswami
 Prochecker
 Tres Valles
 LACOS Geoinformation
 Pulsar Supernova
 Magrifly
 LatConnect 60
 WebsEdge
 Blickwinkel
 Agricultural Credit Policy Council
 MCSOD
 Marei Nursery
 eKGIS
 Mostas Tech
 Andex
 FCF India
 Unifrutti Gulf
 Deluxe Conseil

 Licence holder · Niger · Gold
 Licence holder · Nigeria · Gold + lithium










