

Reviewed September 2026 against USDA Economic Research Service and USDA National Agricultural Statistics Service data.
Try it: Run your own numbers →
Is Farming Profitable? What the Numbers Actually Say
US net farm income is forecast at $158.4 billion for calendar year 2026, according to the USDA Economic Research Service farm sector income forecast. That is the headline answer to “is farming profitable” — yes, at the sector level, but the margin between that number and total production expenses of $492.8 billion for 2026 is where individual farm strategy decides who actually keeps the money. Crop cash receipts are projected at $253.0 billion for 2026, with corn contributing $67.3 billion and soybeans $47.9 billion — the two crops that dominate US planted acreage and therefore dominate farm strategy conversations.
A farm strategy, in the practical sense this article uses it, is the set of repeatable decisions — what you plant, how you price inputs, which technology you adopt, how you sell, and how you finance — that determines whether your operation lands above or below that sector-wide average. Modern farm management strategies for scale and profitability increasingly hinge on five levers: diversification, precision technology, sustainable practice adoption, market access, and financial risk management. Each is covered below with the actual adoption rates and cost ranges, not vague encouragement to “innovate.”
Key Insight
Fertilizer, lime, and soil conditioner expenses rose 15.3% year-over-year heading into 2026, per USDA ERS. That single input line is now one of the fastest-moving costs in any US crop budget — a strategy that doesn’t actively manage input timing and rate is losing margin before the crop is even in the ground.
Farm Strategy: The Five Levers That Move Net Income
Before getting into tactics, it helps to see where the money actually sits. USDA NASS put 2026 US corn planted acreage at 95.3 million acres and soybean planted acreage at 85.4 million acres — the two crops that define row-crop strategy nationally. Soybean yield hit a record 53.0 bushels per acre in 2025, per the USDA NASS acreage report, which sets the yield baseline every subsequent strategy comparison should be measured against, not a round number pulled from memory.
Farm prices received in April 2026 were $4.31/bushel for corn and $11.20/bushel for soybeans, with wheat at $5.70/bushel, according to USDA NASS agricultural prices data. These prices move monthly — NASS republishes them on a fixed schedule, so treat the numbers above as an April 2026 reference point and pull the current figure from the same page before pricing any decision.
Precision Agriculture Adoption: Where the US Actually Stands
This is the number most farm-strategy articles skip: only 27% of US farms or ranches use any precision agriculture practice, per USDA ERS. But among large-scale crop farms specifically, 70% use guidance autosteering systems. That gap — 27% overall versus 70% on large operations — is the single clearest data point showing that scale changes which strategy pays off first. A 200-acre operation and a 5,000-acre operation are not choosing between the same tools.
1. Diversification and Specialization
Diversification and specialization pull in opposite directions but both defend margin. Diversification spreads a farm across crops, livestock, or side ventures so a price drop in one commodity doesn’t sink the whole operation — relevant given that corn at $4.31/bushel and soybeans at $11.20/bushel move independently on their own supply-demand cycles. Specialization in a niche — premium beef, specialty grain, or a low-overhead sideline like vermiculture — captures margin that broad commodity production can’t.
- ✔ Risk Mitigation: Reduce dependency on a single crop or market.
- ✔ Boosted Profitability: Capture multiple revenue streams, especially when one commodity’s price cycle turns down.
- ✔ Resource Efficiency: Optimize land, feed, labor, and equipment across activities instead of leaving capacity idle in the off-season.
- ✔ Access to Niche Markets: Meet demand for organic, grass-fed, or specialty-grade products that command a premium over commodity pricing.
Advantage of Mixed Farming
The core advantage of mixed farming — running crops and livestock on the same operation — is that manure from livestock offsets purchased fertilizer, and crop residue offsets purchased feed. With fertilizer and soil conditioner costs up 15.3% year-over-year into 2026 (USDA ERS), that internal input loop is worth more today than it was even two years ago. Mixed systems also smooth cash flow: livestock sales and crop sales rarely hit the same calendar month, which reduces the working-capital gap that pure row-crop operations have to bridge with operating loans.
Pro Tip
Vermiculture (worm farming) is a genuinely low-capital sideline: startup infrastructure is minimal, the production cycle is short, and demand for premium compost and organic fertilizer inputs has grown as commercial fertilizer costs have climbed. It won’t replace row-crop income on any real acreage, but as a diversification line on small land it has one of the lowest entry costs of any farm sideline.
Worm Farming and Small-Scale Diversification
For readers exploring low-investment, high-yield opportunities, worm farming for profit fits the same logic as any diversification play: low initial investment, rapid production cycle, and consistent local demand from organic growers and gardeners who pay a premium for worm castings over synthetic soil conditioners.

Livestock Diversification: Sheep, Cattle, Poultry
Livestock diversification hinges on breed selection, feed efficiency, and matching product to a specific market rather than commodity sale:
- 💡 Sheep: Diversify across lamb, mutton, wool, and regional dairy. Feed efficiency and breed selection drive margin more than flock size.
- 💡 Cattle: Premium beef and dairy products. Herd genetics and health management directly raise per-head margins.
- 💡 Poultry: Premium eggs, organic meat, or specialty breeds serve niche buyers who won’t pay commodity-egg prices.

2. Precision Agriculture and Farm Management Strategy
Technology adoption is the clearest differentiator in modern farm management strategies for scale and profitability — but adoption is far from universal. Recall the ERS figures above: 27% of all US farms use any precision ag practice, rising to 70% for guidance autosteering on large-scale crop farms specifically. That means most of the productivity gap between “average” and “top-quartile” US farms is not a secret input — it’s whether the operation has crossed into that adopting minority yet.
- 📊 Precision farming: Sensors and satellite imagery for soil health, irrigation timing, and crop management.
- 📊 Drones for monitoring: Early detection of disease, nutrient deficiency, and water stress before yield loss is visible from the road.
- 📊 Guidance autosteering: The single most-adopted precision technology among large-scale crop farms at 70%, per USDA ERS — it reduces overlap on inputs like the fertilizer that just rose 15.3% year-over-year.
- 📊 AI and farm management software: Real-time tracking of expenses, yields, and market prices for the same kind of financial-management strategy covered in Section 5.

Durable Method: How to Check If Precision Ag Pays Off on Your Acreage
Don’t adopt a technology because it’s trending — run the arithmetic first. Take your current per-acre input spend (fertilizer, seed, fuel), estimate the percentage a given tool typically reduces (guidance autosteering mainly cuts overlap waste; satellite NDVI mainly cuts over-application), multiply by your acreage, and compare against the annual subscription or hardware cost. The calculator in Section 10 below runs exactly this comparison with your own numbers instead of a assumed farm size.
Leverage Satellite Intelligence
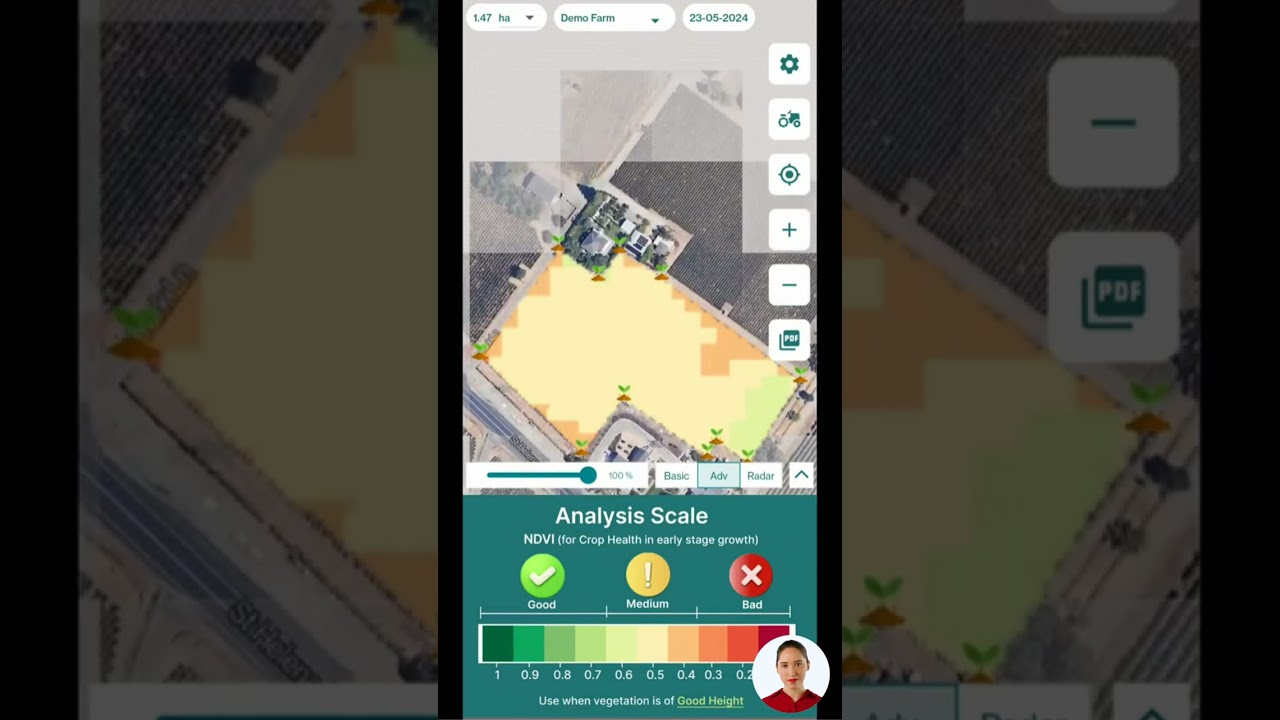
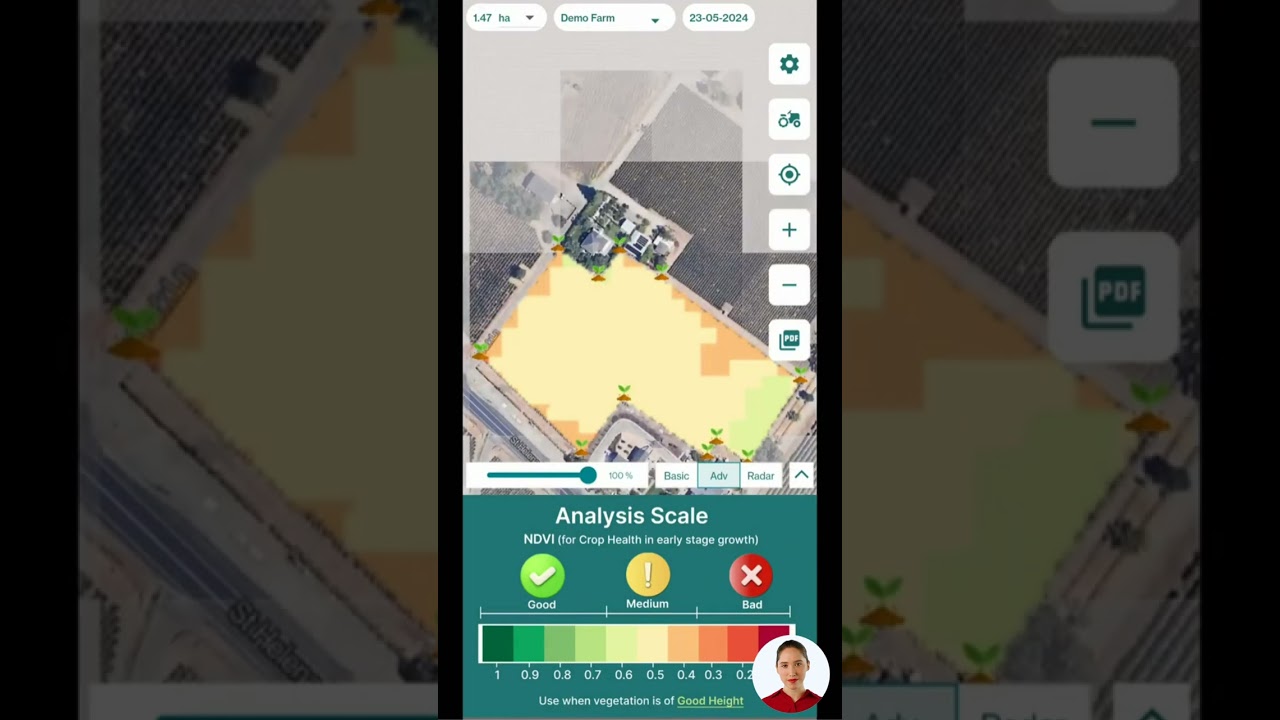
Satellite-based monitoring is now accessible to operations of any size through platforms like Farmonaut, which provide NDVI vegetation health data, soil condition tracking, and environmental monitoring without the capital cost of ground sensor networks.
- ✔ Remote, real-time insight for input-timing decisions
- ✔ AI-based weather and productivity advisories
- ✔ Blockchain-based product traceability for buyers who require it
- ✔ Automated fleet and resource management
- ✔ Carbon and compliance monitoring
For developers and business operators, functions are available via API for automation: Farmonaut API | API Developer Docs.

🌱 Precision Technologies Ranked by Adoption
- Guidance autosteering — 70% adoption among large-scale crop farms (USDA ERS)
- Satellite-based NDVI crop monitoring for real-time health checks
- Drones for precision spraying, scouting, and livestock tracking
- IoT sensors for soil moisture and weather monitoring
- Blockchain traceability for supply chain verification — see Traceability Solutions
3. Sustainable and Regenerative Practices
Sustainability functions as a business strategy, not just an environmental one: it opens access to premium markets and reduces exposure to rising input costs — directly relevant when fertilizer expenses are up 15.3% year-over-year. Rotational grazing, composting, and carbon-credit programs are the three practices with the clearest cost-reduction path.
- ✔ Rotational Grazing: Increases pasture productivity and reduces purchased feed costs.
- ✔ Composting and Worm Castings: Cuts fertilizer purchases while creating a sellable byproduct. Farm Management Tools
- ✔ Eco-certifications: Premium pricing for organic, grass-fed, or carbon-neutral labeling.
- ✔ Carbon Markets: Monetize regenerative practices via carbon footprint tracking.
- ✔ Crop Rotation: Maintains soil health and long-run yield stability.

Environmental Spotlight
Carbon farming offers a revenue line beyond crop and livestock sales while addressing buyer sustainability requirements. Track your farm’s carbon position with tools like Farmonaut’s Carbon Footprinting Solution.

4. Market Access, Value Addition and Branding
Profitability depends heavily on where and how you sell, not just what you produce. Direct-to-consumer sales, vertical integration, and value addition all capture margin that otherwise goes to a processor or distributor.
- ✔ Value Addition: Processing, packaging, and branding capture more market value than raw commodity sale.
- ✔ Niche Marketing: Organic, grass-fed, or region-specific certification supports premium pricing over the NASS-reported commodity price.
- ✔ Digital Sales Channels: Online marketplaces and subscription produce boxes extend reach beyond local buyers.
- ✔ Blockchain Traceability: Supports food-safety documentation and premium or export eligibility. Learn about Blockchain Traceability
Common Mistake
Selling exclusively at commodity price — $4.31/bushel corn or $11.20/bushel soybeans as of April 2026 — while a neighboring operation captures a premium through branding or certification is the most common gap between average and top-quartile farm income.
5. Financial Management and Risk Reduction
With US total farm production expenses forecast at $492.8 billion for 2026 against $253.0 billion in crop cash receipts, expense control is not optional — it’s the difference between the sector’s $158.4 billion net income landing on your balance sheet or someone else’s. Financial planning means tracking feed, labor, veterinary, and equipment costs against real-time market prices, not an annual budget set once and forgotten.
- ✔ Farm Management Systems: Track expenses, inputs, and market prices for real-time decisions. Large-Scale Farm Management App
- ✔ Insurance and Loans: Agricultural insurance limits weather and disease exposure; satellite-verified data (see Farmonaut Crop Loan & Insurance) can improve credit access and reduce fraud risk in loan underwriting.
- ✔ Cooperative Models: Joint input purchasing and sales negotiation lower per-unit costs for smaller operations.
Refresh Path
The USDA ERS farm sector income forecast is updated quarterly, not annually — bookmark the forecast page directly rather than relying on the figures cited here past their quarter. NASS acreage and yield data update annually, with final 2026 figures expected in the June 2027 acreage report.
Farming Ideas for Small Land and Mixed Farming
Small-acreage operations can’t compete on commodity volume, so the highest-return strategies concentrate where per-acre value is highest rather than where total output is highest:
- Vermiculture: Minimal footprint, short production cycle, sellable to organic growers at a premium over synthetic fertilizer.
- Specialty vegetables and herbs: Direct-to-restaurant or farmers-market sale captures retail-adjacent pricing unavailable to commodity row-crop growers.
- Small ruminants (sheep/goats): Lower capital and pasture requirements than cattle, with wool, meat, and dairy as separate revenue lines from the same flock.
- Mixed crop-livestock systems: The advantage of mixed farming — manure offsetting fertilizer, residue offsetting feed — scales down to small acreage as well as up to large operations.
- Value-added processing: Turning raw output into jam, cheese, or cut flowers captures margin small acreage can’t get from volume alone.
On a small acreage, precision technology has a different payback profile than on a 5,000-acre row-crop farm — a $2,000 sensor system amortizes very differently over 20 acres versus 2,000. Run your own numbers in the calculator in Section 10.
“Lucky Farming”: What the Search Is Really Asking
There’s no USDA category, agronomic technique, or verified practice called “lucky farming” — it isn’t a term of art. What people searching this phrase are usually asking is one of two things: how to get better outcomes from limited information (the informal sense of “luck” as reduced downside risk), or a reference to a specific game, app, or content title using “lucky farming” as a name, which is outside the scope of a farm-economics article. If you arrived here searching that phrase looking for real farm profitability tactics, the honest answer is that “luck” in farming is best replaced with the risk-reduction tools already covered above — diversification (Section 1), crop insurance (Section 5), and precision monitoring that catches problems before they compound (Section 2). None of these eliminate weather or price risk, but they are the closest verifiable substitute for what the search phrase is chasing.
“The gap between US farms using any precision agriculture practice (27%) and large-scale farms using guidance autosteering (70%) is the single clearest sign that farm size changes which strategy pays off first.” — USDA ERS data, 2023
Emerging Trends in Farm Strategy
Several practices are shifting from early-adopter to mainstream in US row-crop and livestock operations, though adoption data specific to each is not yet separately published by USDA at the same granularity as the guidance-autosteering figure above:
- ✔ Circular Economy: Recycling livestock waste into biogas or vermiculture feedstock reduces costs while opening a secondary revenue line.
- ✔ Genetic Advances: Higher-yield, disease-resistant crop and livestock genetics reduce per-unit input cost.
- ✔ Renewable Integration: Solar irrigation and on-farm microgrids reduce exposure to energy price volatility.
- ✔ AI-Driven Advisory: Real-time, field-specific guidance reduces input waste beyond what a general agronomy calendar can achieve.

Comparison Table: Strategy vs. Cost vs. Payback
| Strategy | Typical Setup Cost (USD) | Documented Adoption / Impact | Time to Payback | Tools / Methods |
|---|---|---|---|---|
| Precision Guidance Autosteering | $2,000–$30,000 | 70% adoption on large-scale crop farms (USDA ERS) | 6–18 months | Autosteer kits, satellite RTK correction, Farmonaut monitoring |
| Any Precision Ag Practice | $300–$5,000 | 27% adoption across all US farms/ranches (USDA ERS) | 3–18 months | NDVI monitoring, soil sensors, variable-rate application |
| Sustainable / Regenerative Practices | $500–$5,000 | Offsets fertilizer cost rises (up 15.3% YoY, USDA ERS) | 12–24 months | Rotational grazing, composting, Farmonaut Carbon Footprinting |
| Crop / Livestock Diversification | $1,000–$10,000 | Buffers single-commodity price exposure (corn $4.31/bu, soy $11.20/bu, Apr 2026) | 9–18 months | Mixed cropping, small ruminants, vermiculture |
| Farm Management Software | $300–$2,500/yr | Supports expense tracking against $492.8B national production expense trend | 3–8 months | Farmonaut Large Scale Management App |
| Blockchain Traceability | $1,500–$6,000 | Supports premium/export market access | 12–15 months | Farmonaut Traceability Solutions |
Setup cost ranges depend on farm scale and existing equipment. Adoption and cost figures cited to USDA ERS where noted; ranges without a citation are typical vendor-quoted costs and should be confirmed against current supplier pricing.
Calculator: Precision-Ag Payback for Your Farm
Enter your own acreage, current per-acre input spend, and the tool’s typical cost to see a straight-line payback estimate — the same arithmetic described in the Section 2 sidebar, run on your numbers instead of a national average.
Run your own numbers
Assumptions: savings scale linearly with acreage and input spend, which is a simplification — real savings depend on soil variability, current overlap/waste levels, and tool accuracy. Excludes financing costs, maintenance, and any yield increase (this calculator only models input-cost savings, not revenue gains). Use your own farm’s input spend, not a national average, for a meaningful estimate.
Key Visual Lists for Farm Strategy
🚀 Top Strategy Moves by Evidence Strength
- ✔ Guidance autosteering — the highest-adoption precision tool among large-scale farms (70%, USDA ERS).
- ✔ Track input costs monthly, not annually — fertilizer alone rose 15.3% year-over-year into 2026.
- ✔ Diversify revenue lines to buffer against independent price cycles in corn, soybeans, and wheat.
- ✔ Price against current NASS data, not last season’s contract price.
- ✔ Reassess technology adoption against your own acreage using the calculator above, not a vendor’s average customer.
📋 Top Inputs That Impact Farm Profit
- Fertilizer and soil conditioner costs — up 15.3% year-over-year (USDA ERS)
- Seed and breed selection matched to market and climate
- Water and fertilizer efficiency through precision application
- Labor management — automation or upskilling
- Market timing against current NASS-published prices
How Farmonaut Fits Into a Farm Strategy
Farmonaut offers satellite-based monitoring, AI advisory, and blockchain traceability without the capital cost of ground sensor networks or hardware installs — relevant given that only 27% of US farms currently use any precision ag practice, per USDA ERS, and cost is one of the most commonly cited barriers to closing that gap.
- 🌐 Global Reach: Accessible to farms of any scale, from the small-land operations in Section 8 to large-scale row-crop farms.
- 📱 Real-time Intelligence: Web and mobile apps for crop health, carbon impact, and resource management. See it live: Farmonaut Web App
- 🛡️ Traceable and Trusted: Blockchain-secured traceability for export and organic certification needs. Explore: Farmonaut Traceability
- 💸 Financial Access: Satellite-based verification supports crop loan and insurance underwriting: Farmonaut Crop Loan & Insurance
- 🌳 Environmental Management: Calculate and document carbon impact via Farmonaut Carbon Footprinting
For large-scale farm management and crop plantation advisory: Large Farm Management App | Mobile/Web App.
For API integration: Farmonaut API | Developer Docs
FAQ: Farm Strategy and Profitability
Is farming profitable?
At the sector level, yes: USDA ERS forecasts $158.4 billion in US net farm income for 2026 against $492.8 billion in total production expenses. Individual profitability depends on scale, crop mix, and how effectively a given operation manages the five strategy levers covered above — sector averages don’t guarantee any single farm’s margin.
What is a farm strategy?
A farm strategy is the repeatable set of decisions covering diversification, technology adoption, sustainability practices, market access, and financial management that determines net income relative to peers. It is distinct from a single season’s planting plan — a strategy holds across years even as prices and yields shift.
What is the advantage of mixed farming?
Mixed crop-livestock systems let manure offset purchased fertilizer and crop residue offset purchased feed, which matters more as fertilizer costs rise (up 15.3% year-over-year into 2026, per USDA ERS). Mixed systems also stagger cash flow across the calendar year rather than concentrating it at one harvest.
What are good farming ideas for small land?
Vermiculture, specialty vegetables sold direct-to-market, small ruminants, and value-added processing all concentrate on per-acre value rather than total volume, since small acreage can’t compete with row-crop operations planting into the 95.3 million corn acres or 85.4 million soybean acres reported by USDA NASS for 2026.
How does technology change farm management strategy?
Precision technologies like guidance autosteering (70% adoption on large-scale crop farms, USDA ERS) and satellite monitoring reduce input waste and catch problems before yield loss. Only 27% of all US farms have adopted any precision ag practice, which means most of the productivity gap between average and top-quartile farms currently comes down to adoption, not access to a secret technique.
How can Farmonaut help my farm strategy?
Farmonaut provides satellite-based monitoring, AI-driven advisories, blockchain traceability, carbon footprinting, and crop loan/insurance verification — tools that lower the capital barrier to joining the precision-ag adoption curve described above.







Further reading:
Conclusion: Building a Strategy That Outlasts a Season
The numbers that anchor this article — $158.4 billion in forecast US net farm income, $4.31/bushel corn, $11.20/bushel soybeans, 27% precision-ag adoption overall against 70% on large-scale farms — will all move. That’s not a weakness in the analysis; it’s the reason a farm strategy has to be a method, not a memorized set of figures. Check the USDA ERS farm sector income forecast quarterly, check USDA NASS agricultural prices monthly, and re-run the payback calculator above whenever your input costs or acreage change.
Whether your priority is diversification, precision technology adoption, sustainable practice, market access, or financial risk management, the durable part of the strategy is the checklist itself — re-price against current data, re-test technology payback against your own acreage, and re-check adoption benchmarks against the current USDA release rather than the figures cited here.

 Esri North East Africa
 Farmer Amigo
 Cresol
 Atur Kuliner
 MDCV UK
 Zerella Group
 Etech Consulting Madagascar
 Vestlandsforsking
 Agritein
 Delicio
 WB Dev
 Sama Premium
 Prochecker
 Tres Valles
 LACOS Geoinformation
 Magrifly
 LatConnect 60
 Blickwinkel
 Agricultural Credit Policy Council
