

Crop economics · US value per acre
High-Yield Crops Ranked by Value per Acre in the US
In 2025, US strawberries brought in about $70,900 of crop value per bearing acre and raspberries about $28,900, against $782 per planted acre for corn (USDA NASS; USDA ERS). Gross value is not profit: the crops worth most per acre also cost the most to grow.
Key takeaways
- Strawberries led US fruit crops in 2025 at about $70,900 of value per bearing acre, followed by raspberries at about $28,900 (USDA NASS, May 2026).
- Corn grossed $782, soybeans $562 and wheat $280 per planted acre in 2025 (USDA ERS).
- ERS total costs listed for 2025 were above gross value for corn, soybeans and wheat at the national level.
- Saffron’s $100,000-per-acre figure is a University of Vermont high-tunnel trial estimate at a $19/g retail price, not a farm average.
- Find a buyer and build a budget before you plant; use the calculator to test your own margin.
In this article
- High-yield crops ranked by value per acre
- How we checked the numbers
- Why fruit beats grain on value but not always on profit
- Vegetables: high value, short seasons
- Niche crops: saffron, mushrooms and herbs
- Field crops still pay on scale
- How to choose a high-value crop for your farm
- Tools that protect yield on high-value acres
- Test your margin per acre
- FAQ
The high-yield crops with the most gross value per acre in the United States are fruits and berries, not grains. In 2025, strawberries brought in about $70,900 of crop value per bearing acre and raspberries about $28,900, against about $780 for corn (USDA NASS and USDA ERS, 2025 data). Gross value is not profit, though, and the crops worth the most per acre also cost the most to grow.
This guide ranks crops by value per acre using official USDA numbers, shows what field crops cost to grow, and explains how to judge a niche crop such as saffron. It ends with a calculator so you can test the margin on your own acres.
High-yield crops ranked by value per acre
We divided the 2025 value of utilized production by bearing acreage for each fruit crop in the USDA NASS Noncitrus Fruits and Nuts 2025 Summary (May 2026). The result is average crop value per acre at the farm-gate price. It is a national average, so good and bad farms are mixed together. The list below covers eight large crops. Some smaller crops grown mainly in California also beat peaches per acre in 2025: kiwifruit (about $21,700), nectarines (about $18,700), plums (about $17,500) and dates (about $16,500).
- Strawberries: about $70,900 per acre. 62,000 bearing acres produced $4.40 billion of fruit in 2025. Best for: growers near large fresh markets with skilled seasonal labor.
- Raspberries: about $28,900 per acre. 15,900 acres, $459 million. Best for: farms with tunnels or a cool, dry harvest season.
- Peaches: about $13,300 per acre. 70,800 acres, $941 million. Best for: orchards with frost protection and local or regional buyers.
- Cultivated blueberries: about $12,400 per acre. 104,700 acres, $1.30 billion. Best for: acidic soils and growers who can wait several years for full yield.
- Apples: about $9,500 per acre. 296,900 acres, $2.82 billion. Best for: established orchards with storage and packing access.
- Avocados: about $9,400 per acre. 53,840 acres, $508 million. Best for: frost-safe coastal areas with reliable irrigation water.
- Sweet cherries: about $7,700 per acre. 95,800 acres, $734 million. Best for: dry-summer regions with rain-cracking protection.
- Grapes: about $6,600 per acre. 883,000 acres, $5.83 billion. Best for: wine, table or raisin growers with a buyer contract.
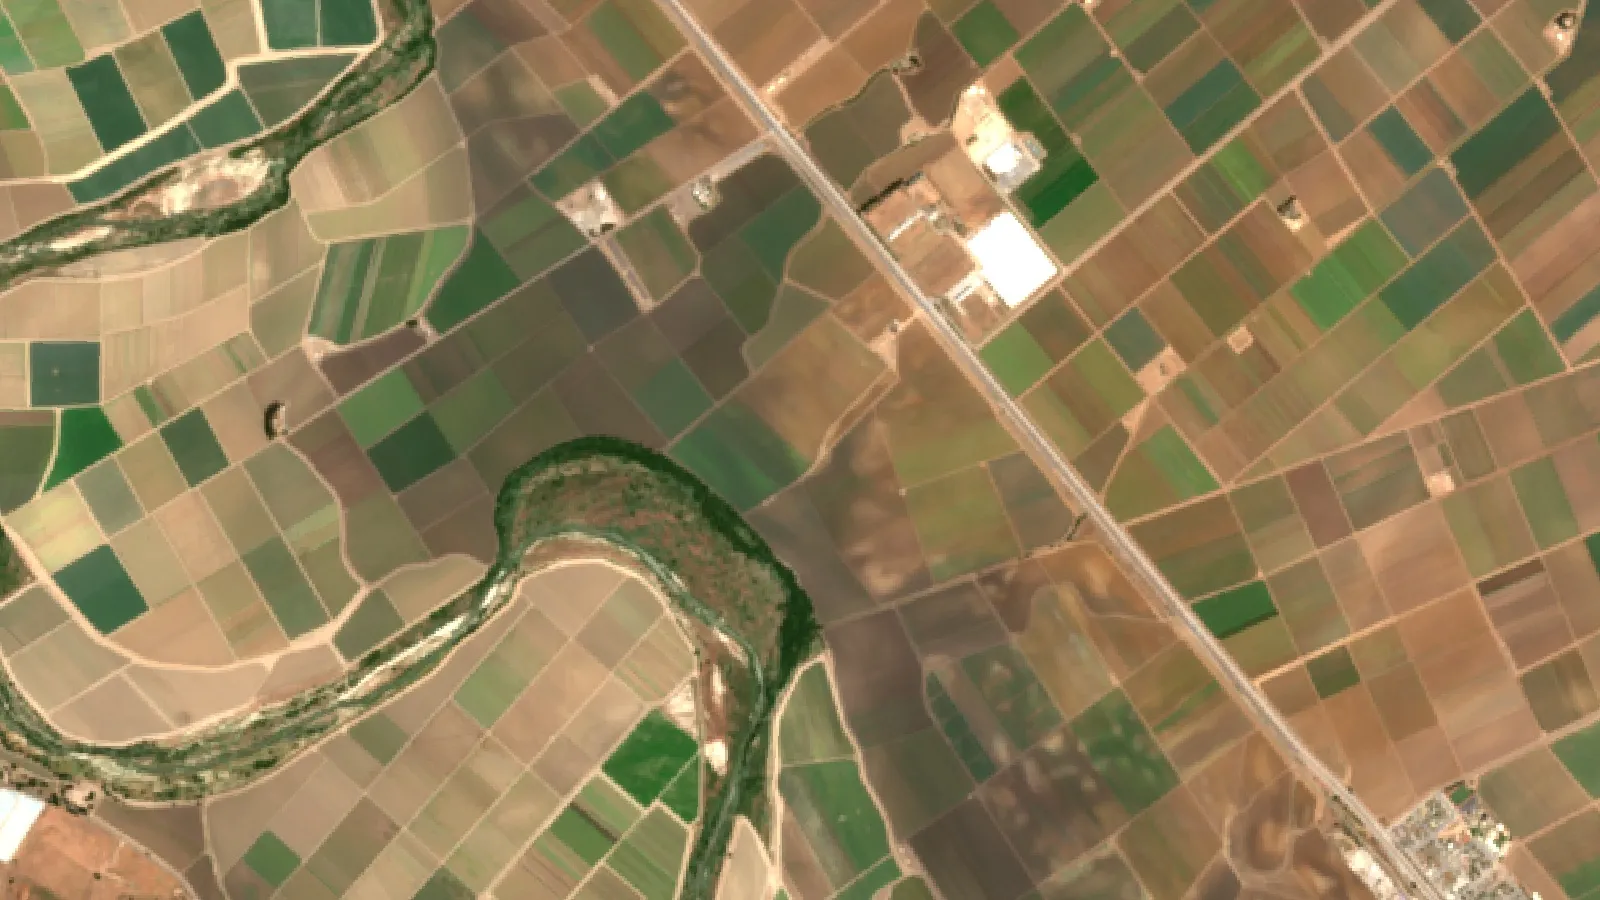
Strawberries, grapes and apples together made up 69% of the $19.0 billion noncitrus fruit value in 2025, according to the same NASS summary. That shows where the big markets are, but also where competition is strongest. In California, the state agriculture department lists lettuce and strawberries among the leading commodities of Monterey County, the area shown in the satellite image at the top of this page.
Chart
Value of production per bearing acre, US fruit crops
US$ per bearing acre, 2025, selected crops
How we checked the numbers
Every figure on this page comes from a public source with a date. Fruit values are NASS 2025 estimates of utilized production times the average price received by growers. Field-crop values and costs come from the USDA ERS Commodity Costs and Returns data, last updated in October 2026. The two sources use different bases: NASS divides by bearing acres, ERS by planted acres. Read the two sets side by side as a guide to scale, not as an exact match.
We removed claims from the older version of this page that no public source supported, such as fixed profit ranges for saffron, mushrooms and almonds. Where a figure is a trial result or an estimate, we say so.
Chart
Value per bearing acre, three berry crops
US$ per bearing acre, US, 2023 to 2025
Why fruit beats grain on value but not always on profit
Field crops cover far more land but return much less per acre. ERS puts the 2025 gross value of production at $782 per planted acre for corn, $562 for soybeans and $280 for wheat. In the same data, operating costs alone were $456, $251 and $163 per acre.
Chart
Operating cost vs gross value per planted acre
US$ per planted acre, US total, 2025
When ERS adds overhead, such as machinery capital, land rent value and unpaid family labor, the total costs listed in 2025 were $901 for corn, $661 for soybeans and $409 for wheat. Each of these is above the gross value for that year. The ERS cost-of-production forecast (June 2026) puts 2026 total costs listed at $957 for corn, $690 for soybeans and $433 for wheat per planted acre.
So a grain farm can show a cash margin over operating costs while still not covering the full cost of land, equipment and the owner’s time. Fruit crops face the same test at a larger scale. A strawberry acre that grosses tens of thousands of dollars also needs plants, plastic, fumigation or other soil care, irrigation and many hours of hand harvest.
What drives cost on high-value crops
- Labor. Berries and tree fruit are mostly picked by hand, so labor is a major cost.
- Establishment. Orchards and blueberries need several years before full yield, so the first years run at a loss.
- Structures. Tunnels and greenhouses raise yield and quality but add capital cost. USDA ERS notes that high costs for construction materials, labor and energy help explain why controlled-environment farming is less widespread in the United States.
- Market access. Fresh fruit must be cooled, packed and sold within days. A buyer or packer matters as much as the yield.
Vegetables: high value, short seasons
Vegetables sit between fruit and grain. The USDA NASS Vegetables 2024 Summary gives the value and harvested area for each crop. Dividing one by the other gives a rough value per harvested acre for 2024:
- Onions: $2.00 billion from 134,900 acres, about $14,800 per acre.
- Broccoli: $1.09 billion from 99,000 acres, about $11,000 per acre.
- Garlic: $214 million from 25,200 acres, about $8,500 per acre. NASS notes the crop value was 29% lower than the season before.
- Asparagus: $46.7 million from 11,700 acres, about $4,000 per acre, with California estimates discontinued from 2024.
The garlic drop is a reminder that value per acre moves with price from one season to the next. Asparagus also shows how a crop known as a premium vegetable can return less per acre than onions. National value per acre depends on yield and price, not on a crop’s premium image. Vegetables do have one advantage over orchards: most are annual, so you can change crops or acreage the next season if prices fall.
Niche crops: saffron, mushrooms and herbs
Many lists of profitable crops lead with saffron. The best public US data comes from small trials. The University of Vermont saffron project grew saffron in a high tunnel and measured 1.39 grams per square meter. At a Vermont organic retail price of $19 per gram, the team estimated saffron could generate $100,000 per acre, and about $4.03 net revenue per square foot.
That is a trial estimate at a retail price, not a farm average. Saffron is picked and cleaned by hand, flower by flower, and selling at retail means building your own customers. Start with a small bed, sell what you grow, and expand only when you have buyers.
Mushrooms are grown indoors, so value is usually measured per square foot of growing space rather than per acre of land. Medicinal and culinary herbs can earn premiums when certified organic, but markets are small and buyers often want proof of origin and testing. For any niche crop, find the buyer first and the acreage second.
▶ Ten small agriculture business ideas, including mushrooms, that start without a large farm. · 6:03
Field crops still pay on scale
Most US cropland stays in corn, soybeans and wheat for good reasons: mechanized harvest, deep markets, crop insurance and storage. Margins per acre are thin, so profit comes from scale, cost control and steady yield.
Rotation also matters. SARE notes that crop rotation can raise yields and spread labor and market risk compared with growing one crop year after year. A mixed farm can add a small block of a high-value crop without betting the whole farm on it.

▶ How a satellite farm advisory flagged a drop in a maize field’s expected yield. · 9:13
How to choose a high-value crop for your farm
- Check your climate and soil. Blueberries need acidic soil. Avocados need sites with no frost. Cherries crack in harvest rain. Use your extension service’s variety trials.
- Find a buyer. Talk to packers, processors, farmers markets or grocers before you plant. Ask what volume and quality they want.
- Build a budget. Use an extension enterprise budget for your state. List establishment, operating and overhead costs, and the years to full yield.
- Plan labor and water. Count peak harvest hours and confirm your water rights or well capacity.
- Start small and track results. Plant a trial block, record yield and costs, and compare blocks across seasons before you expand.
Tools that protect yield on high-value acres
The more an acre is worth, the more a missed problem costs. A few tools pay back best on these crops:
- Satellite and drone images. Vegetation indexes such as NDVI show where plants are growing more slowly than the rest of the field. They point you to the spot to scout; they do not name the pest or the cause.
- Soil and leaf tests. Lab tests guide fertilizer rates. Follow the product label and local rules for any fertilizer or crop protection product.
- Drip irrigation and soil moisture sensors. They help match water to crop demand on berries, orchards and vegetables.
- Records and traceability. Many fresh-market buyers ask for food safety and origin records.
- Fleet and labor planning. Harvest crews and machinery must be in the right block at the right time.
Farmonaut Satellite + AI Farm Monitoring System gives regular satellite crop health maps for each field, so you can compare blocks and see changes between visits. You can also read our guide to common agricultural tools and their uses.

▶ Tutorial: monitoring crops with satellite crop health maps in the Farmonaut web app. · 8:43
Test your margin per acre
Use the calculator to compare gross value with your own costs. Enter your expected yield, price and cost per acre. The example numbers are set close to break-even and are not benchmarks; replace them with your own figures or an extension budget for your crop.
Prices change every season. Use a dated price from your buyer or a recent USDA report, and say whether it is a contract price, a local cash bid or a retail price. For loans, tax or lease decisions, get advice from a farm business adviser.
Try the numbers for your own farm below.
Calculator
What margin does your crop leave per acre?
Enter your own yield, price and costs.
- Gross value per acre: $738
- Margin over operating costs per acre: $278
- Margin over all costs per acre: -$22
- Break-even price per unit: 4.22
Example values only, set near break-even; they are not benchmarks or forecasts. Overhead means land, machinery, interest and your own labor. Use an extension budget for your crop.
FAQ
What crop earns the most per acre in the US?
Among fruit crops in the USDA NASS 2025 summary, strawberries had the highest value of production per bearing acre, about $70,900. That is gross value. Strawberry costs per acre are also high, so net profit is much lower and varies by farm.
Are high-yield crops always more profitable?
No. A high yield or a high gross value can still lose money if labor, establishment or marketing costs are high. ERS data show 2025 total costs listed above gross value for corn, soybeans and wheat at the national level.
Is saffron really worth $100,000 an acre?
That figure is a University of Vermont estimate from a high-tunnel trial, using a retail price of $19 per gram. It is not a measured farm average. Hand labor and finding retail buyers are the main limits.
Which high-value crop is easiest for a small farm to start?
Crops with a short time to first harvest, such as strawberries, raspberries in tunnels, or culinary herbs, let you test a market in one or two seasons. Tree crops and blueberries take years to reach full yield.
How can satellite monitoring help a high-value crop?
Satellite images show which parts of a field are growing more slowly than others, so you can scout those spots first. They do not replace a field visit or a lab test.
Related pages on our site: crop monitoring overview, app access, large farm management, supply chain traceability, farm fleet management, farm carbon footprint, crop loans and insurance, weather API documentation, satellite data API.
Farmonaut crop monitoring
See your high-value blocks from space
Compare crop health across your fields with regular satellite maps.




Sources
- USDA NASS, Noncitrus Fruits and Nuts 2025 Summary (May 2026): release.nass.usda.gov
- USDA NASS, Vegetables 2024 Summary (2025): nass.usda.gov
- USDA NASS, Crop Values 2025 Summary (February 2026): release.nass.usda.gov
- USDA ERS, Commodity Costs and Returns (updated October 2026): ers.usda.gov
- USDA ERS, Corn costs and returns data (2025): ers.usda.gov
- USDA ERS, Soybean costs and returns data (2025): ers.usda.gov
- USDA ERS, Cost-of-production forecasts 2026F-2027F (June 2026): ers.usda.gov
- USDA ERS, EIB-264 on controlled environment agriculture and agrivoltaics: ers.usda.gov
- University of Vermont, North American Center for Saffron Research: uvm.edu
- SARE, Building Soils for Better Crops: Crop Rotations: sare.org
- CDFA, California Agricultural Statistics Review 2023-2024: cdfa.ca.gov
Discussion
Questions, corrections or field experience? Share them below. First-time comments are reviewed before they appear, and your email is never published.
No comments yet. Be the first to add a question or your experience.

 Vizexec Transformation
 GalaxEye Space
 Sun Palm Australia
 Grandstream Algérie
 XOS Realty
 Geospatial Lab Africa
 Agro La Gándara
 HIPSAC
 ZOL Zimbabwe
 Juligerm
 AdBio
 MISE Maroc
 NWNS
 Red August Group
 Farm Inc
 WeMe Global
 Agrotoken
 Blue BearX
 Insignito
 DnCubed

 Licence holder · Niger · Gold
 Licence holder · Nigeria · Gold + lithium
 Client · Somalia · Gold
 Client & affiliate partner · Ghana · Gold










