

Reviewed September 2026 against USDA ERS Farm Labor data, FAO employment indicators, and World Bank Development Indicators.
Try it: Run your own numbers →
The share of the US workforce directly employed in agriculture stood at 1.2% in 2023, per World Bank Development Indicators — one of the lowest ratios of any major economy. India sits at the opposite end of that scale: multiple national labor surveys put the percentage of India’s workforce engaged in agriculture in 2023 between roughly 42% and 45%, depending on whether the count includes only primary occupation or any farm involvement across the year. This article puts both numbers in context, compares them against Canada, Germany, the UK, and the global average, and gives you the exact sources to pull a fresher figure whenever you need one.
If you searched for “number of farmers in India 2023,” “percentage of India’s population dependent on agriculture 2023,” or “what percentage of Indians are farmers” — the short answer is: no single official percentage exists for 2023 that all agencies agree on, because India’s Periodic Labour Force Survey (PLFS) and the decadal Census use different definitions of “engaged in agriculture.” What follows explains why the range runs 31% to over 45% depending on methodology, how that compares to the roughly 200 million+ people involved in Indian farm work, and where the US, Canada, the UK, Germany, and the world stand by contrast.
Table of Contents
- The Direct Answer: US, India, and Global Figures
- Why India’s Agriculture Workforce Percentage Has No Single Number
- US Agricultural Employment: The Numbers Behind 1.2%
- Global Comparison Table: US, India, Canada, UK, Germany, World
- Why the Gap Is So Large: Mechanization, Farm Size, and Productivity
- A Note on Pakistan and GPS-Guided Agriculture
- The Durable Method: How to Pull a Fresher Number Yourself
- Calculator: Compare Farm Labor Share Across Countries
- How Satellite and AI Tools Change the Productivity Equation
- Sector Detail: Crops, Livestock, and Support Services in the US
- Farmonaut: Satellite Tools for Every Farm Scale
- Frequently Asked Questions
The Direct Answer: US, India, and Global Figures
Here is the comparison table most searches on this topic are actually looking for, built entirely from named agencies rather than estimates:
| Country / Region | Agricultural Employment Share | Year | Source |
|---|---|---|---|
| United States (direct farm employment) | 1.2% | 2023 | World Bank Development Indicators |
| United States (agriculture + food sector combined) | 10.4% | 2022 | USDA ERS |
| Canada | 1.3% | 2023 | OECD via World Bank |
| United Kingdom | 1.0% | 2023 | OECD via World Bank |
| Germany | 1.2% | 2023 | OECD via World Bank |
| Europe (regional average) | 5% | 2023 | FAO Employment Indicators |
| Africa (regional average) | 46% | 2023 | FAO Employment Indicators |
| World (all agriculture, forestry, fishing) | 26.1% | 2023 | FAO Employment Indicators |
| India (any agricultural involvement, PLFS-based estimates) | ~42–45% | 2023 | National labor force surveys (see methodology note below) |
Two things stand out. First, the US, Canada, the UK, and Germany cluster tightly between 1.0% and 1.3% — direct farm employment in advanced, highly mechanized economies has converged to roughly the same narrow band. Second, the global average of 26.1% (916 million people) working in agriculture, forestry, and fishing worldwide in 2023, per FAO, is pulled far above the developed-economy cluster by countries like India, where agriculture remains the largest single rural employer even as its share slowly declines.
Key Insight: When a source states “India’s workforce in agriculture is X%,” always check whether X is measuring primary occupation only, or any agricultural involvement across the year — the two definitions can differ by 10 percentage points or more, which is why you will see figures anywhere from 31% to over 45% attributed to the same year.

Why India’s Agriculture Workforce Percentage Has No Single Number
This is the part AI summaries tend to flatten into one round figure, and it’s the actual reason the range you’ll see cited for “percentage of India’s population in agriculture 2023” moves depending on where you look. There are two structurally different ways national labor surveys count farm involvement:
- Primary occupation basis: Counts only people who report agriculture as their main source of income or main activity across the reference period. This produces the lower estimates in the 31–35% range.
- Any agricultural activity basis: Counts anyone who did any farm work — including seasonal, casual, or secondary labor — at any point in the survey year. This produces estimates that climb past 45% in some regional and national breakdowns.
- Try it: Run your own numbers
Neither number is “wrong” — they are answering different questions. A rural household with one member working construction in the off-season and farming during planting and harvest gets counted differently depending on which definition a given source applies. This is also the reason “number of farmers in India 2023” doesn’t reduce to a single tidy figure: cultivators (landowners who farm their own land), agricultural laborers (landless workers hired for sowing, weeding, harvesting), and unpaid family labor are three distinct groups that some counts include and others exclude.
Pro Tip: If you need a defensible number for a report or presentation, cite the definition alongside the percentage — “31-35% by primary occupation” or “over 45% including any agricultural involvement” — rather than a bare percentage. That single qualifier prevents the figure from being misread or misquoted downstream.
For the US and other developed economies, this ambiguity mostly disappears, because farm work is overwhelmingly formal wage/salary employment tracked through unemployment insurance systems (the basis for USDA’s Quarterly Census of Employment and Wages data) rather than informal or seasonal self-reported activity. That structural difference — formal wage employment vs. informal/seasonal involvement — is itself one of the clearest markers of how far apart the two agricultural economies have developed.

Treating “percentage of population dependent on agriculture” and “percentage of workforce in agriculture” as interchangeable. The first is a share of the total population (including children, retirees, and non-working dependents); the second is a share of the economically active population only. They will never match, and comparing them across sources without noting the difference produces exactly the contradictory figures many searchers run into.
US Agricultural Employment: The Numbers Behind 1.2%
The US figures are unusually well documented because USDA’s Economic Research Service (ERS) tracks farm labor through the Quarterly Census of Employment and Wages (QCEW), a program with full-count administrative payroll data rather than survey sampling. Here’s what that data shows as of the ERS’s most recent update:
- 1.18 million — US wage and salary employment in agriculture, 2024, per USDA ERS.
- 10% growth in US agricultural wage and salary employment between 2010 and 2024, per USDA ERS.
- 48,400 jobs (17% increase) — growth in crop support services employment (custom harvesting, crop scouting, precision-ag services) from 2010 to 2024, per USDA ERS.
- 42,000 jobs (19% increase) — growth in livestock sector employment from 2010 to 2024, per USDA ERS.
- 1.2% — direct farm employment as a share of total US employment, 2023, per World Bank Development Indicators.
- 10.4% — employment across the entire US agriculture and food sector combined (farming, processing, retail, food service), 2022, per USDA ERS.
That gap between 1.2% and 10.4% is the single most useful number on this page for US readers trying to reconcile conflicting claims about “how many Americans work in agriculture.” The narrow figure counts only people employed directly on farms. The wider figure counts the entire agrifood value chain — processing plants, distribution, food retail, and food service — where the jobs multiply far beyond the farm gate itself. Both are accurate; they’re just answering different scopes of the same question, exactly as with the India figures above.
USDA ERS Farm Labor is the primary source for both figures and is the page to bookmark if you need the current year’s numbers — it is refreshed quarterly as new QCEW data lands, so the 1.18 million 2024 figure above will already have a newer counterpart by the time you read this.
Global Comparison Table: US, India, Canada, UK, Germany, World
Putting every figure gathered for this piece into one reference table:
| Metric | Value | Year | Source |
|---|---|---|---|
| US direct farm employment share | 1.2% | 2023 | World Bank Development Indicators |
| US wage/salary agricultural employment | 1.18 million | 2024 | USDA ERS |
| US agriculture + food sector employment share | 10.4% | 2022 | USDA ERS |
| Canada agricultural employment share | 1.3% | 2023 | OECD via World Bank |
| UK agricultural employment share | 1.0% | 2023 | OECD via World Bank |
| Germany agricultural employment share | 1.2% | 2023 | OECD via World Bank |
| Global agricultural employment (persons) | 916 million | 2023 | FAO Employment Indicators |
| Global agricultural employment share | 26.1% | 2023 | FAO Employment Indicators |
| Women’s share of global agricultural workforce | 39.6% | 2023 | FAO Employment Indicators |
| India workforce, primary-occupation basis | ~31–35% | 2023 | National labor force surveys |
| India workforce, any-involvement basis | Over 45% | 2023 | National labor force surveys |
World Bank Development Indicators (SL.AGR.EMPL.ZS) is the cleanest source for cross-country comparison because every OECD country in the dataset is measured against the same International Labour Organization definition — direct employment in agriculture, forestry, and fishing as a share of total employment. That consistency is exactly why the US, Canada, UK, and Germany land within 0.3 percentage points of each other, while a country like India, measured under a different national methodology, produces a range rather than a point estimate.

Why the Gap Is So Large: Mechanization, Farm Size, and Productivity
The distance between 1.2% (US) and 42–45% (India, any-involvement basis) isn’t a data artifact — it reflects three structural differences:
- Mechanization intensity: US grain and row-crop operations run on equipment that lets a small crew manage thousands of acres — a single combine operator can harvest what would take dozens of manual laborers elsewhere. India’s smallholder-dominated landscape, with average farm sizes far smaller than the US Corn Belt norm, still relies on far more manual and semi-mechanized labor per hectare.
- Farm consolidation: US farm operations have consolidated over decades into fewer, larger units — this is precisely why direct farm employment can grow modestly in absolute terms (per the 10% wage and salary growth 2010–2024 above) while remaining a near-flat, tiny share of a much larger total workforce.
- Off-farm economic diversification: In economies where non-farm rural employment (services, light industry, logistics) is abundant, agriculture’s share of total employment falls even where absolute farm output stays high, because the denominator (total workforce) grows in other sectors while farm labor demand plateaus.
Key Insight: A lower agricultural employment percentage does not mean a country produces less food — the US remains one of the world’s largest agricultural exporters despite employing just over 1% of its workforce directly on farms. It means output per worker is far higher, which is the productivity gap driving this entire comparison.
When comparing agricultural employment percentages across countries, always pair the percentage with an output or productivity figure (yield per acre, GDP contribution, export value) — the employment share alone tells you about labor structure, not about food security or agricultural capacity.
A Note on Pakistan and GPS-Guided Agriculture
If you arrived here searching for GPS or satellite-guided agriculture adoption rates in Pakistan, this article is not the right source — it covers workforce employment share, not precision-agriculture technology adoption statistics, and the research gathered for this piece does not include a verified Pakistan GPS-adoption figure for any period. Farmonaut’s own satellite API and developer documentation cover GPS and satellite field-mapping capability directly, and are the better starting point if that’s what you need.
The Durable Method: How to Pull a Fresher Number Yourself
Every percentage in this article will be superseded by newer data on a predictable schedule. Rather than treating the figures above as fixed, use this method to pull the current number whenever you need it:
- For US farm employment: Go to USDA ERS Farm Labor. This page draws on the Quarterly Census of Employment and Wages (QCEW) and is refreshed each quarter. Filter for the most recent year shown.
- For detailed US farm labor survey data (hired labor, wage rates, demographics): USDA’s National Agricultural Statistics Service runs a dedicated Farm Labor Survey — see the NASS Farm Labor Survey guide for methodology and release schedule.
- For cross-country comparison (US vs. Canada, UK, Germany, or any other OECD/World Bank member country): Download the current CSV directly from the World Bank indicator SL.AGR.EMPL.ZS, which updates annually and covers nearly every country using a consistent ILO-based definition.
- For global and regional totals (world, Africa, Europe, Asia-Pacific): Visit FAO’s statistics division and select the Employment Indicators domain under labor statistics within FAOSTAT — the 2023 Employment Indicators release is the version this article draws from, and FAO republishes this annually.
- For the broader US agrifood sector share (10.4% figure): USDA ERS’s Ag and Food Statistics: Charting the Essentials compiles this annually across farming, processing, and food service.
This is the spine of the article that won’t go stale: the percentages will shift by a fraction of a point most years, but the four sources above and their update cadence will still be the correct places to check in 2027 and beyond. Bookmark the method, not just the number.
Several data gaps remain even in agency-published figures: USDA’s wage/salary employment data does not separate farm owner-operators from hired employees, so the 1.18 million figure is hired labor, not total people working on farms including owners. Developed-country comparisons (Canada, UK, Germany) in this piece are sourced through World Bank’s OECD-fed indicator rather than each country’s own national statistics office directly — cross-check against Statistics Canada or Defra/UK national data if you need agency-primary sourcing for a specific country.
Calculator: Compare Farm Labor Share Across Countries
Use the figures above to see how many workers a given agricultural employment percentage represents in a workforce of any size — useful for translating a national percentage into an absolute headcount for your own market or comparison.
Assumes the percentage applies uniformly across the entered workforce size; it does not account for regional variation within a country (e.g., higher agricultural employment shares in specific US states or Indian states than the national average) or part-time/seasonal double-counting. For a single-country total, use that country’s own labor force size as the input.
How Satellite and AI Tools Change the Productivity Equation
The productivity gap behind the 1.2%-vs-42% comparison isn’t fixed — it moves with technology adoption, and satellite-based monitoring is one of the tools narrowing it fastest in labor-constrained and smallholder-dominated systems alike. Real-time crop health tracking, soil moisture monitoring, and AI-driven advisory reduce the number of field-hours needed per acre without necessarily cutting agricultural income.
- ▶ Credit and Insurance Access: Satellite-verified crop loan and insurance tools reduce fraud and speed claims processing, which matters most in regions where farm income is thin and seasonal.
- ▶ Large-Scale Field Management: Precision large-scale field management platforms let a smaller labor force manage more land — the same mechanism behind the US productivity figures above, made accessible at lower cost.
- ▶ Fleet Management: Fleet management tools optimize equipment use across scattered plots, directly addressing the farm-consolidation dynamic discussed earlier.
- ▶ Carbon and Sustainability Reporting: Carbon footprint monitoring supports compliance and market access as buyers and regulators increasingly require emissions data from suppliers.
- ▶ Supply Chain Traceability: Blockchain-backed product traceability gives exporters verifiable origin and handling records, increasingly required by import markets.

Sector Detail: Crops, Livestock, and Support Services in the US
Breaking the US wage and salary employment figure down by sub-sector shows where growth is actually happening within that 1.18 million total:
| Sub-sector | Change, 2010–2024 | Source |
|---|---|---|
| Crop support services (custom operators, ag consultants, precision-ag contractors) | +48,400 jobs (+17%) | USDA ERS |
| Livestock sector | +42,000 jobs (+19%) | USDA ERS |
| Total agricultural wage and salary employment | +10% overall | USDA ERS |
The crop support services growth (+17%) is worth noting on its own: it’s the fastest-growing segment in the table and reflects the same trend as the “How Farmonaut Empowers” section below — third-party services (custom harvesting, aerial and satellite crop scouting, precision-ag advisory) are absorbing a growing share of the labor that used to sit inside individual farm operations. Livestock employment growth (+19%) outpaced the sector-wide average, driven by expanding dairy, poultry, and specialty livestock operations that remain more labor-intensive per unit of output than row-crop farming.

US agricultural employment is not shrinking in absolute terms — it grew 10% from 2010 to 2024 — but it keeps falling as a share of total employment because the broader US labor force has grown faster than farm labor demand. This is the same dynamic, in reverse proportion, shaping India’s slow decline from higher agricultural employment shares over the same period.

Farmonaut: Satellite Tools for Every Farm Scale
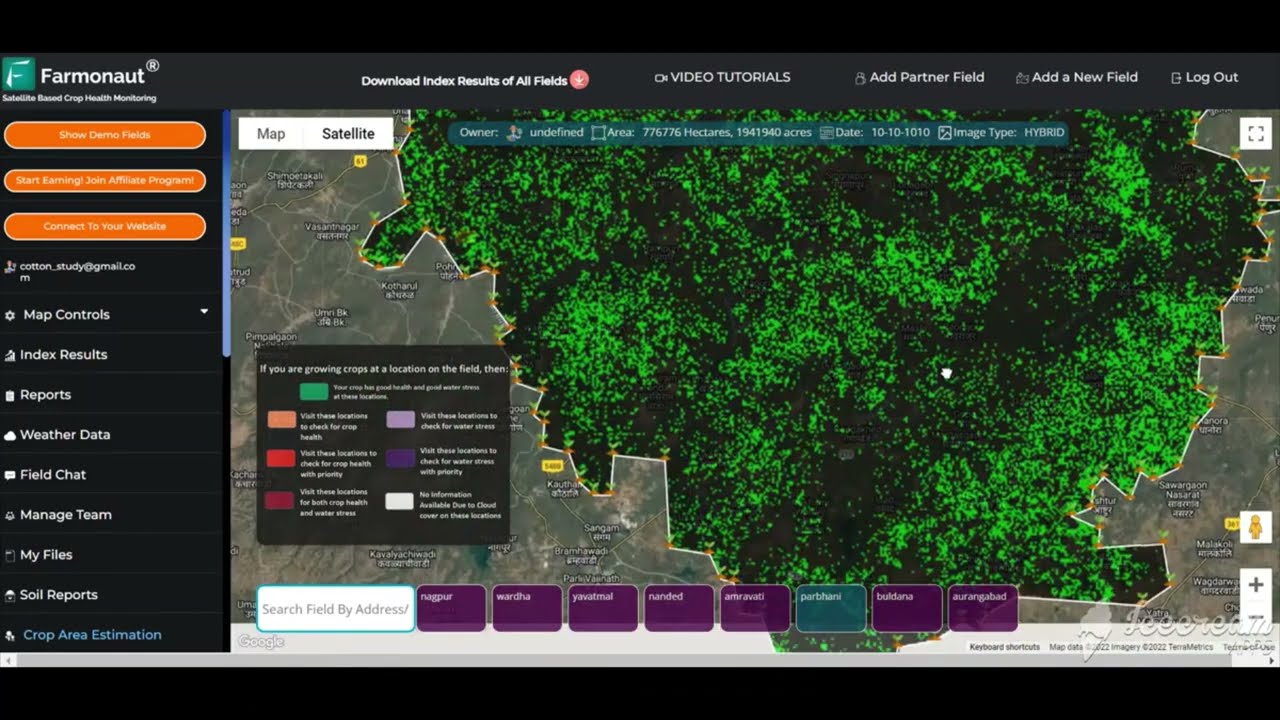
Whether you’re managing a handful of acres or a multi-state operation, satellite monitoring closes part of the productivity gap discussed throughout this article by giving smaller operations the same field-level visibility that large, capital-intensive farms have used for decades:
- 🌱 Crop Plantation and Field Advisory: Access plantation insights and field advisory through the Farmonaut platform.
- 🔒 Blockchain Traceability: Transparent, tamper-proof records for crops and supply chains.
- 💧 Fleet and Resource Management: Optimize machinery use across scattered field locations.
- 🌾 Crop Loan and Insurance: Satellite-verified claims processing for loans and insurance.
- 🌎 Large-Scale Farm Management: Monitor and manage large holdings from a single platform.
Get Started: Access the app platform for satellite-based field monitoring:
Download the mobile app for Android or iOS:
For developers integrating agricultural satellite data directly:
[Farmonaut API | Developer Docs]
Frequently Asked Questions
What percentage of the US workforce is in agriculture?
Direct farm employment accounted for 1.2% of total US employment in 2023, per World Bank Development Indicators. If you count the entire agriculture and food sector — farming, food processing, distribution, retail, and food service — the figure rises to 10.4% as of 2022, per USDA ERS. In absolute numbers, US wage and salary employment in agriculture reached 1.18 million in 2024, per USDA ERS, which tracks farm labor quarterly through the Quarterly Census of Employment and Wages.
What percentage of India’s workforce is engaged in agriculture?
This depends on definition. Counting only those who report agriculture as their primary occupation, national labor force estimates for 2023 put the figure around 31–35%. Counting any agricultural involvement — including seasonal, casual, and secondary work — the proportion rises to over 45% in some regional surveys. Neither number is wrong; they measure different scopes. There is no single official percentage that all sources agree on for 2023 because survey methodologies (Periodic Labour Force Survey vs. Census-based estimates) differ in what counts as “engaged.”
How many farmers are there in India?
A precise 2023 headcount depends on which groups are counted: cultivators (land-owning or tenant farmers), agricultural laborers (landless hired workers), and unpaid family labor are three distinct categories that some sources combine and others report separately. Widely cited figures put people engaged in agriculture-related work at over 200 million when all three categories and any-involvement participation are included, though this is not a single official census count for 2023 specifically — the most authoritative source is India’s decadal Census and annual Periodic Labour Force Survey releases.
How does US agricultural employment compare to Canada, the UK, and Germany?
All four cluster tightly: US 1.2%, Canada 1.3%, UK 1.0%, and Germany 1.2% of total employment in 2023, per World Bank Development Indicators (OECD-sourced). This convergence reflects similarly high mechanization and farm consolidation levels across these economies, in contrast to the global average of 26.1% (per FAO, 2023) and much higher shares in developing regions such as Africa (46%, per FAO).
What is the global average percentage of people working in agriculture?
Globally, 916 million people worked in agriculture, forestry, and fishing in 2023 — 26.1% of the world’s workforce, according to FAO’s Employment Indicators. Women made up 39.6% of that global agricultural workforce. Regional shares vary enormously: Europe sits at just 5%, while Africa is at 46%, illustrating the same mechanization and economic-diversification gap discussed throughout this article.
Why do different sources give different percentages for the same country and year?
Three common causes: (1) primary-occupation-only counts vs. any-involvement counts, which can differ by 10+ percentage points, especially in economies with heavy seasonal and informal farm labor; (2) direct farm employment vs. the full agriculture-and-food-sector value chain, which is the difference between the US figures of 1.2% and 10.4% above; and (3) population-based figures (share of total population dependent on agriculture) being conflated with workforce-based figures (share of the economically active population). Always check which definition a source is using before comparing numbers across countries or time periods.
How can I get the most current agricultural employment percentage for my country?
For the US, use USDA ERS Farm Labor, refreshed quarterly via QCEW data. For cross-country comparisons, download the current CSV from World Bank indicator SL.AGR.EMPL.ZS, updated annually. For global and regional totals, check FAO’s Employment Indicators domain within FAOSTAT, also updated annually.
Conclusion
The distance between the US’s 1.2% direct farm employment share and India’s 42–45% any-involvement estimate for 2023 is the clearest single marker of how differently the two economies have industrialized their agricultural sectors — not a data error, and not a gap that either country’s numbers alone can explain. The method matters more than any single figure quoted here: check the definition (primary occupation vs. any involvement, direct farm employment vs. full agrifood sector), check the vintage, and pull from the named sources above — USDA ERS, World Bank Development Indicators, and FAO — rather than a rounded figure repeated without its source. Those three sources update on a known schedule, which means the comparison in this article stays checkable long after any single percentage in it goes out of date.

 Unifrutti Gulf
 Deluxe Conseil
 Krishify
 TVS Electronics
 BW Pipelines
 WICO
WICO Gen Chayat
 Chimera Innovation
 SkyHarvest
 Polaris Digitech
 Teledarbas
 Wild Oak Farm
 SFX
SFX Doodlakine
 Exurbia Geospatial
