

Gold and silver output · Data guide
US Gold Production in Metric Tons, Plus Canada and Silver
US mines produced an estimated 160 metric tons of gold in 2025 (USGS). Here are the US, Canada and world gold figures, silver by country, and a tons-to-ounces calculator.
Key takeaways
- US gold mine production was an estimated 160 metric tons in 2025, down from 187 tons in 2021 (USGS, 2026 edition).
- Nevada gave about 64% of US gold and Alaska about 22%; Nevada Gold Mines alone produced about 80 tons in 2025 on a 100% basis (USGS; Barrick).
- Canada produced about 200 tonnes in 2024, 40% of it in Ontario (Natural Resources Canada).
- World mine output was about 3,300 tons of gold and 26,000 tons of silver in 2025 (USGS estimates); Mexico leads silver with 6,300 tons.
- One metric ton is about 32,151 troy ounces, so 160 tons is roughly 5.1 million ounces.
In this article
- How many metric tons of gold does the US produce?
- US gold mine production by year, in metric tons
- Where US gold is mined: Nevada, Alaska and the largest operations
- From ore to bar: how mined tons become refined gold
- Canada gold production in tonnes, by province
- Gold production by country: where the US and Canada rank
- Silver mine production in metric tons, by country
- Gold and silver together: the by-product link
- How we chose and checked these figures
- Convert tons to ounces and dollars
- Why production figures differ between sources
- What production data means for explorers
- Frequently asked questions
How many metric tons of gold does the US produce?
US mines produced an estimated 160 metric tons of gold in 2025, down from 163 tons in 2024 and 187 tons in 2021, according to the USGS Mineral Commodity Summaries (2026 edition). One metric ton (also written tonne) is 1,000 kilograms, or about 32,151 troy ounces, so 160 tons is roughly 5.1 million ounces. USGS put the value of that gold at about US$17 billion, a 32% rise on 2024 that came from price, not volume.
Canada produced about 200 tonnes in 2024, according to Natural Resources Canada, and USGS shows 200 tons again for 2025. World silver mine output was about 26,000 tons in 2025 (USGS estimate), roughly eight times the weight of world gold output, which was 3,300 tons.
For scale, the World Gold Council reports total gold demand, including over-the-counter trading, topped 5,000 tons in 2025 (Gold Demand Trends, Q4 and full year 2025, 29 January 2026), well above the 3,300 tons mined. Recycled gold and other supply fill the gap.
This page sets out the US series year by year, the states and operators behind it, the Canadian split by province, a ranked table of gold producers, silver by country, and a calculator that turns tons into ounces and dollars. Every figure carries its source and year. USGS 2025 values are estimates and can be revised.
US gold mine production by year, in metric tons
The USGS salient statistics below use mine production (gold in ore and concentrate that leaves US mines), which is a different measure from refinery output. Refineries also process imported doré (rough gold-silver bars) and recycled scrap, so refinery numbers can sit above or below mine numbers.
Chart
US gold mine production, 2021 to 2025
Metric tons per year; 2025 is an estimate
| Year | Mine production (tons) | Primary refinery (tons) | Secondary refinery, scrap (tons) | Average price (US$ per troy oz) |
|---|---|---|---|---|
| 2021 | 187 | 181 | 92 | 1,801 |
| 2022 | 173 | 181 | 93 | 1,802 |
| 2023 | 170 | 177 | 96 | 1,945 |
| 2024 | 163 | 180 | 89 | 2,388 |
| 2025 (estimate) | 160 | 170 | 90 | 3,300 |
Source: USGS, Mineral Commodity Summaries, gold chapter, salient statistics (2026 edition). Prices are USGS annual averages, not today’s price.
Two things stand out. Mine output fell by about 14% between 2021 and 2025 (187 to 160 tons), while the average price rose by 83% (US$1,801 to US$3,300 per troy ounce, same table). Higher prices raised the value of the gold mined, but the tonnage did not rise over these years. USGS also notes employment at mines and mills of about 13,000 people in 2025 and 12 states with producing lode mines.
Note for readers who saw the figure of 170 tons for 2022 elsewhere: the current USGS table shows 173 tons for that year. USGS revises earlier years as company reports arrive, which is one reason to check the edition date on any production number.
Where US gold is mined: Nevada, Alaska and the largest operations
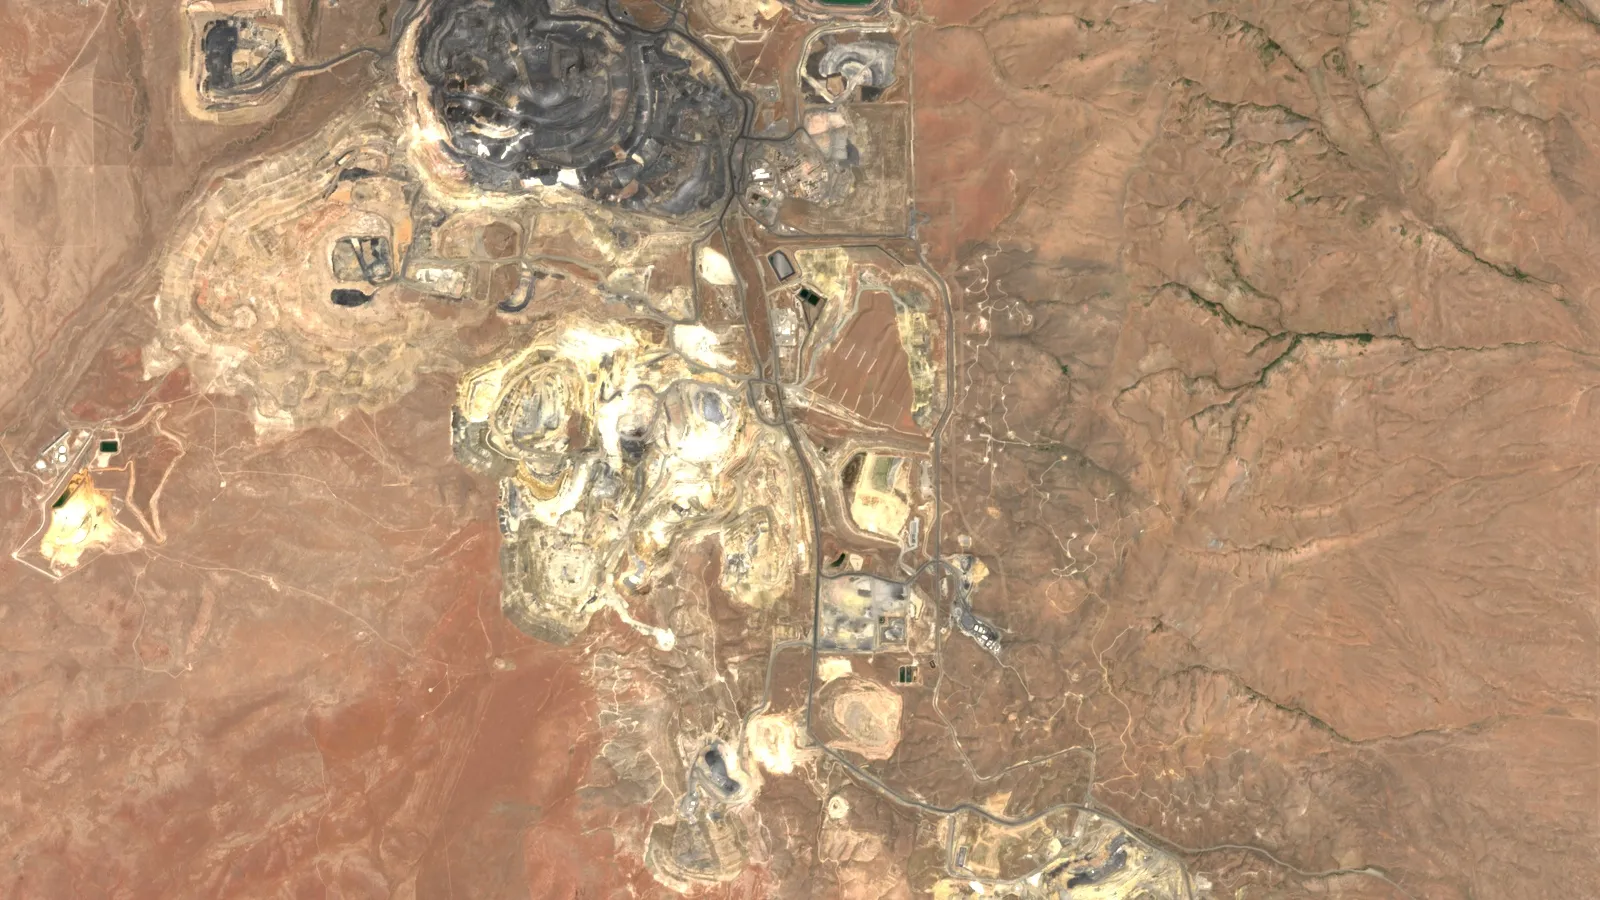
USGS says gold came from more than 40 lode mines in 12 states in 2025, plus several large placer mines in Alaska and many small placer operations in Alaska and the western states. A lode mine works hard-rock veins or disseminated ore; a placer mine recovers gold from loose gravel. Nevada produced about 64% of the national total and Alaska about 22%. By-product gold from base-metal ore, mostly copper, made up about 7%. The top 25 operations produced about 94% of US mined gold.
Applied to 160 tons, those shares work out to roughly 100 tons from Nevada, 35 tons from Alaska and 11 tons as by-product (our arithmetic on the USGS percentages, rounded).
The biggest single block of Nevada output is Nevada Gold Mines, the joint venture around the Carlin Trend and Cortez district. Barrick’s Q4 2025 mine statistics list Barrick’s interest at 61.5% (Newmont holds the other 38.5%) and report 2.59 million ounces of gold produced on a 100% basis in 2025, with 1.59 million ounces attributable to Barrick. In tons (2,587,000 oz x 31.1035 g per oz, our conversion) that is about 80 tons for the whole venture, close to half of the national estimate. The 2024 figure on the same basis was 2.68 million ounces, about 83 tons.
| Nevada Gold Mines complex | 2025 gold, 100% basis (000 oz) | Approx. metric tons |
|---|---|---|
| Carlin | 1,116 | 34.7 |
| Cortez | 739 | 23.0 |
| Turquoise Ridge | 555 | 17.3 |
| Phoenix | 177 | 5.5 |
| Venture total | 2,587 | 80.5 |
Source: Barrick, Q4 2025 mine statistics, twelve months ended 31 December 2025; tons are our conversion. Barrick reports its own 61.5% share separately.
Reading company reports against USGS needs care. A company reports ounces, often on an attributable basis (its ownership share), while USGS reports tons for the whole mine. Mixing the two double counts or undercounts.
From ore to bar: how mined tons become refined gold
Mine production counts the gold contained in what leaves the mine, usually as doré (a rough gold and silver alloy) or concentrate. Refining then removes the silver and other metals to reach commercial-grade bars. That is why USGS counts about 16 US refineries for commercial-grade gold and reports mine and refinery tons separately. In 2025, USGS also lists US Treasury gold stocks of 8,130 tons, held at the official price of US$42.22 per troy ounce. That stock is more than 50 times one year of US mine output, but it is not production and is not counted in the tables above.

▶ Farmonaut video: how gold is mined and refined, from rock to ring. · 5:27
Canada gold production in tonnes, by province
Natural Resources Canada reports Canadian mines produced about 200 tonnes of gold in 2024, up 5% on 2023, which made Canada the fourth-largest producer behind China, Russia and Australia with 6.1% of world output. Four provinces and territories supplied most of it.
Chart
Canada gold output by province, 2024
Metric tonnes; preliminary
| Province or territory | 2024 gold (tonnes) | Share of Canada |
|---|---|---|
| Ontario | 79.9 | 40% |
| Quebec | 55.5 | 28% |
| British Columbia | 17.6 | 9% |
| Yukon | 6.0 | 3% |
| All others combined | 41.1 | 21% |
Source: Natural Resources Canada, Gold Facts (2024 data). Figures are preliminary and may be revised.
Ontario and Quebec sit on the old greenstone belts of the Canadian Shield, where most of Canada’s large gold camps are found. Our Abitibi greenstone belt guide covers how faults control gold there.
A single company can also hold a large share of that total. Agnico Eagle reported payable gold production of 3,447,367 ounces in 2025 (fourth-quarter 2025 results), about 107 tons. That figure covers all of its mines across Canada, Finland, Australia and Mexico, so it cannot be compared directly with the Canadian total. For spending on finding the next mines, see Canadian mineral exploration spending.
Canadian producers also supply the US. USGS lists Canada as the source of 46% of US bullion imports and 99% of ore and concentrate imports (2021 to 2024 import sources), so the two national totals are linked through trade as well as geology.
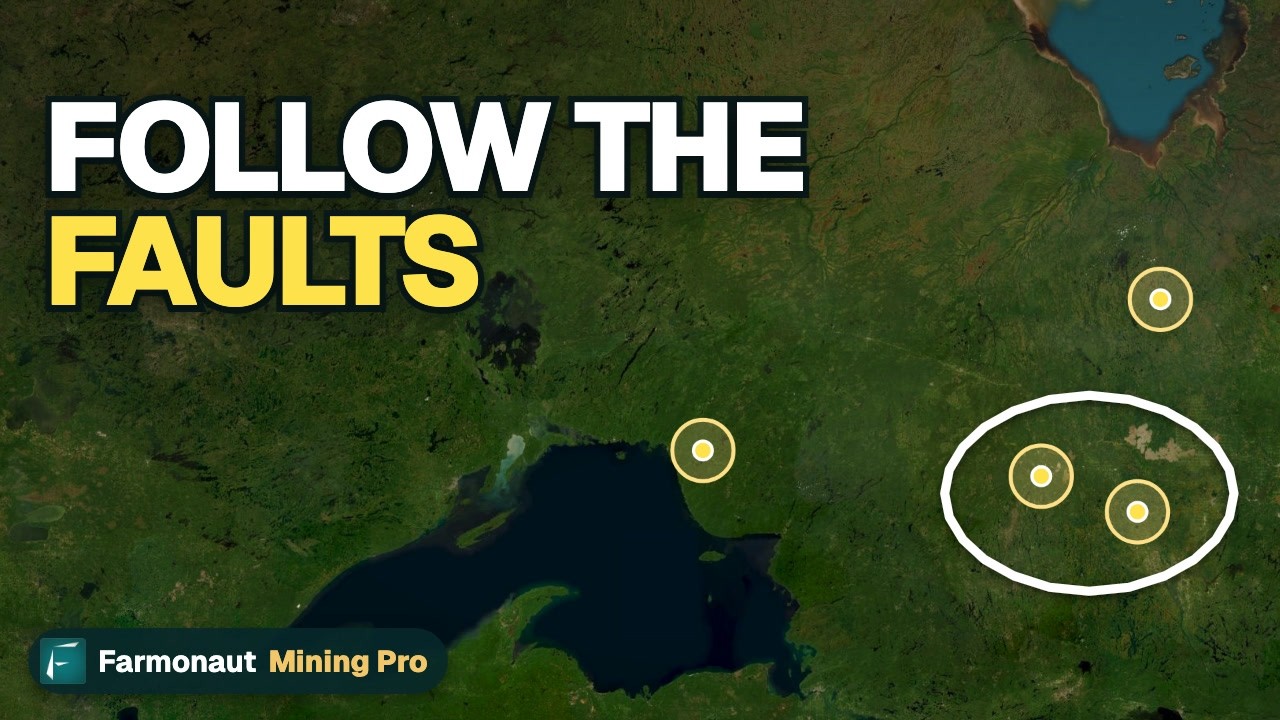
▶ Farmonaut video: Ontario makes about 40% of Canada’s gold. · 2:53
Gold production by country: where the US and Canada rank
World mine output was an estimated 3,300 tons in 2025 (3,280 tons in 2024). USGS says China, Russia, Australia, Canada and the United States were the leading producers, together about 41% of the total. The table lists every country USGS names individually, ranked by 2025 estimated production. Countries not named are grouped as “other countries”, which together produced about 1,000 tons.
Chart
Leading gold producers, 2025 estimate
Mine production, metric tons; eight of the 13 countries USGS names
| Rank | Country | 2024 (tons) | 2025 estimate (tons) |
|---|---|---|---|
| 1 | China | 377 | 380 |
| 2 | Russia | 310 | 310 |
| 3 | Australia | 284 | 280 |
| 4 | Canada | 200 | 200 |
| 5 | United States | 163 | 160 |
| 6 | Ghana | 149 | 150 |
| 7 | Mexico | 140 | 140 |
| 8 (tie) | Kazakhstan | 130 | 130 |
| 8 (tie) | Uzbekistan | 129 | 130 |
| 10 | Peru | 108 | 110 |
| 11 (tie) | Indonesia | 94 | 90 |
| 11 (tie) | South Africa | 90 | 90 |
| 13 | Brazil | 82 | 80 |
Source: USGS, Mineral Commodity Summaries, gold chapter, world mine production (2026 edition). Rank is by the 2025 estimate; USGS rounds values, so ties and small gaps are within rounding. Ghana is only 10 tons behind the United States in this table.
The US holds about 3,000 tons of the 66,000 tons of world gold reserves that USGS lists, around 4.5%. Reserves are the part of a resource that can be mined profitably at current prices, so the number moves with price, costs and company reporting.
Silver mine production in metric tons, by country
USGS estimates world silver mine production at 26,000 tons in 2025, up from 25,300 tons in 2024. USGS puts world silver mine production at 25,300 tons for 2024 and 26,000 tons for 2025. The first eight countries below each mined more than 1,000 tons in 2025; Australia is listed because it mined exactly 1,000 tons.
Chart
Silver mine production, 2025 estimate
Metric tons; countries above 1,000 t
| Country | 2024 (tons) | 2025 estimate (tons) | Share of world, 2025 |
|---|---|---|---|
| Mexico | 5,780 | 6,300 | 24% |
| Peru | 3,510 | 3,600 | 14% |
| China | 3,430 | 3,400 | 13% |
| Bolivia | 1,490 | 1,500 | 6% |
| Chile | 1,200 | 1,400 | 5% |
| Poland | 1,320 | 1,300 | 5% |
| Russia | 1,280 | 1,200 | 5% |
| United States | 1,050 | 1,100 | 4% |
| Australia | 1,050 | 1,000 | 4% |
Source: USGS, Mineral Commodity Summaries, silver chapter, world mine production (2026 edition). Shares are our calculation from the USGS table.
The Silver Institute uses ounces and its own survey method. It forecasts 2026 mine production of 820 million ounces (about 25,500 tons), up 1%, and says primary silver mines, those that exist mainly for silver, supply 28% of mine output in 2026. Its separate supply and demand data put 2024 mine production at 819.7 million ounces, about 25,500 tons, which is close to the USGS figure of 25,300 tons for the same year.
The rest of the silver comes as a by-product. USGS says silver is mostly recovered from lead-zinc, copper and gold mines, in that order. In the US, it reports about 1,100 tons in 2025 from 4 silver mines and 31 base- and precious-metal operations, with Alaska the leading silver-producing state, followed by Nevada. A US silver price of about US$38 per troy ounce (USGS 2025 average estimate) put the value of US mine output at about US$1.4 billion.
Silver demand explains why the tonnage matters outside mining. In USGS’s breakdown of US uses in 2025, electrical and electronics took 25%, other industrial uses and photography 19%, net physical investment 18%, photovoltaics 15%, coins and medals 14%, jewelry and silverware 6%, and brazing and solder 3%.
Gold and silver together: the by-product link
Gold and silver are mined together more often than the two production tables suggest. USGS says most recent silver discoveries are associated with gold occurrences, and that copper and lead-zinc mines that carry silver will keep supplying a large share of reserves. For gold, about 7% of US output came as a by-product of base-metal ore, mostly copper, in 2025. The practical result is that a copper mine, a gold mine and a silver mine can report the same ounces under different headings.
It also means supply reacts slowly to price. A silver price rise does not bring more silver from a lead-zinc mine if the mine is run for lead and zinc. A gold price rise does lift gold output from marginal gold deposits, but only after a delay for studies, permits and construction. The Silver Institute notes that higher metal prices give producers healthier margins to spend on development, which supports output in later years.
How we chose and checked these figures
We used one national source for each commodity so the numbers are on one basis: USGS Mineral Commodity Summaries for the US and world tables, Natural Resources Canada for the Canadian provinces, the Silver Institute for an independent silver cross-check, and company filings (Barrick, Agnico Eagle) for mine-level detail. Every ton-to-ounce conversion uses 31.1035 grams per troy ounce and is marked as our conversion. We list every country that USGS names in the gold table and every country above 1,000 tons in the silver table, so no known qualifier is left out. Figures labelled 2025 are USGS estimates, and 2024 provincial figures are preliminary.
Convert tons to ounces and dollars
Production reports mix units. USGS gives metric tons for these tables; company reports use troy ounces; US trade data may use short tons (2,000 pounds). The factors are 1 metric ton = 32,150.7 troy ounces = 1.10231 short tons. As a check, 160 metric tons x 32,150.7 oz x US$3,300 (the USGS 2025 average estimate) comes to US$16.97 billion, matching the US$17 billion USGS reports for the US total. For a live price, the LBMA Gold Price is set twice daily in London auctions.
The calculator below converts any tonnage and prices it at a value you enter. Use the share box to size one state or one mine against a national total.
Calculator
How many ounces and dollars is your tonnage?
Enter a tonnage, a share and a price to convert.
- Value at your price (US$): $16,975,569,600
- Short tons: 176.4
- Kilograms: 160,000
Example values only. Conversion factors: 1 metric ton = 32,150.7 troy oz = 1.10231 short tons. The default price is the USGS 2025 average estimate for gold (US$3,300 per troy oz); enter today’s price from LBMA or Kitco instead.
For a closer look at a related question, see our guide: Mining and Metals Industry Trends: 8 Shifts With Data.
If this topic matters to you, read New Mexico Gold and Silver Production: Data by Year next.
Why production figures differ between sources
- Mine versus refinery output. Refineries take in imported doré and scrap, so refinery tons are not mine tons.
- Ownership share versus 100%. A company reporting 61.5% of a joint venture shows fewer ounces than the mine produced.
- Estimates and revisions. USGS values for the latest year are estimates; the 2022 US figure now reads 173 tons.
- Units. A metric ton is about 10% heavier than a short ton (1 metric ton = 1.10231 short tons), which is large enough to change a ranking.
- Contained versus payable. Some company figures are payable gold after smelter terms, not the full metal in the concentrate.
When you build a model, keep one source and one basis for all figures, and record the edition date.
What production data means for explorers
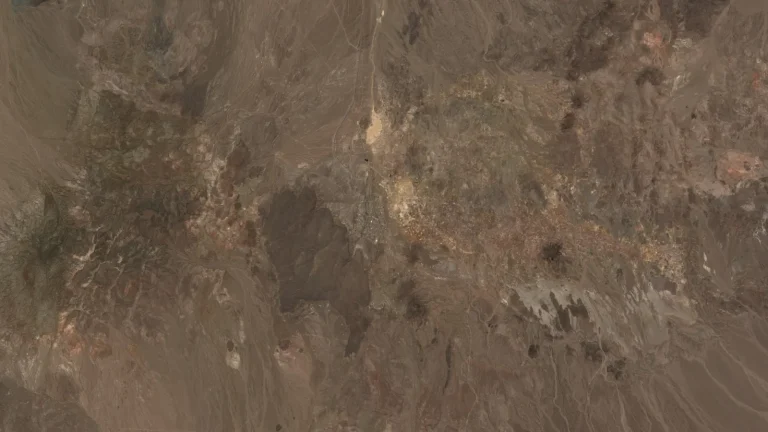
Production tables show where past exploration succeeded; they do not show where the next deposit is. Farmonaut offers satellite-based mineral detection, which screens a licence area from satellite imagery, takes KML, KMZ or polygon input, and is designed to cut early-exploration time from months to days and cost by up to 80-85%. Results are exploration targets, not a resource estimate. Read the satellite-based mineral detection page, send an area through the mining query form, or contact the team.

▶ Farmonaut video: how satellites help find gold through the rock around it. · 4:25
Frequently asked questions
How many metric tons of gold does the US produce each year?
USGS estimates 160 metric tons of mine production for 2025, 163 tons for 2024, 170 tons for 2023 and 173 tons for 2022. The series has declined from 187 tons in 2021.
Which US state produces the most gold?
Nevada, with about 64% of national output, followed by Alaska at about 22% (USGS, 2025). That is roughly 100 tons and 35 tons respectively, by our arithmetic.
How many tonnes of gold does Canada produce?
About 200 tonnes in 2024 according to Natural Resources Canada, with Ontario at 79.9 tonnes and Quebec at 55.5 tonnes. USGS also estimates 200 tons for 2025.
Which country mines the most gold?
China, at an estimated 380 tons in 2025, followed by Russia (310) and Australia (280), according to USGS. Canada is fourth and the United States fifth.
How many metric tons of silver are mined in the world?
USGS estimates 26,000 tons for 2025 and 25,300 tons for 2024. The Silver Institute reports 819.7 million ounces (about 25,500 tons) for 2024.
Which country is the biggest silver producer?
Mexico, with an estimated 6,300 tons in 2025, about a quarter of world supply. Peru (3,600 tons) and China (3,400 tons) follow.
How many troy ounces are in a metric ton of gold?
About 32,150.7 troy ounces. One troy ounce is 31.1035 grams, so 1,000,000 grams divided by 31.1035 gives that figure.
Is a ton in these reports a US short ton or a metric ton?
USGS reports gold and silver in metric tons. A short ton is 2,000 pounds, about 0.907 metric tons, so mixing them overstates or understates a total by roughly 10%.
Why do company ounces not match USGS tons?
Companies often report their ownership share, sometimes payable ounces, and for their own financial year. USGS reports whole-mine production by calendar year, so convert and compare on the same basis.
Is mine production the same as refinery production?
No. USGS lists them separately. US primary refinery output was 170 tons in 2025 against 160 tons of mine output, because refineries also handle imported doré.
How much gold is in US reserves and in the ground?
USGS lists US gold reserves of 3,000 tons against 66,000 tons worldwide. Its assessment of US gold resources is 33,000 tons, with 15,000 identified and 18,000 undiscovered.
This page is for information only. It is not investment advice.
Farmonaut mining
Map your own project area from space
Send your licence boundary and get a satellite screening of alteration and structure to plan field work.

Mining Pro sample view, synthetic data
Keep reading
Sources
- USGS, Mineral Commodity Summaries 2026, Gold: pubs.usgs.gov
- USGS, Mineral Commodity Summaries 2026, Silver: pubs.usgs.gov
- USGS, Mineral Commodity Summaries 2026 (publication page): pubs.usgs.gov
- Natural Resources Canada, Gold Facts: natural-resources.canada.ca
- Barrick, Q4 2025 Mine Statistics: s25.q4cdn.com
- Agnico Eagle, Q4 and full year 2025 results: s205.q4cdn.com
- Silver Institute, 2026 silver forecast: silverinstitute.org
- Silver Institute, silver supply and demand: silverinstitute.org
- World Gold Council, Gold Demand Trends: gold.org
- LBMA, precious metal prices: lbma.org.uk
Discussion
Questions, corrections or field experience? Share them below. First-time comments are reviewed before they appear, and your email is never published.
No comments yet. Be the first to add a question or your experience.

 Vulcan International Limited
 Kidepo Associates
 GKY Mining
 Alkimy SARL
 Double A Trading
 GemSprout Metals Limited
 Qader Group
 Ileys General Trading
 SG Gold Mining LLC
 VRV Global Pte Ltd
 Omsri International FZE
 G.I.T.T.
 Jaunita Erss Ltd
 Almosi SARL
 SRK Consulting
 Berks Gold Limited
 Mwerezi Minerals Company Limited
 Mining SARL
 SenGold Invest SAS
 Sean Mining Limited

 Exploration consultancy · South Africa · Gold










