

Antofagasta plc · Mine-by-mine guide
Antofagasta plc Mines: Output, Costs and Growth
Antofagasta plc runs four copper mines in Chile and made 653,700 tonnes of copper in 2025. This guide ranks them by output, compares nine-month 2026 cash costs and sets out the growth projects, water use and a margin calculator.
Key takeaways
- Group copper output was 653,700 t in 2025; Los Pelambres made 295,300 t and Centinela 240,400 t (Antofagasta Annual Report 2025).
- Nine-month 2026 output was 436,900 t, down 8.3%, on lower Centinela grades; 2026 guidance is 625,000-655,000 t and 2027 guidance 630,000-690,000 t (Q3 report, 15 Oct 2026).
- Cash cost before by-product credits was US$2.81/lb for nine months of 2026 against US$2.35/lb; net cash cost was US$1.28/lb.
- Seawater was 63% of group water withdrawals in 2025, and the Centinela Second Concentrator (about US$4.0 billion after a US$380 million cut from the US$4.4 billion first estimate) completes construction in 2027.
- Group EBITDA was US$5,202 million in 2025 on a 60% margin; Los Pelambres and Centinela earned most of it.
In this article
- Antofagasta plc mines at a glance
- How the four mines are ranked
- Q3 production and cash costs by mine
- Which mines earn the profit
- Growth projects at Centinela and Los Pelambres
- Water and power at the mines
- Technologies named in the annual report
- Copper price, treatment charges and a margin calculator
- What can slow output
- Exploration assets and Twin Metals
- Where satellite data fits in mine geology work
- Frequently asked questions
Antofagasta plc runs four copper mines in Chile: Los Pelambres, Centinela, Antucoya and Zaldívar. Together they produced 653,700 tonnes of copper in 2025, and the company guides to 625,000 to 655,000 tonnes for 2026 (Antofagasta Q3 production report, 15 October 2026). This guide ranks the four mines by output, shows what each costs to run per pound of copper, and sets out what the company’s own reports say about growth projects, water, power and technology. Every number comes from the company’s filings or from a named agency, with the date beside it.
The word “Antofagasta” also names a city and a region in northern Chile. Three of the four mines sit in that region. This page is about the mining company and its operations, not the city.
Antofagasta plc mines at a glance
The table gives the basics for each mine. “Cash cost before by-product credits” is the cost of producing a pound of copper before the company subtracts the sales value of its gold, silver and molybdenum. Ore reserves are the part of a deposit that can be mined at a profit under current plans; resources are the wider mineralised rock. Grade is the percentage of copper in the ore.
| Mine | Region and product | Antofagasta stake | Copper output 2025 | Cash cost before credits 2025 | Ore reserves, Dec 2025 |
|---|---|---|---|---|---|
| Los Pelambres | Coquimbo; concentrate with gold, silver, molybdenum | 60% | 295,300 t | US$2.21/lb | 716 Mt at 0.58% Cu |
| Centinela | Antofagasta Region; concentrate and cathodes | 70% | 240,400 t | US$2.27/lb | 2,505 Mt at 0.41% Cu (concentrates and cathodes; 2,393 Mt in concentrates) |
| Antucoya | Antofagasta Region; cathodes | 70% | 81,200 t | US$2.82/lb | 712 Mt at 0.30% Cu |
| Zaldívar | Antofagasta Region; cathodes | 50% (joint venture with Barrick) | 36,700 t (Antofagasta share) | US$3.44/lb | 354 Mt at 0.40% Cu (100% basis; 177 Mt is Antofagasta’s 50%) |
Source for the table: Antofagasta plc Annual Report 2025. The four outputs add up to the group total of 653,700 tonnes. Reserves are shown on a 100% basis for all four mines, while Zaldívar copper output is Antofagasta’s 50% share.
How the four mines are ranked
The ranking metric is copper produced in 2025, taken from the annual report. All four operating mines are included, so nothing that qualifies is left out. Gold, molybdenum and cost are shown beside it because they change the picture: a mine with modest copper output can still earn well if its by-products are valuable.
Chart
Copper output by mine, 2025
Thousand tonnes of copper; Zaldívar is Antofagasta’s 50% share
1. Los Pelambres: the largest producer
Best for: scale and molybdenum. Los Pelambres is a sulphide deposit in the Coquimbo Region, 240 km north of Santiago. It made 295,300 tonnes of copper in 2025, 54,800 ounces of gold and 12,400 tonnes of molybdenum, and produced about 45% of the group’s copper. Its 2025 EBITDA was US$2,548.0 million (Annual Report 2025).
Pros: the lowest cash cost of the four before credits (US$2.21/lb in 2025), and a life-of-mine extension to 2051 that depends on an environmental impact assessment filed in December 2024 and still under review. Cons: output fell 8% in 2025 on harder ore, lower grade and more maintenance, and a July 2026 weather event briefly paused operations. Copper production for the first nine months of 2026 was 213,100 tonnes, 1% below the same period of 2025 (Q3 report).
2. Centinela: the growth mine
Best for: gold by-product and expansion. Centinela, 1,350 km north of Santiago, produces concentrate through a mill and flotation plant and cathodes through solvent extraction and electrowinning (SX-EW, a process that leaches copper with acid and plates it onto cathode sheets). It made 240,400 tonnes in 2025, up 7%, with 156,500 ounces of gold. EBITDA rose to US$2,234.2 million from US$1,130.3 million.
Pros: the largest reserve (2,505 Mt across concentrates and cathodes) and the second concentrator now being built. Cons: copper grade at Centinela Concentrates averaged 0.45% in the first nine months of 2026 against 0.55% a year earlier, so output fell 19% to 143,900 tonnes. After quarter end, two unions representing about 20% of own employees declared a strike, and talks continue (Q3 report).
3. Antucoya: the steady cathode mine
Best for: simple oxide leaching. Antucoya lies about 1,400 km north of Santiago and 125 km north-east of the city of Antofagasta. It mines and leaches oxide ore to make cathodes. It produced 81,200 tonnes in 2025 and 55,800 tonnes in the first nine months of 2026, 4% lower on grade and recovery.
Pros: steady output and a mine life to 2045. Cons: a cash cost of US$2.82/lb in 2025, and recovery that fell to 59.6% in the third quarter of 2026 during a campaign of lower-permeability ore.
4. Zaldívar: the water-transition mine
Best for: the joint-venture structure. Zaldívar is a 50-50 venture with Barrick, operated by Antofagasta. Its 2025 output was 36,700 tonnes for Antofagasta’s share and attributable EBITDA was US$61.8 million.
Pros: an approved environmental assessment (May 2025) gives the option to extend the mine to 2051. Cons: the highest cash cost of the four (US$3.44/lb in 2025) and a three-year task to move from continental water to seawater or a third-party supply.
Q3 production and cash costs by mine
In the third quarter of 2026 the group produced 151,900 tonnes of copper, 7% more than the second quarter, 44,300 ounces of gold and 2,900 tonnes of molybdenum. Over nine months, copper output was 436,900 tonnes against 476,600 tonnes a year earlier, an 8.3% fall that the company links to lower grades at Centinela Concentrates and lower recoveries at Centinela Cathodes. Group cash costs before by-product credits were US$2.81/lb for nine months against US$2.35/lb, mainly from lower production and dearer diesel and sulphuric acid. Net cash cost, which subtracts by-product credits, was US$1.28/lb (Q3 production report).
Chart
Group copper production, 2021 to 2025
Thousand tonnes of copper
Chart
Cash cost before by-product credits, nine months
US$ per pound of copper; Centinela is concentrates and cathodes combined
The chart below compares the nine-month cash cost before credits for 2026 with the same months of 2025. Every mine is more expensive, and Centinela moved most.
Group copper output has been flat to slightly down for four years. It peaked at 721,500 tonnes in 2021 and was 653,700 tonnes in 2025. The company’s guidance for 2027 is 630,000 to 690,000 tonnes, with higher grades at Los Pelambres offsetting lower grades at Centinela Concentrates. Group cash cost guidance for 2026 was raised to US$2.60 to 2.70/lb from US$2.40 to 2.60/lb because diesel prices stayed high, and capital spending guidance is US$3.4 billion (excluding Zaldívar).
Which mines earn the profit
Group EBITDA (earnings before interest, tax, depreciation and amortisation) was US$5,202 million in 2025, 52% higher than 2024, on revenue of US$8.6 billion and an EBITDA margin of 60% (Annual Report 2025). Two mines produced almost all of it: Los Pelambres and Centinela. Antucoya added US$327.0 million and Zaldívar US$61.8 million for the company’s half share.
Chart
EBITDA by mine, 2025
US$ million; Zaldívar is the attributable half share
Prices explain much of the jump. In the first nine months of 2026 the market copper price averaged US$6.09/lb against US$4.33/lb a year earlier, and the average realised price was US$6.43/lb. Gold averaged US$4,544 an ounce (market) and molybdenum US$29.5/lb. By-product credits were US$1.53/lb for nine months, 38% higher than the year before, which kept the net cash cost at US$1.28/lb even as the gross cost climbed (Q3 report).
For context, the Chilean Copper Commission (Cochilco) reported that 21 large Chilean operations, about 94% of national output, had an average net cost near US$1.8/lb in 2025, down 5.7%, helped by by-product credits and lower treatment charges (Reporte Minero on the Cochilco cost observatory, 1 June 2026). Company and Cochilco cost definitions differ, so compare direction rather than exact levels.
Growth projects at Centinela and Los Pelambres
Capital spending in 2025 was US$1,070.5 million at Los Pelambres and US$2,478.1 million at Centinela, including US$1,635.8 million of development capital at Centinela, US$1,327.1 million of it on the second concentrator. Two programmes dominate.
Centinela Second Concentrator. A new concentrator, a few kilometres south-west of the existing 107 ktpd plant, adds 95 kilotonnes per day (ktpd) of processing capacity. The company’s annual report gives a capital cost of US$4.4 billion, the December 2023 figure, which it says was later cut by US$380 million when Centinela’s water infrastructure was outsourced (about US$4.0 billion). The plant will use high-pressure grinding rolls (HPGRs, crushers that save grinding energy), autonomous mining fleets and a remote operating centre in the city of Antofagasta, and the company says it will run on 100% renewable energy and seawater. The annual report says construction completes in 2027, with ramp-up starting late 2027 and completion in late 2028. In the third quarter of 2026 the primary crusher and the overland conveyor began initial operation as part of pre-commissioning, and the conveyor reached nominal speed in tests.
Los Pelambres Growth Enabling Projects. Two projects with a combined cost near US$2.0 billion: a new concentrate pipeline with the El Mauro enclosures, and a desalination plant expansion from 400 to 800 litres per second. Hydraulic tests began on the lower pipeline section in the third quarter of 2026. A separate Development Options Project would extend the mine to 2051, expand the El Mauro tailings dam, and could raise throughput to 205 ktpd.
If you want to see how copper deposits of this type form and where explorers look for them, our guides on porphyry copper deposits and copper deposit types and top countries cover the geology.
Water and power at the mines
Water is a central issue for copper mining in northern and central Chile. The group withdrew 93.2 gigalitres in 2025, and seawater made up 63% of that, up from 58% in 2024. Centinela and Antucoya take close to 100% of their water from the sea after closing their last continental wells in 2022. Raw seawater is pumped using renewable electricity from a coastal facility. The recirculation rate was 84% (Annual Report 2025).
The wider industry is moving the same way. Cochilco expects seawater to reach 67.6% of Chilean copper-mining water use by 2034 from 40.7% in 2024, with about three-quarters of that desalinated (Reuters via Kitco, 18 March 2026). Desalination protects freshwater but needs energy, and environmental groups warn about marine effects.
On power, all operations are on Chile’s national grid with power purchase agreements that have been fully renewable-based since 2022. Electricity use was 3,724 GWh in 2025 at a weighted price of US$128/MWh, and electricity is 12% of cash costs. Scope 1 and 2 emissions intensity rose 9% to 1.91 tonnes of CO2e per tonne of copper in 2025 (Annual Report 2025). The Copper Mark certifies responsible copper production; its register lists Centinela as awarded until 20 November 2027 and Antucoya until 10 August 2028, with Los Pelambres awarded on 29 December 2025 (register entry valid to 28 December 2028) after an assessment with four criteria only partly met and an improvement plan under way (participants register hosted by Veramark Assurance).

▶ Walks through the seven environmental impacts of mining in plain words. · 2:31
Technologies named in the annual report
The 2025 annual report names the technologies below, and the list keeps to what it states. The report also says the Mining Division was ranked Chile’s most innovative mining company for the third year running in the Most Innovative Companies Chile ranking.
- Intelligent process control. SIRO BLEND optimises daily ore blending, and SIRO MINCO tunes grinding and flotation. The report says both delivered measurable improvements in copper recovery.
- Heap-leach irrigation platforms. SIRO Cinéticas and SmartPLS manage how acid solution is applied to leach pads.
- LTE connectivity for autonomous operations at the Encuentro Sulphides deposit at Centinela, noted as a milestone in 2025.
- Autonomous mining fleets planned for the Centinela second concentrator project.
- High-pressure grinding rolls at the same project, to cut energy use.
- A remote operating centre in the city of Antofagasta to run the new plant.
- Robotic SAG mill liner replacement at Los Pelambres. Two robots handled the first round in 2025 and two more are planned for 2026. A SAG mill is a large mill that grinds ore with steel balls and the ore itself.
- Trolley-assist trials at Los Pelambres, where haul trucks draw electric power from overhead lines on uphill hauls to save diesel.
Beyond these, the company reports a 37% fall in Mining Division Scope 1 and 2 emissions since 2020 on a market basis and a lost-time injury frequency of 0.58 per million hours in 2025, with no fatalities. The Q3 2026 report adds that the group has now gone over five years without a fatal accident.
Copper price, treatment charges and a margin calculator
Antofagasta sells mostly copper concentrate, so it also depends on treatment and refining charges (TC/RCs), the fees smelters charge to process concentrate. For 2026 the company agreed charges of US$0 per tonne and 0 cents per pound with a Chinese smelter, the lowest ever agreed in an annual negotiation and down from US$21.25 per tonne and 2.125 cents per pound for 2025 (Reuters via Mining.com, 19 December 2025).
On 14 October 2026 the LME three-month copper contract closed at US$14,436 per tonne, about US$6.55/lb, and sat 2 to 3% below September’s records (International Copper Association Australia, 15 October 2026). Cochilco’s August 2026 outlook averages US$5.95/lb for 2026 and US$5.10/lb for 2027 (Reporte Minero, 12 August 2026). The International Copper Study Group expects world mine output to grow 1.6% in 2026 and 2.3% in 2027, after cutting its Chile forecast (ICSG, 23 April 2026). Chile produced an estimated 5.3 million tonnes of the world’s 23 million in 2025 (USGS Mineral Commodity Summaries 2026). For how concentrate is priced, see our guide to copper concentrate price per ton.
The calculator below uses the company’s own cost measures. Enter a copper price, a cash cost before credits and a by-product credit, and it returns the margin per pound and a yearly total before tax, capital spending and royalties.
Calculator
What is the copper margin per pound and per year?
Enter your own price, cost and output. Results update as you type.
- Net cash cost per lb: $1.35
- Yearly margin, US$ million: 1,135
- Yearly revenue, US$ million: 1,433
Example values only, not benchmarks. The price is an input: use today’s price. The cost and credit defaults are rounded from the group’s third-quarter 2026 figures (US$2.73/lb before credits, US$1.35/lb by-product credits; the nine-month figures are US$2.81 and US$1.53). Margin is before tax, royalties and capital spending. One tonne is 2,204.62 lb. All money in US$.
What can slow output
The reports show four recurring pressures. Grade: lower copper grades at Centinela Concentrates are in the mine plan and drive most of the 2026 fall. Weather: a severe July 2026 event paused Los Pelambres for a short time, and the company drew down about 7,000 tonnes of inventory afterwards. Labour: a three-year agreement was signed at Zaldívar in the third quarter, four three-year agreements were concluded in 2025, and the Centinela strike was unresolved at the time of the report. Input costs: diesel and sulphuric acid pushed costs up in 2026, which also affects leach operations such as Antucoya and Centinela Cathodes.
Concentrate shipping and rail also matter. The group’s transport division moved 1.4 million tonnes in the third quarter, 3% lower than the second, with rail and road tonnages down on weather and weaker sulphuric acid demand.
Exploration assets and Twin Metals
Beyond the four mines the annual report lists a Chilean exploration portfolio including Cachorro (256 Mt resource at 1.29% Cu) and Encierro (522 Mt at 0.65% Cu). Antofagasta also holds about 19% of Peru’s Buenaventura, a listed precious and base metals company.
Twin Metals Minnesota is a wholly owned underground copper, nickel and platinum group metals project. The planned design is 18,000 tonnes of ore a day for 25 years. According to the 2025 annual report, development in its current configuration is on hold while litigation challenges US federal government actions (status as of the report, published in 2026), and the company carries its US$150.1 million of mining-lease assets at nil after a full impairment. No production is counted from it.
Where satellite data fits in mine geology work
Operators like these use drilling, geophysics and block models to decide where to dig. Satellite images help earlier, when a licence holder wants to screen ground for alteration and structure before spending on field work. Farmonaut produces satellite-based mineral detection reports from a boundary file in 5 to 20 business days; see our satellite-based mineral detection page, or compare with drone topographic survey methods. For a project quote, use the mining query form or contact us.
This page is not investment advice, and satellite results are exploration targets, not resource estimates.
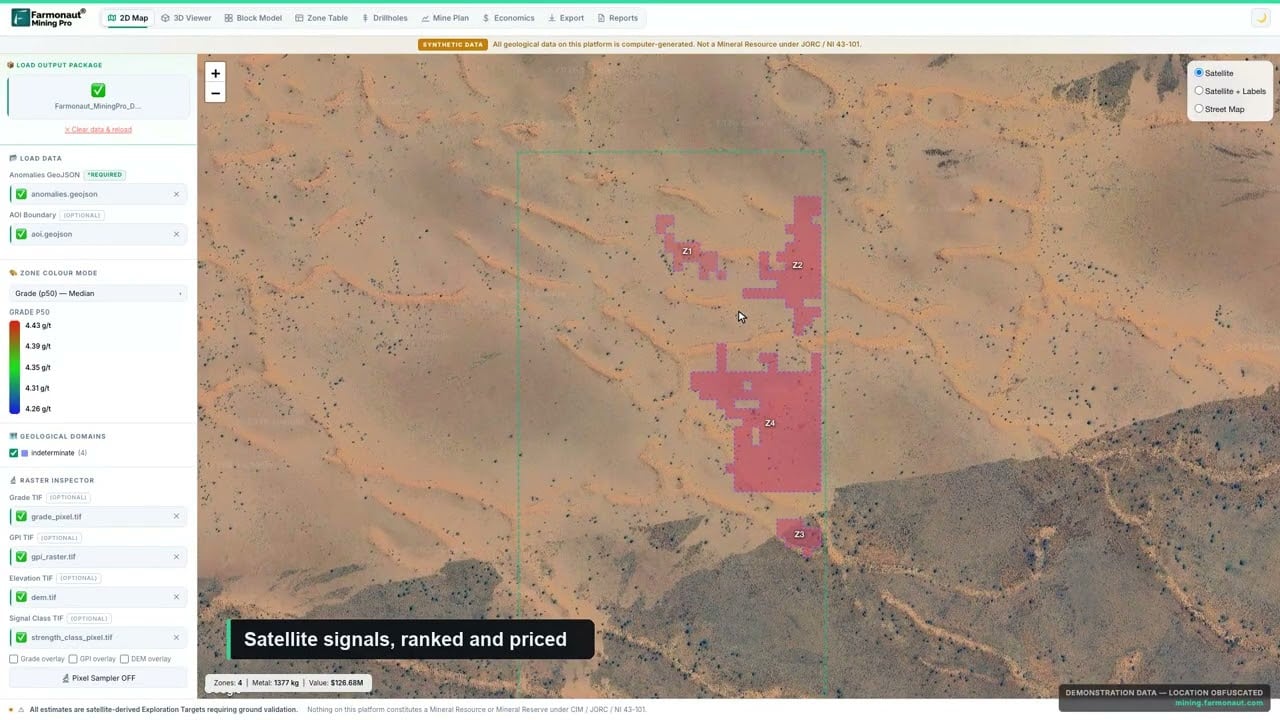
▶ A short look at Farmonaut Mining Pro, which turns a licence boundary into a geological and economic picture. · 4:56
Related reading on this site: Edge Computing in Mining: Uses, Latency and Bandwidth Math.
We cover a connected topic in Wheaton vs Pan American Silver: Output, Costs, Risk.
Frequently asked questions
How many mines does Antofagasta plc operate?
Four copper mines: Los Pelambres, Centinela, Antucoya and Zaldívar. Los Pelambres is in the Coquimbo Region, and the other three are in the Antofagasta Region (Annual Report 2025).
How much copper does Antofagasta produce?
653,700 tonnes in 2025. Guidance is 625,000 to 655,000 tonnes for 2026 and 630,000 to 690,000 tonnes for 2027, according to the 15 October 2026 production report.
Who owns Antofagasta’s mines?
Antofagasta plc holds 60% of Los Pelambres, 70% of Centinela, 70% of Antucoya and 50% of Zaldívar, which is a joint venture with Barrick Mining Corporation (Annual Report 2025, subsidiary and joint venture notes).
Which Antofagasta mine produces the most copper?
Los Pelambres, with 295,300 tonnes in 2025, about 45% of the group total. Centinela was second at 240,400 tonnes.
What are Antofagasta’s cash costs?
Net cash costs were US$1.19/lb in 2025. For the first nine months of 2026 they were US$1.28/lb, with cash costs before by-product credits at US$2.81/lb. The net figure subtracts credits from gold, silver and molybdenum sales.
Does Antofagasta use seawater at its mines?
Yes. Seawater was 63% of group water withdrawals in 2025, and Centinela and Antucoya use close to 100% seawater. Zaldívar is moving off continental water over a three-year transition.
What is the Centinela Second Concentrator?
A new 95 ktpd processing plant with a capital cost of about US$4.0 billion (US$4.4 billion at announcement) that doubles Centinela’s copper-in-concentrate production capacity. Construction completes in 2027, with ramp-up from late 2027.
Is Twin Metals in production?
No. The Minnesota project is a development-stage underground proposal that is on hold during litigation over federal government actions that affected its leases.
Does Antofagasta produce gold and molybdenum?
Yes, as by-products of copper. In 2025 Centinela made 156,500 ounces of gold and Los Pelambres 54,800 ounces, while Los Pelambres made 12,400 tonnes of molybdenum.
Why did Antofagasta’s copper output fall?
The company links the 8.3% fall in nine-month production mainly to lower grades at Centinela Concentrates and lower recoveries at Centinela Cathodes, with a July weather event also affecting Los Pelambres.
Is Antofagasta plc the same as the city of Antofagasta?
No. The city and region lie in northern Chile, and three of the company’s mines are in that region. The company also runs a remote operating centre in the city for the Centinela expansion.
This page is for information only. It is not investment advice. Prices and company figures are dated; confirm current numbers with the company’s filings.
Farmonaut mining
Map your mining site from space
Send a KML, KMZ or polygon and Farmonaut screens the area from satellite images before field crews go in.

Mining Pro sample view, synthetic data
Keep reading
Sources
- Antofagasta plc, Annual Report and Financial Statements 2025: antofagasta.co.uk
- Antofagasta plc, Q3 2026 Production Report (15 October 2026): antofagasta.co.uk
- USGS, Mineral Commodity Summaries 2026: Copper: pubs.usgs.gov
- International Copper Study Group, Copper Market Forecast 2026/2027 (23 April 2026): icsg.org
- The Copper Mark participants register (hosted by Veramark Assurance): veramark.org
- Reuters via Kitco, Chilean miners to use more seawater (18 March 2026): kitco.com
- Reuters via Mining.com, Antofagasta agrees zero copper processing charges for 2026 (19 December 2025): mining.com
- International Copper Association Australia, Copper Weekly Brief (15 October 2026): copper.com.au
- Reporte Minero, Cochilco raises 2026 copper price projection (12 August 2026): reporteminero.cl
- Reporte Minero, Mining costs fall 5.7% in 2025 (Cochilco cost observatory, 1 June 2026): reporteminero.cl
Discussion
Questions, corrections or field experience? Share them below. First-time comments are reviewed before they appear, and your email is never published.
No comments yet. Be the first to add a question or your experience.

 Almosi SARL
 SRK Consulting
 Berks Gold Limited
 Mwerezi Minerals Company Limited
 Mining SARL
 SenGold Invest SAS
 Sean Mining Limited
 NTS Group (Pty) Ltd
 Mine4Africa
 Lithspo Minerals Limited
 Tintina Mining Group
 Dalgety Minerals Pty Ltd
 Vortex Minerals Pty Ltd
 Faith At Work (Pty) Ltd
 Geotech Mining Solutions plc

 Licence holder · Nigeria · Gold + lithium










