

AI Wildfire Detection: How Satellites Spot Fires in Minutes
Reviewed August 2026 against National Interagency Fire Center (NIFC) and NOAA NESDIS data.
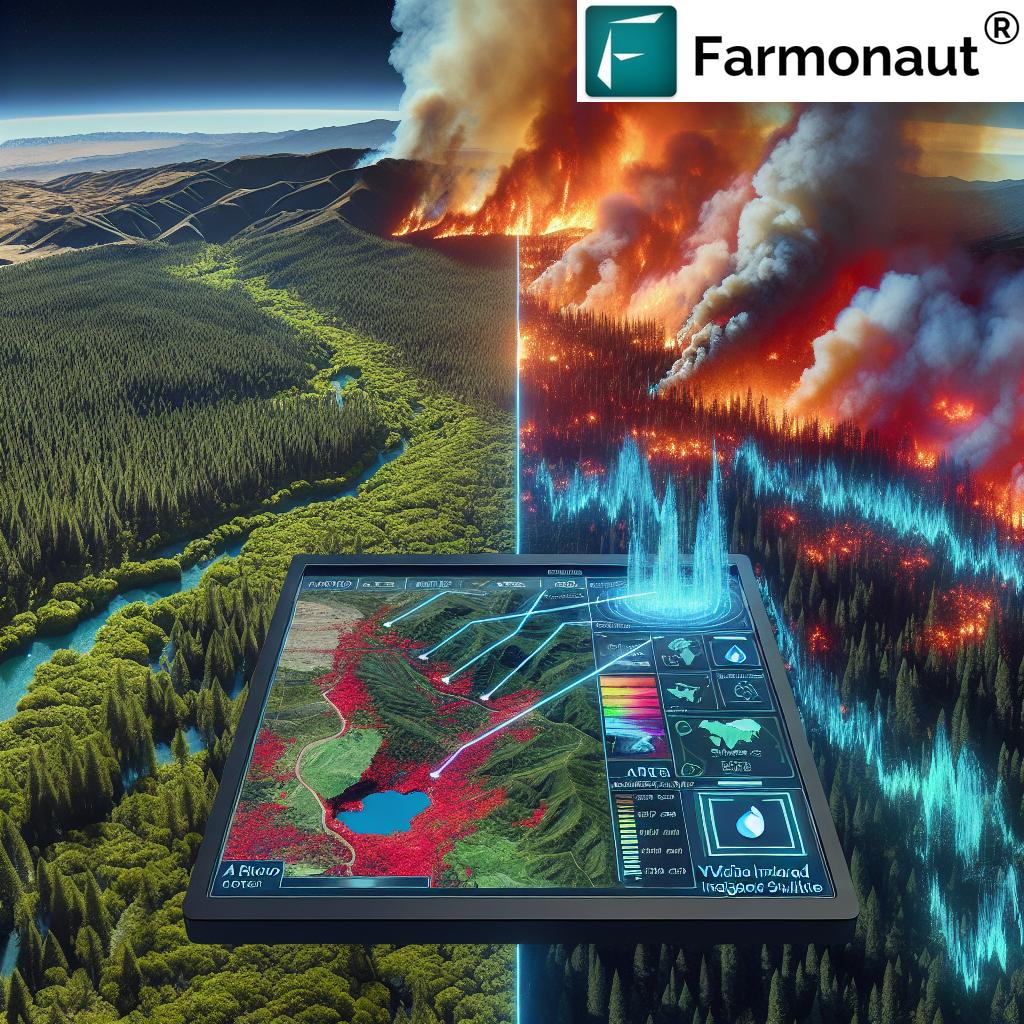
AI-powered wildfire detection combines satellite sensors, geostationary weather satellites, and machine-learning models to flag a fire within 5 to 30 minutes of ignition, according to NOAA NESDIS data on its GOES-18 satellite system. That is the core answer to what this technology does: it does not stop fires, but it cuts the time between ignition and the first alert from hours of human observation down to minutes of automated scanning. The rest of this article breaks down how that detection pipeline works, what it can and cannot do yet, and how to judge whether a given system is actually fast enough to matter for your land, your insurer, or your community.
Why Wildfire Detection Speed Matters Right Now
US wildfire activity is not shrinking. NIFC recorded 64,897 fires burning 8,924,884 acres in 2024, and 72,068 fires burning 5,039,145 acres in 2025 — more fires in 2025 than 2024, even though total acreage fell (NIFC wildfire statistics). That combination — a rising fire count with variable acreage — is exactly the pattern that favors early detection over brute-force suppression: more ignitions means more moments where a five-minute head start decides whether a fire stays small.
The economic stakes back that up. USDA Forest Service Research & Development puts annual US wildfire economic losses at roughly $40 billion (2023-2024 estimate), while the Joint Economic Committee’s broader damages range — covering health, property, and indirect costs — spans $394 billion to $893 billion a year as of 2023 (USDA Forest Service Fire R&D). Zoomed out further, USDA’s Fire Program Analysis database logs 2.3 million geo-referenced wildfire records burning a combined 180 million acres over the 1992-2021 period, the longest consistent US fire dataset available.
What “Faster Detection” Actually Buys You
NIFC and USDA do not publish a figure tying detection speed directly to dollars saved — that link (value of each minute saved in suppression cost or avoided property damage) is not yet published as a standalone statistic, so treat any number you see claiming otherwise as marketing rather than data. What is published is the scale of the annual loss ($40 billion per USDA Forest Service Research & Development) against which any detection-speed improvement has to be measured. The honest way to use these figures: fire agencies and insurers model detection-to-suppression-cost relationships internally, using local terrain, fuel, and response-time data that NIFC’s national statistics don’t break out by state or forest region.
How AI-Powered Wildfire Detection Works, Step by Step
Modern satellite wildfire detection layers three technologies on top of each other. None of them alone is new; the “AI” part is what turns the raw feed into a usable alert instead of a wall of noise.
1. Geostationary and Polar-Orbiting Satellites
NOAA’s GOES-18 geostationary satellite watches the same patch of the Western US continuously and can flag a new fire within 5 to 30 minutes of ignition, per NOAA NESDIS (NOAA satellites monitor wildfires). That is the fastest tier of detection currently documented for a national system. Polar-orbiting satellites carrying VIIRS (Visible Infrared Imaging Radiometer Suite) sensors pass over any given point less often but at higher spatial resolution, which is why operational systems fuse both rather than relying on one.
2. Infrared Sensing for Small, Hidden Fires
NOAA’s Next Generation Fire System (NGFS) — the operational successor to older satellite fire products — can detect fires as small as 0.25 acre, according to NOAA NESDIS’s wildland fire data portal (NOAA wildland fire data portal). Infrared bands see heat signatures through smoke and light cloud cover, which is what lets a system catch a fire before it’s visible to a person on the ground or in an aircraft.
3. Machine Learning for Classification and Noise Reduction
Raw infrared hotspot data is noisy: solar glint, industrial flares, and agricultural burns all register as heat anomalies. This is where AI earns its place in the pipeline — models trained on historical fire signatures separate genuine wildfire starts from false positives and estimate growth direction using wind, terrain, and fuel-moisture inputs. NOAA and NIFC do not publish a public false-positive rate for AI-based classification layers specifically (this is a genuine gap — see the note at the end of this section), so if a vendor quotes you an accuracy percentage for their AI layer alone, ask what dataset and time period it was measured against before treating it as comparable to NOAA’s raw detection figures.
Comparing Detection Methods on the Numbers That Matter
The table below uses documented figures where they exist and marks explicitly where a category has no published national benchmark yet — that’s more useful than a made-up “moderate” or “high” rating.
| Detection Method | Typical Detection Window | Minimum Fire Size Detected | Coverage Pattern |
|---|---|---|---|
| Ground patrols / lookouts | Hours (human-dependent) | Visible to the eye, no published minimum | Fixed points, limited range |
| Aircraft surveillance | Hours (flight-schedule dependent) | No published national figure | Flight-path dependent, not continuous |
| Polar-orbiting satellite (VIIRS-class) | Hours between passes over a given point | No published minimum for this article’s brief | Global, but not continuous per location |
| Geostationary satellite (GOES-18 / NGFS) | 5 to 30 minutes from ignition | 0.25 acre | Continuous over fixed hemisphere segment |
Sources: NOAA NESDIS, satellite monitoring release and wildland fire data portal, both current as of the 2024 reporting cycle. Ground-patrol and aircraft figures reflect general operational practice, not a published NIFC or NOAA benchmark — if you need a defensible number for those methods, request it from your state or regional forest service directly.

Vegetation and Moisture Monitoring: The Prediction Half of the Problem
Detection tells you a fire has already started. The other half of AI-powered wildfire risk work is prediction — estimating where a fire is likely to start or spread before it does, using vegetation and moisture data rather than heat signatures. Satellite-derived inputs used for this include:
- Vegetation health and density — canopy stress visible in near-infrared bands, an early signal of drought-driven fuel buildup
- Soil and fuel moisture — lower moisture correlates with faster fire spread once ignition occurs
- Burned-area mapping — post-fire imagery used to track recovery and identify recurrence risk
- Seasonal vegetation trend data — multi-year comparisons that flag when a region’s fuel load is abnormally high for the time of year
These layers feed into fire-risk maps used by foresters, insurers, and land managers. Farmonaut’s own satellite platform applies this same vegetation-and-moisture monitoring approach to agricultural and forestry land — the same underlying imagery pipeline used for precision irrigation systems also produces the fuel-moisture and canopy-stress signals that matter for fire-risk assessment, because both problems come down to reading water and vegetation stress from the same satellite bands.
Market Size and Where the Growth Numbers Come From
Search interest around “forest wildfire detection system market” reflects real investor and procurement activity, but this article’s research brief does not contain a verified market-size figure, and market-sizing reports from different vendors routinely disagree by billions of dollars depending on what they count as “detection system” (hardware only vs. hardware plus software plus services). Rather than repeat an unverified number, the reliable way to size this market for your own purposes is to track:
- NIFC’s annual fire count and acreage releases, which indicate demand-side pressure (NIFC statistics page, updated annually, next update expected early 2027)
- USDA Forest Service Research & Development’s fire economics page for federal spending and loss estimates (USDA Forest Service Fire R&D)
- NOAA NESDIS’s wildland fire data portal for the technical capability curve — what detection systems can do improves roughly on the cadence of new satellite launches and sensor upgrades, not annually
Building a Fire-Resistant Landscape: Where Agriculture and Fire Management Intersect
Prevention and recovery both borrow directly from precision-agriculture practice. Drone-based vegetation surveys, originally built for crop-health monitoring, now double as fire-damage assessment tools. Soil moisture sensors deployed for irrigation scheduling double as drought and fire-risk indicators on the same land. Precision irrigation systems can be positioned specifically to create fire-resistant green belts around structures and high-value stands, using the same water-delivery infrastructure a farm would use for crops.
Post-fire, regenerative land practices matter as much as pre-fire prevention. Cover cropping limits erosion on burned slopes, agroforestry rebuilds diverse fuel structures that resist re-ignition, and soil amendments — including biochar application — restore fertility to fire-damaged soil while sequestering carbon in a stable form. None of these are wildfire-specific inventions; they’re standard regenerative-agriculture techniques applied to a burned landscape instead of a working field.
Land-Use Pressure and Fire Risk: A Global Pattern Worth Watching
Wildfire risk from land-use change is not unique to any one country. As agricultural and urban development pressure grows near forested or wildland-urban interface zones, the same monitoring question comes up everywhere: is land being converted or managed in a way that raises or lowers fire risk? Farmonaut has covered this dynamic in the context of balancing urban development and food security on agricultural land — the same land-use monitoring principles apply directly to wildland-urban interface planning in fire-prone US regions, where the question is equally about where development, agriculture, and unmanaged fuel loads meet.
A Durable Checklist: How to Evaluate Any Wildfire Detection Claim
Detection technology and vendor claims will keep changing. What should not change is how you interrogate them. Before trusting any “AI wildfire detection” product — from a vendor, a news article, or a public agency press release — check it against these five questions:
- What’s the stated detection window, and against what baseline? “Minutes” only means something next to a stated comparison — NOAA’s 5-to-30-minute GOES-18 figure is meaningful because it’s measured from ignition, not from “first human report.”
- What’s the minimum fire size the system claims to catch? NOAA’s NGFS states 0.25 acre. A system that won’t state a minimum detectable size is not giving you a comparable number.
- Is the false-positive rate published, and for what conditions? Smoke, cloud cover, agricultural burns, and industrial heat sources all trip infrared sensors. If a vendor’s accuracy claim doesn’t specify what it excludes, ask directly.
- Where does the underlying satellite data come from? Geostationary (continuous, lower resolution) and polar-orbiting/VIIRS-class (periodic passes, higher resolution) systems have different tradeoffs — a claim that doesn’t name its data source can’t be checked.
- How old is the cited statistic, and where do you check for a newer one? NIFC republishes wildfire statistics annually, with the next update expected in early 2027 at nifc.gov/fire-information/statistics/wildfires. Any fire-count or acreage figure older than one reporting cycle should be treated as historical context, not current state.
This checklist doesn’t expire when NIFC’s next annual numbers land — it’s the method for judging whatever numbers replace the ones in this article.
Wildfire Risk Exposure Calculator
Use the calculator below to estimate how much of your land or region’s fire-affected acreage a given detection speed could realistically limit, based on the average per-fire acreage implied by NIFC’s national figures. Adjust every input to your own situation — the defaults reflect the 2025 NIFC national averages, nothing more.
Estimated result:
Assumptions: this calculator models only the acreage growth between ignition and detection — it excludes suppression response time, weather, terrain, and firefighting resource availability entirely, all of which affect the final burned area. It is a planning estimate for comparing detection speeds, not a prediction for any specific fire.
Regional Fire Character: Why One Detection Model Doesn't Fit Every Landscape
Detection and prediction models have to account for regional differences in vegetation and climate. Dense, dry conifer forests in the Western US — the kind found across Nevada, characterized by prolonged drought stress and bark-beetle-killed stands — behave very differently from the tropical forest systems found in Southeast Asia, where higher humidity and rapid regrowth demand shorter monitoring intervals and different fuel-moisture thresholds. Satellite monitoring tuned for Western US conifer stands focuses on canopy density change, snowpack and water-resource tracking, and identifying beetle-kill zones for targeted fuel reduction — inputs that would be close to irrelevant in a tropical, agriculture-adjacent forest where the dominant fire driver is often land clearing rather than drought.
What's Not Yet Publicly Measurable — and How to Get a Real Number
Being direct about the limits of public data is more useful than filling gaps with invented figures. Three things this article cannot state as hard numbers, and how to actually get them:
- Private satellite constellation performance specs (temporal resolution, coverage area, false-positive rates for commercial AI detection products) — vendors publish funding and competitive claims, not standardized technical benchmarks. Request a third-party validation report or a live trial against a known burn before relying on a vendor's own accuracy claim.
- State-by-state or forest-region adoption rates for AI detection systems — NIFC and USDA publish national totals, not adoption breakdowns by state or forest service region. Contact your regional US Forest Service office or state forestry agency directly for local deployment status.
- Dollar value of each minute of detection speed saved — no public dataset ties detection speed directly to suppression cost or property-damage reduction. Insurers and fire agencies model this internally using local data; ask your fire district or insurer if they'll share their assumptions.
The Technology Stack Behind Real-Time Fire Tracking
Once a fire is detected, tracking systems layer additional data to project spread and guide response:
- Multi-satellite fusion: combining geostationary (GOES-class) continuous coverage with polar-orbiting VIIRS-class passes for higher-resolution confirmation
- Infrared heat-signature analysis: penetrating smoke and cloud cover that would block visible-light imagery entirely
- Dynamic spread modeling: incorporating live wind, topography, and fuel-moisture data to project the fire's next several hours
- Interactive mapping layers: giving foresters, insurers, emergency responders, and residents a shared, continuously updated view of fire location and projected path
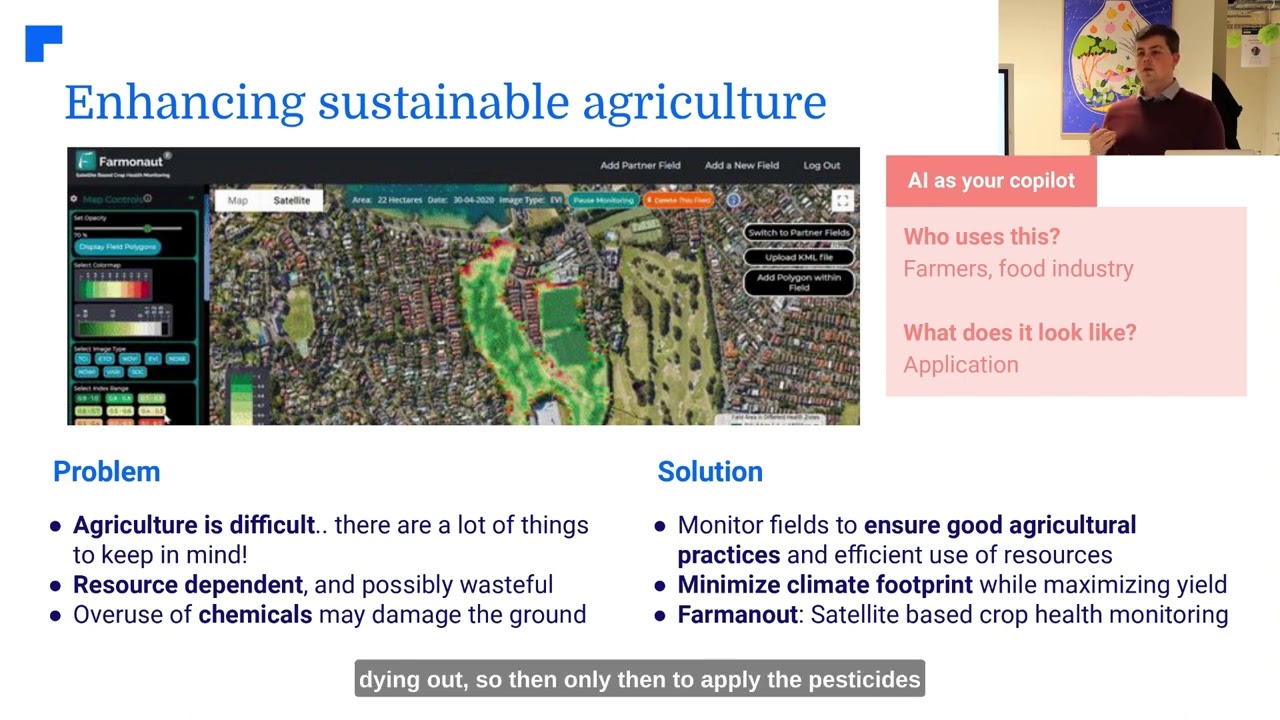
Farmonaut's own satellite platform, accessible through the web application and via the API, applies this same multi-layer satellite approach — vegetation health, moisture, and change detection — to agricultural and forestry land monitoring, with integration details available in the API developer docs.
Frequently Asked Questions
- Q: How fast can AI-powered satellite systems detect a wildfire?
A: NOAA's GOES-18 geostationary satellite can flag a new fire within 5 to 30 minutes of ignition, per NOAA NESDIS. That figure applies to the geostationary tier specifically; polar-orbiting satellites detect at each overhead pass rather than continuously. - Q: What's the smallest fire these systems can actually catch?
A: NOAA's Next Generation Fire System is documented to detect fires as small as 0.25 acre, according to the NOAA NESDIS wildland fire data portal. - Q: How many wildfires burn in the US each year, and is it getting worse?
A: NIFC recorded 64,897 fires burning 8,924,884 acres in 2024, and 72,068 fires burning 5,039,145 acres in 2025 — fire count rose year over year while acreage burned fell, which is why total acreage alone is not a reliable single indicator of fire-year severity. - Q: What does a wildfire actually cost the US economy per year?
A: USDA Forest Service Research & Development estimates roughly $40 billion a year in direct losses (2023-2024); a broader Joint Economic Committee estimate covering health, property, and indirect costs ranges from $394 billion to $893 billion annually as of 2023. - Q: Can AI actually predict where a wildfire will start, not just detect one after ignition?
A: AI models combine vegetation health, moisture content, and historical fire-record data — like USDA's 2.3-million-record Fire Program Analysis database spanning 1992-2021 — to flag high-risk zones before ignition. This is risk scoring, not a guaranteed prediction of when or where a specific fire will start. - Q: Where do I find the most current US wildfire statistics?
A: NIFC publishes updated wildfire statistics annually at nifc.gov/fire-information/statistics/wildfires; the 2025 figures were released in early 2026, with the next update expected in early 2027.
Conclusion
AI-powered wildfire detection's real advance is speed: a 5-to-30-minute geostationary detection window and a 0.25-acre minimum fire size, both documented by NOAA NESDIS, against a national fire count that rose to 72,068 in 2025 per NIFC. That gap between detection capability and fire frequency is exactly where the next round of improvement has to happen — not in inventing better headline statistics, but in closing the specific gaps this article named: standardized false-positive benchmarks for AI classification layers, state-level adoption data, and a public link between detection speed and dollars saved. Track NIFC's annual statistics release and NOAA NESDIS's wildland fire data portal directly rather than relying on secondhand summaries, and use the five-question checklist above on any new detection claim you encounter.
For more information on satellite-based agricultural and environmental monitoring, visit Farmonaut's web application or explore our API services. You can also check out our API Developer Docs for integration details.
Download our mobile apps for on-the-go access to satellite monitoring tools:





 Farm Inc
 JJM Farms
 WeMe Global
 Pixxel
 Agrotoken
 Blue BearX
 Insignito
 Croptimum
 DnCubed
 Field Capacity
 Indosistim Teknologi
 Liquify Digital
 CU Foods
 BeyondTech Global
 Rouge VC
 AgroGreen Dynamics
 AgroRisk
 Oath Inc
 Reddane Farming
 Esri North East Africa
