

Gold exploration · Ontario
Gold deposits in Ontario: who runs each camp now, how an MLAS claim stays alive, and what a satellite can read through boreal forest and till
Most gold deposits in Ontario lie in the Archean greenstone belts of the north, around Timmins, Kirkland Lake, Red Lake, Hemlo and Detour Lake, and Ontario produced 69.7 tonnes of gold in 2024, about 38% of Canada’s total.
Key takeaways
- Ontario’s gold comes mainly from greenstone-belt camps: Timmins (Porcupine), Kirkland Lake, Red Lake, Hemlo, Detour Lake, Geraldton and the far northwest at Musselwhite.
- Ownership has moved fast: Discovery Mining now runs the old Newmont Porcupine operations, Hemlo Mining Corp. owns Hemlo, and Equinox Gold owns Musselwhite and Greenstone.
- Claims are registered online in MLAS by the cell. Each cell needs C$400 of approved work a year, and credits can cover at most the current year plus five.
- Drills under 150 kg need an exploration plan; heavier drills need a permit, and both are circulated to Aboriginal communities first.
- Thick till and forest hide most bedrock, so satellites rank structure, outcrop windows and glacial landforms; till sampling and drilling confirm.
In this article
- Gold deposits in Ontario by the numbers: six years of output
- Where gold deposits in Ontario sit: the camps and their mines
- Ontario gold claims in MLAS: cells, credits and the clock
- From claim to drill pad: exploration plans and permits in Ontario
- What satellites can and cannot see over gold deposits in Ontario
- Public data for gold deposits in Ontario: OGSEarth, OMI, MiRRO
- How we screen an Ontario claim block before field season
- Reading reserves and resources on an Ontario gold mine
- Gold deposits in Ontario: frequently asked questions
Much of the province’s best rock lies under glacial till and boreal forest, so gold deposits in Ontario tend to be found by people who read glacial history as carefully as bedrock maps. Ontario is still Canada’s largest gold producer, and its camps are changing hands: several of the best-known mines now carry new owners’ names. This guide, for claim holders, juniors, consultants and investors, covers the camps, current owners, claim and permit rules, public data and satellite screening.
For the national picture first, our guide to gold exploration in Canada compares the provincial claim systems side by side, and the Canada gold deposits by province overview places Ontario’s belts beside the rest of the country. This page stays inside Ontario.
The Hollinger mine at Timmins alone produced 19.3 million ounces of gold between 1910 and 1968.
Gold deposits in Ontario by the numbers: six years of output
The cleanest provincial figures come from the annual mineral production tables that Natural Resources Canada publishes with Statistics Canada. The 2024 table puts Ontario’s gold produced at 69,687 kilograms, against 185,555 kilograms for Canada, and values Ontario’s gold shipments at C$7.67 billion. Quebec was second at 58,259 kilograms. We use this one table series for every production figure about gold deposits in Ontario on this page, so the years compare on the same basis.
Ontario’s output has been steady rather than rising. The same tables give 79,546 kg for 2019, 70,698 kg for 2020, 74,412 kg for 2021, 76,380 kg for 2022 and 77,230 kg for 2023. A 10-tonne swing from one year to the next is normal for a province whose total depends on a dozen large mines, each with its own grade and stope sequence.
Chart
Ontario gold produced, 2019 to 2024
Tonnes of gold per year, converted from kilograms; the axis starts at 60 t
The province has the mills, roads, contractors and assay labs a producing district needs. The catch is that most obvious ground near those mills has been held for decades, so new gold deposits in Ontario tend to come from overlooked structures, deeper extensions or ground under thick glacial cover.

▶ Modern Gold Rush: why gold demand keeps explorers busy in mature districts like northern Ontario (10:44). · 10:44
Where gold deposits in Ontario sit: the camps and their mines
Nearly every large Ontario gold mine sits in Archean greenstone, the old volcanic and sedimentary belts of the Superior Province. The Ontario Mineral Inventory record for the Hollinger mine places it in Tisdale township in the Abitibi belt and links its gold to pyrite at the margins of quartz veins, in a wide zone of sericite and ankerite alteration around the Pearl Lake porphyry. That pattern of veins, carbonate alteration and porphyry contacts is the template many explorers of gold deposits in Ontario still carry into the field.
Use the table below as a starting map of gold mines in Ontario, Canada, and of who works the main gold deposits in Ontario today. Every owner was checked against the company’s own site or filings in October 2026, because mergers have renamed several of them.
| Mine or complex | Camp | Owner (checked Oct 2026) | Type and status |
|---|---|---|---|
| Porcupine Complex: Hoyle Pond, Borden, Pamour, Dome | Timmins | Discovery Mining Ltd. | Underground and open pit, producing |
| Timmins West and Bell Creek | Timmins | Pan American Silver | Underground, producing |
| Fox Complex (Froome; Stock in development) | Timmins | McEwen Inc. | Underground, producing |
| Macassa | Kirkland Lake | Agnico Eagle | Underground, producing |
| Young-Davidson | Kirkland Lake district (Powell township) | Alamos Gold | Producing |
| Detour Lake | Cochrane district | Agnico Eagle | Open pit, producing |
| Red Lake Operations | Red Lake | Evolution Mining | Underground, producing |
| Madsen | Red Lake | West Red Lake Gold Mines | Commercial production declared |
| Hemlo | Hemlo | Hemlo Mining Corp. | Producing |
| Greenstone | Geraldton | Equinox Gold | Open pit, producing |
| Musselwhite | Far northwest | Equinox Gold | Underground, producing |
Sources: company operations pages and releases linked in each section below, and the Ontario Geological Survey’s 2025 to 2026 Recommendations for Exploration for Young-Davidson’s location. Mines we could not confirm on a company or government page this month are left out.
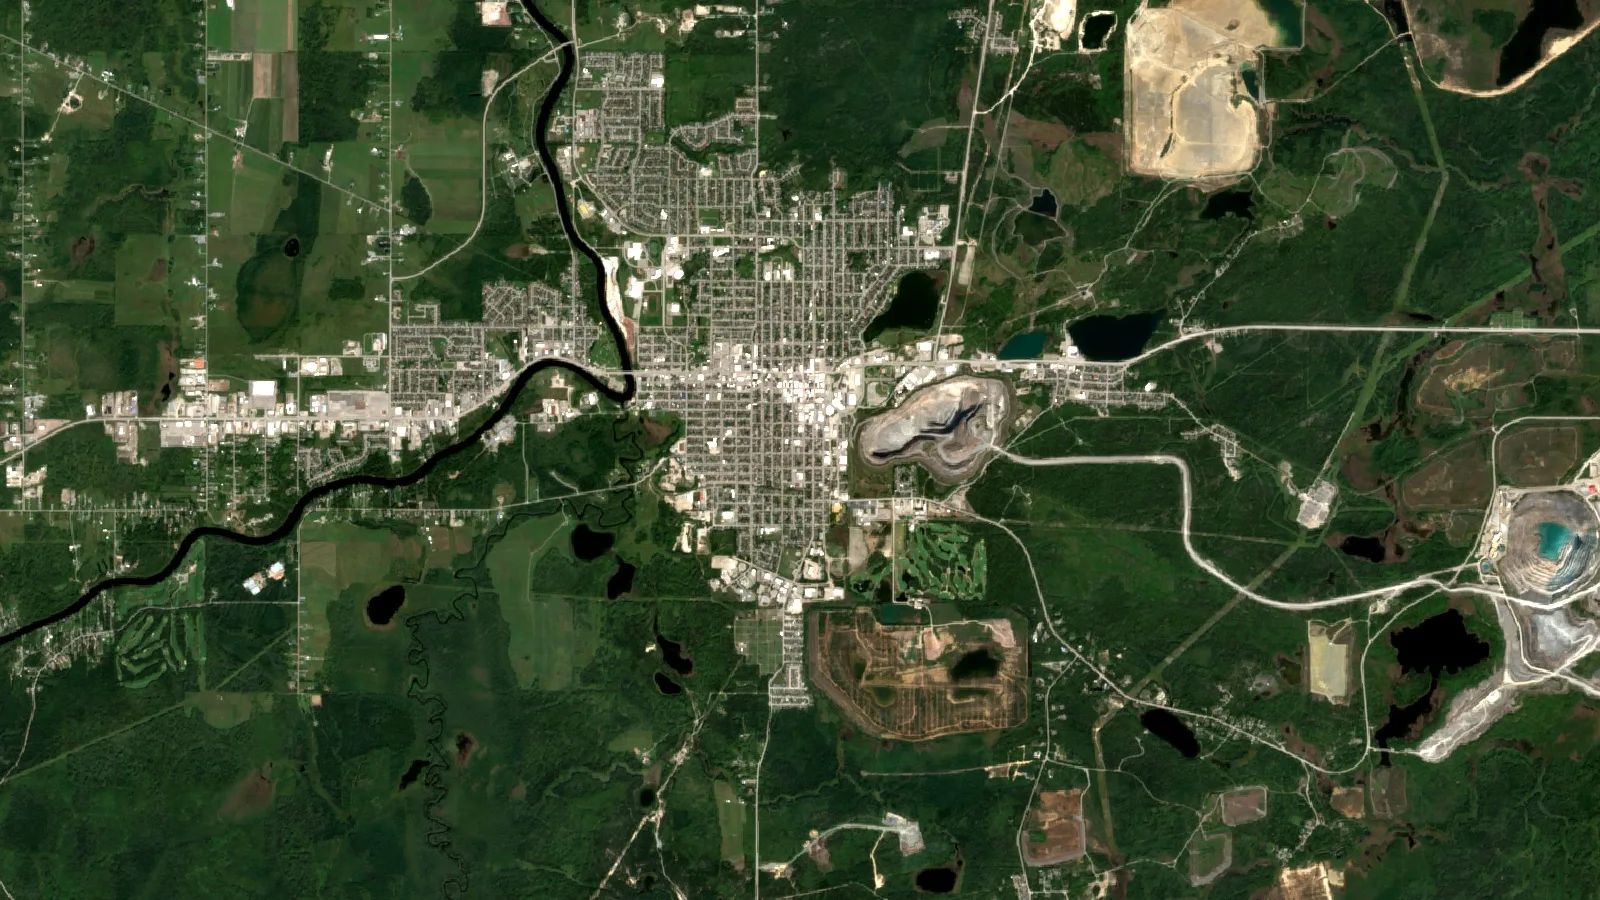
Timmins: the Porcupine camp and its mining companies
Ask for a gold mine in Timmins, Ontario and you will get several answers, because the camp has three producing groups. The largest is the old Porcupine operation. In April 2025 Discovery Silver completed its purchase of Newmont’s Porcupine Operations, so searches for “Newmont Timmins” now lead to a different company. The release lists Hoyle Pond, with more than four million ounces produced since 1987, the Borden mine, the Pamour open-pit project, the historic Dome mine and the Dome mill, and says the complex has produced about 70 million ounces since 1910. The company then changed its name to Discovery Mining Ltd., effective 29 June 2026, after adding the Kidd Operations.
The Dome mine at Timmins and the Hollinger mine are the camp’s historic anchors. The Ontario Mineral Inventory credits Hollinger with 19,327,691 ounces from 1910 to 1968, from about 65.8 million tons of ore at 0.29 ounces per ton. Pamour returned as a Porcupine open-pit project; the Hollinger record also notes Pamour Porcupine Mines Limited working the property from 1976 to 1988.
West of town, Pan American Silver’s Timmins operation consists of two underground mines, the Timmins West mine and the Bell Creek mine, both feeding the Bell Creek mill. The company gives average throughput of 4,400 tonnes a day against 5,600 tonnes of capacity, and describes a “Timmins Camp Project” to use that spare capacity. The third group is McEwen Inc. (its site still carries the McEwen Mining logo), whose Fox Complex mines Froome underground, plans first mining at Stock in the fourth quarter of 2026 and has Grey Fox at pre-feasibility. Those three are the Timmins mining companies with producing mines in the camp today.
Kirkland Lake: Macassa and the Kirkland Lake gold mines
Kirkland Lake gold mines grew along the Main Break, and one of them is still working. The Macassa mine record says Macassa started processing ore in October 1933, produced about 3.5 million ounces from 7.9 million tons of ore between 1933 and 1999 at a head grade of 0.47 ounces per ton, was suspended in 1999 when the gold price fell, and restarted underground mining in December 2002. Macassa mine at Kirkland Lake is now run by Agnico Eagle as an underground operation.
Many people still search for “Kirkland Lake Gold Inc.”; the company was Kirkland Lake Gold Ltd., and Agnico Eagle combined with it in a merger of equals on 8 February 2022, according to Agnico’s Detour Lake page. Agnico Eagle has no Timmins mine of its own among the operations it lists; its Ontario mines are Macassa and Detour Lake. A few kilometres of geology away, Alamos Gold lists Young-Davidson among its producing mines, and the Ontario Geological Survey records it as a producing mine in Powell township in the Kirkland Lake district. That makes Young-Davidson the Alamos Gold mine in Ontario most searchers mean.
Macassa produced 228,535 ounces in 2023 from ore averaging 16.47 grams per tonne.
Macassa is a useful lesson in grade. The same provincial record lists yearly output from company releases and Resident Geologist reports: 175,167 ounces in 2016 at 14.10 g/t, rising to about 241,000 ounces in 2018 and 2019 at grades above 21 g/t, then 183,037 ounces in 2020, 210,192 in 2021, 200,288 in 2022 and 228,535 in 2023.
Chart
Macassa, Kirkland Lake: gold produced per year
Thousand troy ounces, 2016 to 2023, with the average ore grade (g/t) in each label
At 31 December 2025, Agnico Eagle reports 2.2 million ounces of Proven and Probable Mineral Reserves at Macassa, plus 681,000 ounces of Measured and Indicated Mineral Resources and 1.3 million ounces of Inferred Mineral Resources. Those three numbers belong in separate boxes, a rule that applies to every one of the gold deposits in Ontario quoted on this page.
Detour Lake, Red Lake, Hemlo and the far north
Detour Lake is the opposite of Macassa: big tonnage, open pit. Agnico Eagle places Detour Lake in the Cochrane district, 185 km by road northeast of Cochrane, with 18.6 million ounces of Proven and Probable reserves at 31 December 2025. It was mined underground from 1987 to 1990 and has been an open pit since 2013, and a 2-km exploration ramp for a possible underground mine was approved in June 2024. It is the largest reserve among the gold deposits in Ontario covered here.
At Red Lake, a gold mine in Red Lake, Ontario can mean either of two producers. Evolution Mining’s Red Lake Operations, 535 km northwest of Thunder Bay, is a high-grade underground mine that Evolution bought in 2020. West Red Lake Gold Mines says its Madsen mine has reached commercial production, on a 47 km² land package, and that it also holds the 31 km² Rowan property with three past-producing mines. Together these are the Red Lake mines in Ontario, Canada, that most buyers and suppliers ask about.
The Hemlo mine in Ontario has a new owner too. Hemlo Mining Corp., trading on the TSX as HMMC, describes itself as a new mid-tier Canadian gold producer and says it acquired the Hemlo Gold Mine from Barrick. Further northwest, Equinox Gold completed its merger with Orla Mining on 31 July 2026 and now lists Musselwhite and Greenstone as its two Ontario mines.
The Musselwhite mine page describes a high-grade underground mine about 500 km north of Thunder Bay, operating since 1997, with more than 6 million ounces produced and 236,856 ounces in 2025. Equinox notes Musselwhite was one of the first mines in Canada to sign a comprehensive agreement with First Nations. Greenstone, at Geraldton about 275 km northeast of Thunder Bay, is an open pit with reserves of 5,334,000 ounces at 0.93 g/t in its 2024 technical report, and Measured and Indicated resources of 2,966,000 ounces at 1.71 g/t reported exclusive of reserves.

▶ How gold is extracted, from underground stopes like Macassa's to open pits like Detour Lake (10:34). · 10:34
Ontario gold claims in MLAS: cells, credits and the clock
Gold prospecting in Ontario starts online, whoever you are and whichever of the gold deposits in Ontario you are chasing. The province’s Mining Lands Administration System registers claims, sells and renews prospector’s licences, and offers a public Map Viewer that shows active claims without an account. Under MLAS Directive 3, you must be 18 or older to enrol, a prospector’s licence is required to register a claim, one transaction can take at most 50 single cells, and a multi-cell claim can hold at most 25 cells that share a common side.
Directive 3 also bans scripts, bots and browser add-ons for picking cells, and warns that a claim registered that way can be deleted from the registry. The ministry’s glossary defines each cell as 15 seconds of latitude by 22.5 seconds of longitude. By our arithmetic that is about 21.4 hectares (about 53 acres) at Timmins’ latitude, and less further north.
The fees are small; the work is not. The administrative fee schedule, updated 1 April 2026, lists $50 per cell to register and $40 for a five-year prospector’s licence. It also lists $20 per claim to request more time to perform and file assessment work. The ministry’s decision on ERO notice 019-6053, posted 6 June 2023, keeps the requirement at $400 of assessment work per cell each year to hold a claim in good standing, which it calls “very low” against other jurisdictions.
How assessment credits carry a claim forward
Approved work does not vanish into a single year. Ontario’s assessment credits policy explains that the minister reviews each report, assigns credits, and places them in the reserve of the land where the work was done. A claim can receive credits for the current annual unit and at most five subsequent units. Credits can also be allocated to contiguous claims held by the same holder, capped per assessment year at $50,000 from a one- or two-cell claim, $100,000 from three to five cells and $150,000 from six to 25 cells.
A payment in place of work is a narrow escape hatch. The policy allows it only on or before the due date, only after the first unit of work is done, only for the current year, and never two years running on the same claim. In practice, a holder who drills hard in year one can bank five more years of good standing on claims over gold deposits in Ontario, but cannot pay their way out of doing any work at all.
Calculator
How many years can your approved credits keep an Ontario claim in good standing?
Enter your claim’s cells and approved assessment credits (C$) to see how many assessment years they cover.
- Annual requirement (C$): $6,400
- Credits used (C$): $38,400
- Left in reserve for later years or contiguous claims (C$): $1,600
- Area in hectares, about: 342 ha
- Area in acres, about: 846 acres
All amounts are Canadian dollars (C$). Example values only, not a benchmark. Assumptions: C$400 per cell per year (Ministry of Energy and Mines decision, ERO 019-6053); credits on a claim limited to the current annual unit plus five subsequent units, so the result is capped at 6 years (assessment credits policy, O. Reg. 65/18); a multi-cell claim holds up to 25 cells (MLAS Directive 3); area uses about 21.4 ha per cell, our arithmetic from the 15 by 22.5 second provincial grid at about 48.5° N (OGS glossary). Credits only count once the ministry approves the report. Excludes registration fees and allocation caps between claims. General information, not legal advice; confirm with the Ministry of Energy and Mines.
At the defaults, a 16-cell claim needs C$6,400 of work a year. C$40,000 of approved credits covers six assessment years, and the last C$1,600 waits in the reserve. Raise the credits to C$60,000 and the answer stays at six years: the extra money cannot be credited further ahead on that claim, which is why holders often push surplus credit to neighbouring cells.
Two more MLAS details trip up newcomers. The minister can withdraw an area from prospecting and claim registration by order, and can reopen it later; the MLAS page links the current list of withdrawals and reopenings. Each year the ministry also publishes a June 1 list of lands open for registration in the Ontario Gazette, and warns that some may have mine hazards inside their boundaries.
From claim to drill pad: exploration plans and permits in Ontario
A claim lets you hold ground, not disturb it. Ontario sorts early exploration into two tiers. The province’s exploration plan activity sheet lists line cutting 1.5 metres wide or less, ground geophysics that needs a generator, mechanized stripping of less than 100 m² within a 200-metre radius, removing one to three cubic metres of bedrock, and using a drill that weighs less than 150 kilograms.
Anything bigger moves up a tier. The permit activity sheet covers line cutting wider than 1.5 metres, stripping over 100 m² within 200 metres, removing more than three cubic metres of bedrock, and any drill over 150 kilograms. For most programs on gold deposits in Ontario, the first diamond-drill hole needs a permit, not a plan.
Timing is where budgets slip. The ministry’s exploration plans and permits guide asks for a start date more than 35 days after submission for a plan and more than 55 days for a permit. A plan takes effect 30 days after circulation and lasts two years. A permit application is posted on the Environmental Registry of Ontario for 30 days, processing is expected to take 31 to 50 days from circulation, and the Director decides within 50 days.
Chart
Plans and permits: how many days each step takes
Days from circulation or submission, as published by the ministry; start-date rows are minimums (more than)
Before you submit, the guide lists three pre-conditions. You must be enrolled in MLAS. The qualified supervisor must have completed the Mining Act Awareness Program within the past five years, or MLAS will not accept the submission. And where surface rights owners exist, you must send them a notice of intent with a copy of the draft plan or permit application. Project maps must locate each activity to within 200 metres.
Consultation, surface rights and the safety basics
Once a submission is valid, the ministry circulates it to potentially affected Aboriginal communities and consults them under the Mining Act’s consultation framework, which is aimed at communities whose Aboriginal or treaty rights may be adversely affected. A permit can be placed on hold to consider concerns raised by a community, and the Director must be satisfied that appropriate consultation has happened before issuing it. A plan or permit also does not replace other approvals, such as road or water-crossing permits, Fisheries and Oceans Canada approvals for fish habitat, or Natural Resources Canada permits for explosives.
The Ontario path from map to drill, step by step
Put the pieces in order and the province’s path for gold mining in northern Ontario looks like this. Each box is drawn from the ministry pages cited above.
Infographic
From open ground to a drill hole in Ontario
- 1Check the mapThe MLAS Map Viewer shows active claims and withdrawn areas.
- 2Prospector’s licenceBuy it in MLAS for C$40 for a five-year term; applicants must be 18 or older.
- 3Register cellsC$50 a cell, up to 25 cells per multi-cell claim, and no bots.
- 4Assessment workC$400 per cell a year; credits cover up to the current year plus five.
- 5Plan or permitCirculated to Aboriginal communities; a plan takes effect on day 30, a permit decision takes 31 to 50 days.
- 6DrillA drill under 150 kg needs a plan; over 150 kg needs a permit and its conditions.
What satellites can and cannot see over gold deposits in Ontario
Most gold deposits in Ontario are hidden twice: under forest and under glacial sediment. The Ontario Geological Survey’s Recommendations for Exploration 2025 to 2026 calls drift prospecting a lower-cost method for formerly glaciated areas of thick drift such as northern Ontario, because bedrock there cannot be sampled directly. Till carries pieces of bedrock that ice eroded and moved, so geochemical and mineral signatures in till can be traced back up-ice to a possible source.
The same publication gives a till sampling standard worth copying for gold deposits in Ontario. Collect the C-horizon of the till, commonly below one metre, which is least affected by leaching and oxidation. Take one large 10 kg sample of till matrix for heavy minerals and gold grains, and a smaller 3 to 5 kg bag for geochemistry. Plot the results with an ice-flow reconstruction before you choose where to strip or drill.
Here is where satellite data earns its place. A multispectral scene cannot see a quartz vein under two metres of till. It can map outcrop windows where bedrock is exposed, glacial landforms that record ice-flow direction, lineaments that follow faults and shear zones, burn scars, roads and drill-access corridors. Those layers decide where a till grid should go and how far up-ice a gold-grain anomaly should be chased.
The OGS’s own recommended gold target shows the method in practice. It points explorers to about 8,000 hectares of gold-endowed Archean greenstone in the northwestern Sturgeon Lake belt, road accessible and largely open for claims when it was written. The belt sits under relatively thick till and vegetation, and a recent till survey there found that gold grain counts in till were an effective way to vector toward gold. Its suggested sequence: regional high-resolution geophysics, a prospectivity analysis, a surficial sampling survey, then targeted prospecting, stripping and mapping.

▶ Satellites in a northern, glaciated gold district: Alaska's ground has the same cover problems as Ontario's (11:35). · 11:35
Structure carries much of the weight. The OGS article notes that porphyritic intrusions are common in Archean gold systems, with many economic examples in Canada’s Abitibi belt, and that the intrusions often use the same zones of crustal weakness as gold-bearing fluids. A structural read from satellite and elevation data can trace those zones across a whole claim block before a geophysics crew is booked.
Public data for gold deposits in Ontario: OGSEarth, OMI, MiRRO
Ontario publishes a lot of free geoscience, and any desk study of gold deposits in Ontario should use all of it. OGSEarth serves data sets as KML for Google Earth and in GIS formats, including the Ontario Mineral Inventory, abandoned mines and geophysics, and the MLAS page points to OGSEarth for downloadable claim and tenure layers. The Ontario Mineral Inventory itself, as the Hollinger and Macassa records show, carries geology, alteration, production tables and links to assessment files for each occurrence.
The newest tool is MiRRO, Mineral Reserves and Resources of Ontario. The OGS describes it as a compilation of reported mineral resources and reserves for Ontario deposits, available as an interactive dashboard on the GeologyOntario Hub. It flags estimates made before modern standards as “Historical” so you can filter them out, and the OGS warns that inclusion in MiRRO does not guarantee an estimate’s validity.

▶ Soil geochemistry with satellite layers in another Canadian province, close in spirit to Ontario's till sampling (3:11). · 3:11
Funding is the last piece for small holders. The OGS describes the Ontario Junior Exploration Program’s prospectors stream: up to $50,000 per project, plus $15,000 from the Indigenous Participation Incentive. Applicants need a valid Ontario prospector’s licence held for at least one year, claims in good standing with the first year of assessment work filed and approved, and at least a 25% interest in the claim. The 2025 intake closed on 31 July 2025, so check the program page for the next one.
- ✔ MLAS Map Viewer: open ground, active claims, withdrawals, and circulated or active plans and permits.
- 📊 Ontario Mineral Inventory: each occurrence’s geology, status and any production history.
- 🗂️ Assessment files: past work reports, often with drill logs and assays from earlier holders.
- MiRRO: reported resources and reserves, with historical estimates flagged.
- Quaternary maps and till data: ice-flow history for any drift program.
How we screen an Ontario claim block before field season
Our job sits between the desk study and the till grid. You send the area of interest as coordinates, a KML or KMZ file, or a polygon, plus the target mineral. We pick the data source, run the analysis, and deliver in 5 to 20 business days depending on size and mineral complexity. The aim is to tell you which cells over prospective gold deposits in Ontario deserve the C$400 a year and the first field dollars, and which you can drop. Map Your Mining Site to see the area on our platform first.
Our satellite-based mineral detection reads reflected light across many wavelengths, where alteration minerals and rock types have their own spectral signatures, and processes it with our own algorithms to flag prospective zones, alteration halos, faults and fractures. Across our work we have screened more than 100,000 hectares for more than 20 minerals in more than 25 countries, and clients use it to shorten early exploration from months to days and to cut early-stage costs by up to 80 to 85%.
On Ontario ground, the honest output is a ranked set of exploration targets, not a resource. A premium report gives prospectivity heatmaps, interpreted faults and alteration, estimated location and depth ranges, and georeferenced GIS files you can load beside OGSEarth layers. The Premium+ report adds TargetMax™ drilling intelligence with suggested drill angles and 3D prospectivity models of vein structures. None of it replaces till sampling, geophysics or an NI 43-101 estimate, and we make no claim of compliance with that instrument. We also do not disturb the ground during screening.
Reading reserves and resources on an Ontario gold mine
Every Ontario gold mine in the table above reports under National Instrument 43-101, and the Ontario Geological Survey’s MiRRO article repeats the CIM definitions behind it. A Mineral Resource has reasonable prospects for eventual economic extraction. A Mineral Reserve is the economically mineable part of a Measured or Indicated resource, with dilution and losses, backed by a pre-feasibility or feasibility study. Reserves are Proven or Probable; resources are Measured, Indicated or Inferred.
Keep those boxes separate when comparing the gold deposits in Ontario. Detour Lake’s 18.6 million ounces and Macassa’s 2.2 million ounces are reserves. Macassa’s 681,000 Measured and Indicated ounces and 1.3 million Inferred ounces are resources on top. Greenstone’s 5.3 million ounces at 0.93 g/t is a reserve; its 2.97 million ounces at 1.71 g/t is a resource reported exclusive of it. Inferred ounces carry the least confidence and should never be added to reserves.
A quick way to sanity-check a junior’s claims is contained-ounce arithmetic: tonnes times grade in grams per tonne, divided by 31.1035 grams per troy ounce. The calculator below does that and applies a recovery and a gold price you choose. Kitco quoted a bid of US$4,148.70 an ounce on 15 October 2026 at 4:46 a.m. EDT; the default rounds that to US$4,150 as an example only.
Calculator
How much gold is contained and recoverable in a deposit?
Enter tonnes, grade, recovery and an example gold price to see contained and recoverable ounces.
- Recoverable at your recovery rate: 72,339 oz
- Gross value of recoverable gold before any costs (US$): $300,207,372
Example values only, not a forecast. Formula: tonnes × grade (g/t) ÷ 31.1035 = troy ounces. The gold price is in US dollars per ounce (US$, as quoted by Kitco), so the gross value is in US dollars, not C$. Example price only (Kitco bid of about US$4,149/oz, 15 October 2026); check today’s price. Gross value ignores mining, processing, royalties, taxes and capital, so it is not a valuation. Use a company’s NI 43-101 figures for tonnes and grade, and never mix reserves with resources. Not investment advice.
At the defaults, 500,000 tonnes at 5 g/t holds about 80,377 ounces, and 90% recovery leaves about 72,339 ounces. Swap in Greenstone’s reserve grade of 0.93 g/t and the same tonnage holds under 15,000 ounces, which is why open pits need tens of millions of tonnes. Change one input at a time when you read a press release, and the claim behind the headline becomes clear.
Gold deposits in Ontario: frequently asked questions
Where are gold deposits in Ontario found?
Mostly in the Archean greenstone belts of northern Ontario: the Timmins (Porcupine) and Kirkland Lake camps in the Abitibi belt, Detour Lake in the Cochrane district, Red Lake in the northwest, Hemlo, Geraldton (Greenstone) and Musselwhite in the far northwest.
Is there still gold in Ontario?
Yes. Mines on gold deposits in Ontario produced 69,687 kg of gold in 2024, about 37.6% of Canada’s total, according to the Natural Resources Canada and Statistics Canada production table. Detour Lake alone reports 18.6 million ounces of Proven and Probable reserves.
How do you stake a gold claim in Ontario?
You no longer stake on the ground. Enrol in MLAS, buy a prospector’s licence ($40 for five years), check open ground in the Map Viewer, and register cells online at $50 each. A multi-cell claim can hold up to 25 cells. Confirm current rules with the Ministry of Energy and Mines.
How much work does an Ontario gold claim need each year?
$400 of approved assessment work per cell per year. Approved credits can cover the current year plus five more on a claim, and surplus can be allocated to contiguous claims within annual caps.
Who owns the gold mines in Timmins now?
Discovery Mining Ltd. owns the Porcupine Complex (Hoyle Pond, Borden, Pamour and the Dome mine), bought from Newmont in April 2025. Pan American Silver owns the Timmins West and Bell Creek mines, and McEwen Inc. runs the Fox Complex.
Who owns the Musselwhite mine in Ontario?
Equinox Gold, after its merger with Orla Mining closed on 31 July 2026. Musselwhite is an underground mine about 500 km north of Thunder Bay that has operated since 1997.
Who owns the Hemlo mine in Ontario?
Hemlo Mining Corp. (TSX: HMMC), formerly Carcetti Capital, which acquired the Hemlo Gold Mine from Barrick.
Is Kirkland Lake Gold still a company?
No. Kirkland Lake Gold Ltd. combined with Agnico Eagle in a merger of equals on 8 February 2022. Agnico Eagle now runs the Macassa mine at Kirkland Lake and the Detour Lake mine.
Do I need a permit to drill on an Ontario claim?
For drilling on gold deposits in Ontario, a drill under 150 kg needs an exploration plan; a heavier drill needs an exploration permit. Both are circulated to potentially affected Aboriginal communities. Plans take effect 30 days after circulation, and permit decisions are expected 31 to 50 days after circulation.
Can satellites find gold in northern Ontario?
Not directly, and not through the till that covers many gold deposits in Ontario. They map outcrop, faults and shear zones, glacial landforms and access, which helps place till sampling, geophysics and drilling. Satellite targets are exploration targets, not resources.
Farmonaut mineral detection
Map your mining site from space
Send your claim or licence boundary as KML, KMZ or a polygon. Farmonaut returns ranked satellite exploration targets for it, usually in 5 to 20 business days.

Keep reading
Sources
- Natural Resources Canada / Statistics Canada, Mineral production in Canada, table G01 (2024): sead.nrcan-rncan.gc.ca
- Natural Resources Canada / Statistics Canada, Mineral production in Canada, table G01 (2023): sead.nrcan-rncan.gc.ca
- Natural Resources Canada / Statistics Canada, Mineral production in Canada, table G01 (2022): sead.nrcan-rncan.gc.ca
- Natural Resources Canada / Statistics Canada, Mineral production in Canada, table G01 (2021): sead.nrcan-rncan.gc.ca
- Natural Resources Canada / Statistics Canada, Mineral production in Canada, table G01 (2020): sead.nrcan-rncan.gc.ca
- Natural Resources Canada / Statistics Canada, Mineral production in Canada, table G01 (2019): sead.nrcan-rncan.gc.ca
- Ontario Geological Survey, Ontario Mineral Inventory record MDI42A01SE00020, Macassa (2025): geologyontario.mndm.gov.on.ca
- Ontario Geological Survey, Ontario Mineral Inventory record MDI42A06NW00007, Hollinger (2025): geologyontario.mndm.gov.on.ca
- Ontario Ministry of Energy and Mines, Mining lands fee schedule (2026): geologyontario.mndm.gov.on.ca
- Environmental Registry of Ontario, ERO 019-6053 assessment work requirement decision (2023): ero.ontario.ca
- Ontario Ministry of Energy and Mines, Assessment work credits policy, O. Reg. 65/18 (2018): geologyontario.mndm.gov.on.ca
- Ontario Ministry of Energy and Mines, Directive 3: mining claim registration in MLAS (2018): geologyontario.mndm.gov.on.ca
- Ontario Ministry of Energy and Mines, Mining lands glossary (2018): geologyontario.mndm.gov.on.ca
- Government of Ontario, Mining Lands Administration System (2025): ontario.ca
- Government of Ontario, Exploration plans and permits (2025): ontario.ca
- Ontario Ministry of Energy and Mines, Exploration plan activities sheet (2018): geologyontario.mndm.gov.on.ca
- Ontario Ministry of Energy and Mines, Exploration permit activities sheet (2018): geologyontario.mndm.gov.on.ca
- Ontario Geological Survey, Recommendations for Exploration 2025-2026 (2025): geologyontario.mndm.gov.on.ca
- Ontario Geological Survey, OGSEarth data sets (2025): geologyontario.mndm.gov.on.ca
- Agnico Eagle, Macassa operation page (2026): agnicoeagle.com
- Agnico Eagle, Detour Lake operation page (2026): agnicoeagle.com
- Discovery Silver, Completion of Porcupine Operations acquisition, news release (2025): minedocs.com
- Discovery Mining, Name change news release (2026): s21.q4cdn.com
- Pan American Silver, Timmins operations page (2026): panamericansilver.com
- McEwen Inc., Fox Complex operations page (2026): mcewenmining.com
- Alamos Gold, Operations page (2026): alamosgold.com
- Evolution Mining, Red Lake operation page (2026): evolutionmining.com.au
- West Red Lake Gold Mines, Company website (2026): westredlakegold.com
- Hemlo Mining Corp., Company website (2026): hemlomining.com
- Equinox Gold, Operating mines page (2026): equinoxgold.com
- Equinox Gold, Musselwhite mine page (2026): equinoxgold.com
- Equinox Gold, Greenstone gold mine page (2026): equinoxgold.com
- Kitco, Live gold price chart (2026): kitco.com
Discussion
Questions, corrections or field experience? Share them below. First-time comments are reviewed before they appear, and your email is never published.
No comments yet. Be the first to add a question or your experience.

 Dalgety Minerals Pty Ltd
 Vortex Minerals Pty Ltd
 Faith At Work (Pty) Ltd
 Geotech Mining Solutions plc
 Vulcan International Limited
 Kidepo Associates
 GKY Mining
 Alkimy SARL
 Double A Trading
 GemSprout Metals Limited
 Qader Group
 Ileys General Trading
 SG Gold Mining LLC
 VRV Global Pte Ltd
 Omsri International FZE
 G.I.T.T.
 Jaunita Erss Ltd
 Almosi SARL
 SRK Consulting
 Berks Gold Limited
 Mwerezi Minerals Company Limited
 Mining SARL
 SenGold Invest SAS
