

Original research · Golden Triangle, BC
Golden Triangle Exploration: Satellite Signals vs Claim Map
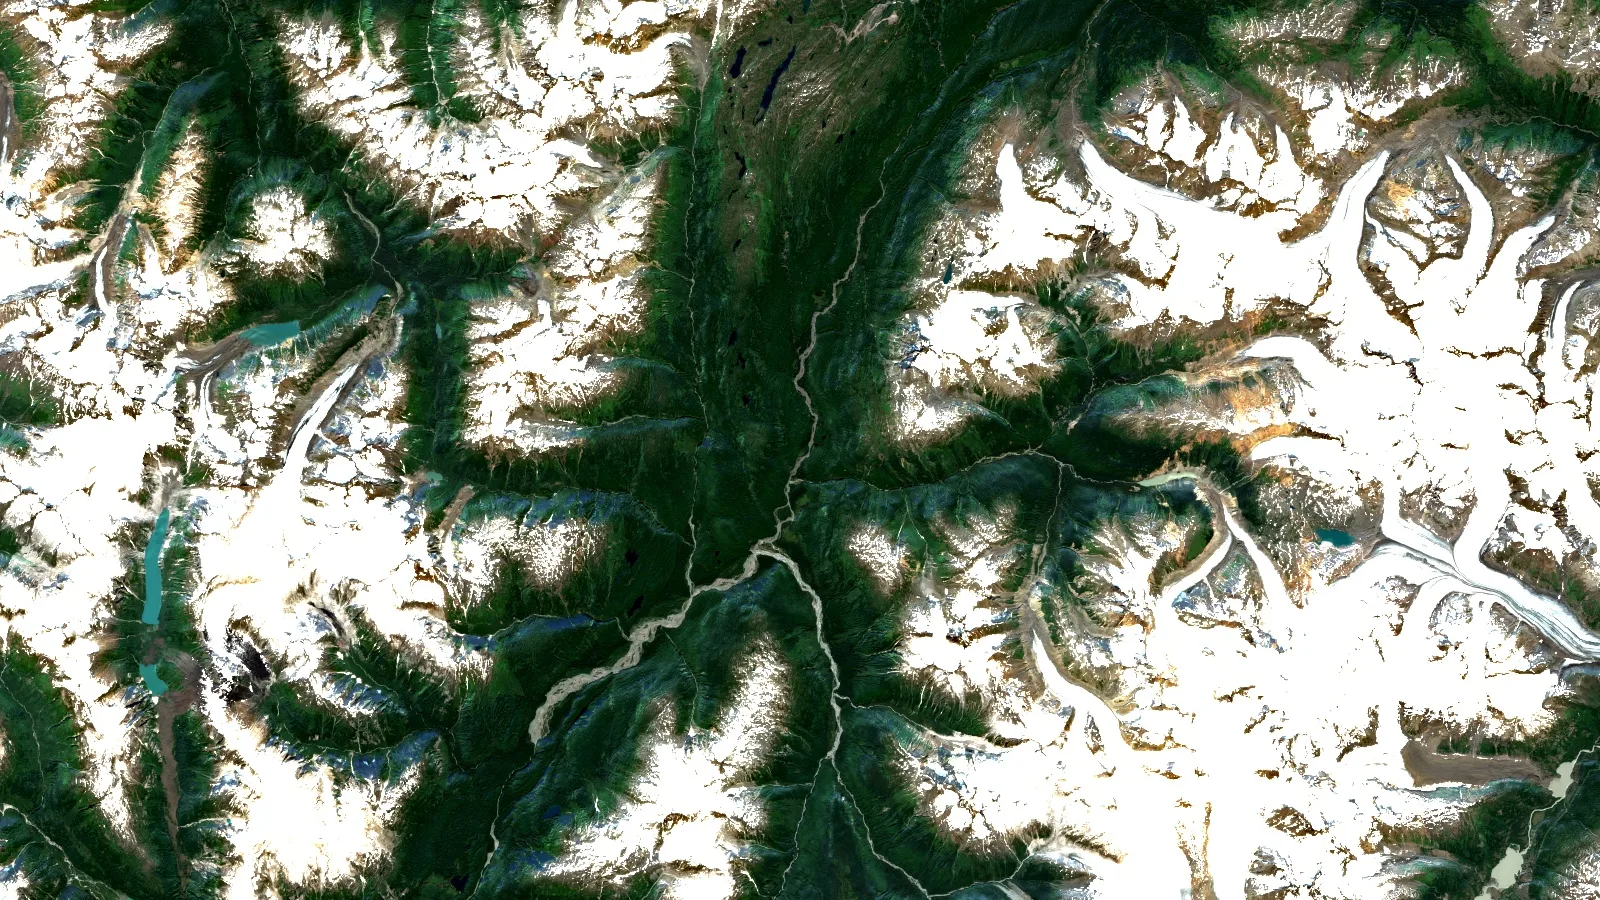
In our Sentinel-2 survey of the Iskut River sub-district, ground already under mineral claims carried about 8 times more iron-oxide indicator pixels per 100 km² of exposed rock than open Crown ground, so open ground in this part of the Golden Triangle is short on surface signals and long on cover.
Key takeaways
- Only 20.0% of our 6,853 km² Golden Triangle study area showed bare rock or soil in a five-summer Sentinel-2 composite; forest and brush covered 57.9% and 17.3% never gave a clear snow-free view.
- Ground under claims held 7.32 iron-oxide indicator pixels per 100 km² of exposed ground, against 0.89 on open Crown ground.
- The clay-hydroxyl ratio separated the two far less (5.56 vs 4.12), so we treat it as a supporting signal, not a lead one.
- 73% of pixels high on both ratios sat within 1 km of a documented MINFILE occurrence, so the method mostly re-finds known mineralised ground.
- Results are exploration indicators reported by land status and grid cell, not deposits, resources or a ranking of anyone’s claims.
In this article
- Why we ran an open-data survey of Golden Triangle exploration ground
- Study area, open data and method
- What the satellite could see across Golden Triangle exploration country
- Claimed ground versus open ground: the indicator results
- Do the indicators match known Golden Triangle exploration targets?
- Limits of a satellite survey in glaciated, forested mountains
- Using these results in a Golden Triangle exploration program
- Frequently asked questions about Golden Triangle exploration from satellites
Most writing on Golden Triangle exploration starts with the famous deposits. This page starts with a question we could answer ourselves with open data: if you take five summers of free satellite imagery over one part of the district and line it up with the public claim map, does the ground that is already staked look different from the ground that is still open? We ran that test over the Iskut River sub-district, a 1° by 1° block of northwest British Columbia, and report the Golden Triangle exploration results only in aggregate.
For the district’s deposit styles, spending and the field season, read our overview of gold exploration in Canada; for claim systems in other countries, the mining cadastre portal guide by country. Here we stay with one study area and one method, and we show the numbers behind every chart.
The Golden Triangle is the popular name for a loosely defined region.” British Columbia Geological Survey, Information Circular 2023-05
Why we ran an open-data survey of Golden Triangle exploration ground
The BC Geological Survey describes the Golden Triangle as the popular name for a loosely defined region that includes most of the major gold, silver and copper deposits in west-central Stikinia. That loose boundary matters for anyone doing Golden Triangle exploration from a desk. There is no official polygon to clip to, the ground is steep and partly ice-covered, and the claim map changes every week. A fair question for a land manager is simple: how much of the open ground left in the district still shows the kind of surface alteration that satellites can detect?
We could not answer that for the whole belt in one pass without running into very large downloads and long processing times, so we narrowed the area. The study box runs from 56° to 57° north and 130° to 131° west. It takes in the eastern half of NTS map sheet 104B, the Iskut River sheet, and covers about 6,853 km². It holds 619 documented MINFILE occurrences and, on the day we downloaded the tenure layer, 1,641 mineral and placer titles that touch the box. That makes it a busy, representative piece of Golden Triangle exploration country, but not the whole district.
Three rules shaped the work. We used only open data that anyone can download. We dropped every holder name, client number and tenure number before analysis, so the results cannot be traced to a company or a person. And we report by land status (claimed, open, protected) and by grid cell, never by claim.

▶ Video (3 min 11 s): how satellite, soil and geochemical data are combined when looking for copper and gold in British Columbia. · 3:11
Study area, open data and method
The Golden Triangle exploration inputs we used are listed below. Every file, script and result table is saved with the study so the run can be repeated. We pulled the vector layers from the DataBC web feature service on 15 October 2026 and kept only the fields needed for aggregation: tenure type, title type, area and good-to date for claims; designation for parks; status, deposit class and first commodity for MINFILE.
| Input | What we used | Where it comes from |
|---|---|---|
| Study area | 56.0 to 57.0° N, 130.0 to 131.0° W, about 6,853 km² (eastern half of NTS map sheet 104B, Iskut River) | Chosen by us; a named sub-district of the Golden Triangle rather than the whole belt |
| Imagery | 147 Sentinel-2 Level-2A granules, 15 July to 30 September, 2021 to 2025, granule cloud under 40% | Copernicus Sentinel-2 surface reflectance in Google Earth Engine |
| Mineral tenure | 1,641 mineral and placer titles intersecting the box (1,582 mineral, 59 placer); geometry and type only | DataBC mineral, placer and coal tenure layer |
| Protected land | Three provincial parks and one ecological reserve intersecting the box | DataBC parks, ecological reserves and protected areas |
| Known occurrences | 619 MINFILE occurrences inside the box (showings, prospects, developed prospects, past producers) | BC MINFILE open data |
| Glacier check | Glacier outlines, to explain pixels with no clear view | GLIMS glacier database in Earth Engine |
Building the late-summer composite
Sentinel-2 carries a 13-band instrument with four bands at 10 m, six at 20 m and three at 60 m, and a 290 km swath. The two shortwave-infrared bands that respond to clay and other hydroxyl-bearing minerals are 20 m bands. We took every Level-2A granule over the box from 15 July to 30 September in 2021 to 2025 with granule cloud under 40%, 147 granules in all. In each one we removed pixels that the scene classification layer flags as cloud shadow, cloud, cirrus or snow and ice (classes 3, 8, 9, 10 and 11). The per-pixel median of what remained gave a single late-summer picture. The median pixel had 31 clear looks; the 10th percentile had 7.
We then resampled to a 60 m grid in UTM zone 9. That is coarser than the native bands and was a deliberate choice: it kept the download modest for a 6,853 km² box and smooths out single-pixel noise on steep slopes. It also means a single indicator pixel covers 0.36 ha, so narrow veins and small gossans are below what this survey can resolve.
Masking what is not rock
On Golden Triangle exploration ground, a ratio is only meaningful over bare rock. We set aside water (normalised difference water index above 0.1), any snow left after masking (normalised difference snow index above 0.4), vegetation (NDVI above 0.3) and very dark pixels. Whatever was left we call exposed rock and soil. Those thresholds are common starting points rather than calibrated values for this district, and we say more about their effect in the limits section.
Two simple alteration ratios
We used two band ratios that suit early Golden Triangle exploration and that the remote-sensing literature has long used for alteration mapping. Red over blue (B4/B2) rises with ferric iron oxides such as hematite, goethite and jarosite, the colours of a gossan. SWIR-1 over SWIR-2 (B11/B12) rises where minerals with aluminium-hydroxyl or magnesium-hydroxyl bonds absorb near 2.2 µm, which includes clays, sericite and chlorite. A study of Sentinel-2’s potential for geological applications by van der Meer and colleagues in Remote Sensing of Environment discusses which mineral groups these bands can and cannot separate.
A pixel counts as a ferric or clay indicator when its ratio is in the top 5% of all exposed pixels in the study area. A combined indicator is a pixel in the top 10% on both ratios at once. Percentile thresholds make the result relative to this box: they show where the box is unusual, not where any absolute mineral content is reached.
Infographic
How the survey was built, step by step
- 1Pull open dataDataBC tenure, parks and MINFILE layers, names dropped.
- 2Build a composite147 Sentinel-2 granules, mid-July to September, 2021 to 2025.
- 3Mask coverRemove cloud, shadow, snow, water and vegetation.
- 4Score indicatorsB4/B2 and B11/B12 ratios, top 5% and top 10%.
- 5Aggregate and checkSum by land status and grid cell; compare with MINFILE.
What the satellite could see across Golden Triangle exploration country
The first result is about cover rather than minerals. Only 20.0% of the study box, about 1,371 km², was exposed rock or soil in the late-summer composite. Vegetation took 57.9%. Lakes and rivers took 4.4%. And 17.3% of the box never produced a clear, snow-free look in five summers.
Chart
What a late-summer satellite composite can read
Share of the 6,853 km² study area in each surface class (%)
We checked what those blind pixels are. When we compared them with mapped glacier outlines from the GLIMS glacier database, 87.6% of them fell inside a glacier; mapped glaciers cover 21.4% of the box. So most of the blind ground is ice that stays white all summer, not persistent cloud. For Golden Triangle exploration that is a useful planning number: in this sub-district about one-fifth of the map is rock you can read from orbit, about three-fifths is green, and most of the rest is under ice.
Ground under claims was slightly more exposed than open ground: 21.7% against 17.0%. Open ground carried more vegetation (67% against 52%), which fits a simple picture of lower, greener valleys being less staked than alpine ridges.
Calculator
How much of a claim block can Sentinel-2 actually read?
Enter your block’s area, exposed share and pixel size.
- Readable ground in acres: 268.1 acres
- Hidden by vegetation, ice, water or cloud: 391.5 ha
- Indicator pixels over readable ground: 2,713 pixels
The default exposed share is the 21.7% our survey measured across ground under mineral claims in the study area (Sentinel-2 late-summer composite, 2021 to 2025); the study-area average was 20.0%. 1 ha = 2.47105 acres. Sentinel-2 SWIR bands are 20 m pixels (ESA). Replace the share with your own figure. Readable ground is where indicators can be computed, not where mineralisation is. No money is involved in this calculator.
At the defaults, a 500 ha block with the claimed-ground average of 21.7% exposure gives about 108.5 ha of readable ground, or roughly 2,700 Sentinel-2 SWIR pixels. Drop the exposed share to 10% for a forested valley block and the readable area halves. That is the honest size of a desk screen on most Golden Triangle exploration ground, and it is why ground crews still matter.

▶ Video (2 min 47 s): how geophysics, hyperspectral imagery and lidar are combined to rank zones on a British Columbia gold property. · 2:47
Claimed ground versus open ground: the indicator results
This is the core of the study and the part most relevant to Golden Triangle exploration land teams. For each land-status zone we counted indicator pixels and divided by that zone’s exposed ground, so a zone is not rewarded just for being bigger or barer. The results are in the table and the chart below.
| Land status | Area (km²) | Share of study area | Exposed rock and soil | Ferric indicator per 100 km² exposed | Clay indicator per 100 km² exposed | Both indicators per 100 km² exposed |
|---|---|---|---|---|---|---|
| Under mineral and placer claims | 4,024 | 58.7% | 21.7% | 7.32 | 5.56 | 1.98 |
| Open Crown ground | 2,581 | 37.7% | 17.0% | 0.89 | 4.12 | 0.08 |
| Provincial parks and ecological reserve | 249 | 3.6% | 23.7% | 1.17 | 3.22 | 0.05 |
| Whole study area | 6,853 | 100.0% | 20.0% | 5.0 | 5.0 | 1.29 |
Table: Farmonaut analysis of a Sentinel-2 L2A late-summer composite (2021 to 2025, 60 m grid) against DataBC tenure and protected-area layers downloaded 15 October 2026. Crown-granted mineral claims outside current tenure covered under 1 km² and are left out of the table. Figures are pixel counts converted to area, not mineralisation.
Three findings stand out. First, iron oxide is strongly concentrated in claimed ground. Claims held 7.32 ferric indicator pixels per 100 km² of exposed ground; open Crown ground held 0.89, about 8 times fewer. Claims cover 64% of the box’s exposed ground but 93% of its ferric indicator area.
Second, the clay ratio barely separates the zones. Claims carried 5.56 clay indicator pixels per 100 km² exposed against 4.12 on open ground, a ratio of about 1.3. Claims hold 71% of clay indicator area, not far above their share of exposed ground. With only two broad SWIR bands, Sentinel-2’s clay ratio also responds to lithology, wet soil and thin vegetation, so on its own it is noisy.
Chart
Alteration indicators by land status
Top-5% indicator pixels per 100 km² of exposed ground: ferric (B4/B2) vs clay (B11/B12)
Third, where both ratios are high at once, the contrast is extreme. Claims held 1.98 combined indicator pixels per 100 km² exposed; open ground held 0.08, and parks 0.05. In area terms, 98% of the combined-indicator ground in the box is already under claims.
Each of the satellites in the Sentinel-2 mission carries a single payload.” European Space Agency, Sentinel-2 mission
What the contrast does and does not mean
It would be easy to read this as “the open ground is barren”. That is not what the numbers say. Prospectors and companies tend to stake first around the most visible gossans and colour anomalies, which are the very features these ratios pick up. The contrast mostly shows that the visible, easy surface targets in this sub-district were found and staked long ago. Open ground may still hold mineralisation under vegetation, till, scree or ice, where a multispectral satellite has nothing to measure.
For Golden Triangle exploration teams looking at open ground, that shifts the job. A desk screen on open ground here is less about finding the obvious red hillside and more about the few faint signals left, the structures that connect them and the cover that hides the rest. Open ground with a combined indicator is rare in this box, which makes each one worth a second look.
Do the indicators match known Golden Triangle exploration targets?
An indicator method is only useful if it agrees with what geologists already know. BC’s MINFILE database documents about 16,200 metallic, industrial mineral and coal occurrences across the province; 619 of them fall inside our box. We measured how much of each class of pixel sits within 1 km of any of those occurrences.
The baseline is 16.6% for the box as a whole and 21.4% for exposed ground. Ferric indicator pixels rose to 31.7% and clay indicator pixels to 37.3%. Combined indicator pixels reached 73.0%. In plain words, nearly three in four pixels that are high on both ratios lie within a kilometre of a documented showing, prospect or past producer.
Chart
Pixels within 1 km of a MINFILE occurrence
Per cent of each pixel class within 1 km of one of the 619 documented occurrences in the study area
For Golden Triangle exploration, that agreement is reassuring for the method and sobering for anyone hoping a free composite will reveal untouched targets. It also gives a practical filter. A combined indicator more than a kilometre from any MINFILE point, on open ground, is unusual in this box and deserves a look at the geology map, the assessment-report index and the slope before it is dismissed as noise.
The pattern by grid cell
We also split the box into 50 cells of 0.1° latitude by 0.2° longitude, roughly 11 by 12 km each, and scored the 49 cells with at least 5 km² of exposed ground. Cells are labelled by position only. Across those cells, the share of a cell under claims and its density of combined indicators moved together strongly (Spearman rank correlation 0.72). The number of MINFILE occurrences in a cell showed a similar link (0.65).
Chart
More claims, more combined indicators
Median combined-indicator pixels per 100 km² exposed, by share of each 0.1° x 0.2° cell under claims (16, 5, 2 and 26 cells)
Most cells in this box are either heavily staked (26 cells with 75% or more under claims) or lightly staked (16 cells under 25%). The median combined-indicator density in heavily staked cells was 0.80 per 100 km² of exposed ground, against 0.05 in lightly staked cells. For Golden Triangle exploration, the picture matches the zone results: surface-visible alteration and staking go together.
Limits of a satellite survey in glaciated, forested mountains
Every Golden Triangle exploration number on this page carries the limits below. They are not small print; they set how far the results can be pushed.
- Cloud and season. We used only mid-July to September scenes, when snow is lowest. The median pixel still had 31 clear looks, but the poorest tenth had 7 or fewer, and steep north faces stay in shadow for much of the day.
- Snow and ice. 17.3% of the box gave no clear view, and 88% of that was inside mapped glaciers. Ground under ice is invisible, and newly exposed ground near ice margins changes from year to year.
- Vegetation. Forest and brush covered 57.9% of the box. Below the treeline, optical satellites see the canopy, not the rock.
- Glacial cover and scree. Till, moraine and talus can carry iron staining far from its source, and can bury bedrock alteration. A ratio high on a moraine may be a transported signal.
- Pixel size. At our 60 m analysis grid, one pixel is 0.36 ha. Veins, narrow shears and small gossans are much smaller and are averaged away.
- Two broad SWIR bands. Sentinel-2 cannot tell kaolinite from sericite or chlorite. The clay ratio is a group signal and it overlaps with lithology and wet ground.
- Relative thresholds. The top-5% and top-10% cut-offs are relative to this box. Change the box and the thresholds move.
- Tenure is a snapshot. The claim layer is as downloaded on 15 October 2026. Claims lapse and new ones are registered constantly.
Two improvements would sharpen a second Golden Triangle exploration pass. Hyperspectral imagery separates individual alteration minerals far better than two broad SWIR bands, and a terrain correction would reduce the slope and shadow effects that matter so much in this relief. Neither changes the main finding, which rests on the ferric ratio and the MINFILE cross-check.
Using these results in a Golden Triangle exploration program
What should a Golden Triangle exploration manager take from a district-scale indicator survey? Three practical points.
Use the indicators to triage, not to stake. A combined indicator on open ground is a reason to pull the geology map, MINFILE and the assessment-report index for that cell, not a reason to register a claim on its own. The BC Geological Survey’s MapPlace, MINFILE and ARIS databases can be queried together, which makes the check quick.
Budget the blind ground. In this box about four-fifths of the area cannot be read from a multispectral satellite in summer. A Golden Triangle exploration budget for open ground should assume that most targets will come from geology, structure, geochemistry and geophysics, with satellite indicators covering only the bare ridges and cirques.
Check the claim map and the consultation step before spending. Since 25 March 2025, BC claim registration runs through the Mineral Claims Consultation Framework on Mineral Titles Online. The BC Geological Survey’s 2025 review says the framework requires the Ministry to consult impacted First Nations on claim applications before the Chief Gold Commissioner decides whether a claim may be registered. The same review records 1,254,146 ha of mineral claims registered in 2025, down 845,628 ha from 2024.
Holding cost of a claim while you test it
Golden Triangle exploration claims, like all BC mineral claims, are held by doing work. The Mineral Tenure Act Regulation sets mineral cell claim registration at C$1.75 per hectare and requires exploration and development worth C$5 per hectare in each of the first two anniversary years, C$10 in years three and four, C$15 in years five and six and C$20 after that. The calculator below adds those up for a block and a holding period of your choice.
Calculator
What does it cost to register and hold a BC mineral claim?
Enter claim area and years held. Amounts in Canadian dollars (C$).
- Registration at C$1.75/ha (C$): $875
- Exploration and development work required (C$): $10,000
Canadian dollars (C$). Mineral Tenure Act Regulation (B.C. Reg. 529/2004) as published October 2026: mineral cell claim registration C$1.75 per hectare; required work C$5/ha in each of anniversary years 1 and 2, C$10/ha in years 3 and 4, C$15/ha in years 5 and 6 and C$20/ha after that. Excludes the free miner certificate, payment instead of work, document fees, consultation time under the Mineral Claims Consultation Framework, permits and field costs. General information, not legal advice; confirm with the BC Ministry of Mining and Critical Minerals.
At the defaults, a 500 ha claim held for three anniversary years needs C$875 to register and C$10,000 of registered work, C$10,875 in all. Hold it for seven years and the work requirement climbs to C$40,000. That rising cost is one reason triage matters: a desk screen that drops weak ground early keeps the work budget on the best targets.
How Farmonaut fits
For Golden Triangle exploration, our satellite mineral detection work uses the same kind of reflected-light analysis shown here, with more spectral data, structural interpretation and our own algorithms, on a client’s area of interest. A client sends coordinates, a KML or KMZ file or a polygon, plus the target minerals, and we deliver in 5 to 20 business days depending on size and complexity. We have scanned more than 100,000 hectares across 20+ mineral types in 25+ countries. Results are exploration targets ahead of any resource estimate; they do not replace mapping, sampling or a qualified person’s work. Early-stage screening of this kind can cut exploration timelines from months to days and lower early-exploration cost by up to 80 to 85%.
Frequently asked questions about Golden Triangle exploration from satellites
What is Golden Triangle exploration?
It is mineral exploration in the loosely defined Golden Triangle of northwest British Columbia, the part of west-central Stikinia that holds most of the region’s major gold, silver and copper deposits. There is no legal boundary, so each study has to define its own area.
Can satellites find gold in the Golden Triangle?
No satellite sees gold directly. Multispectral sensors such as Sentinel-2 detect surface alteration, like iron oxides and clay-group minerals, that often surrounds mineralised systems. In our survey those indicators sat near known occurrences most of the time, which makes them useful for triage but not proof of a deposit.
How much of the Golden Triangle can a satellite actually see?
In our 6,853 km² Golden Triangle exploration study area, 20.0% was exposed rock or soil in a five-summer late-season composite. Vegetation covered 57.9%, and 17.3% gave no clear snow-free view, mostly because it is under glacier ice.
Is there still open ground with alteration in the Golden Triangle?
Some, but much less than on claimed ground. Open Crown ground in our box carried 0.08 combined indicator pixels per 100 km² of exposed ground, against 1.98 under claims. Open ground may still be prospective under cover, where satellites cannot measure it.
Which Sentinel-2 band ratios are used for alteration mapping?
Two common ones are red over blue (B4/B2) for ferric iron oxides and SWIR-1 over SWIR-2 (B11/B12) for clay and other hydroxyl-bearing minerals. They are simple, quick and open, but Sentinel-2’s two broad SWIR bands cannot separate individual clay minerals.
Why not use ASTER for Golden Triangle alteration mapping?
ASTER’s shortwave-infrared detectors failed in 2008, and NASA says SWIR data acquired since April 2008 are not usable. Archive scenes still exist but show older surface conditions, before years of ice retreat.
Where can I check BC mineral claims and known occurrences?
Mineral Titles Online is the provincial registry for claims. The DataBC catalogue offers the tenure layer, MINFILE occurrences and protected areas as open data, and the BC Geological Survey’s MapPlace lets you view them together with geology and assessment reports.
How much does it cost to hold a mineral claim in BC?
Registration of a mineral cell claim is C$1.75 per hectare, and the holder must register exploration and development work each year: C$5/ha in years one and two, rising to C$20/ha after year six, under the Mineral Tenure Act Regulation as published October 2026. Confirm current fees with the province.
Can I explore in parks in the Golden Triangle?
No, not without Cabinet authorization. Section 21 of the Mineral Tenure Act bars locating a mineral title, exploring or producing minerals in a park unless the Lieutenant Governor in Council authorizes it.
Does this survey rank companies or claims?
No. We removed holder names and title numbers before analysis and report only by land status and by grid cell. The results describe ground, not owners, and are not investment advice.
General information, not legal, tax or investment advice; confirm with your advisers and the BC Ministry of Mining and Critical Minerals. Satellite indicators are exploration indicators, not deposits, resources or reserves. Farmonaut results are exploration targets ahead of any resource estimate.
Farmonaut mineral detection
Screen your Golden Triangle block from space
Send your claim boundary as KML, KMZ or a polygon. Farmonaut returns satellite exploration targets for it, usually in 5 to 20 business days.

Keep reading
Sources
- BC Geological Survey, Information Circular 2023-05, Golden Triangle (2023): cmscontent.nrs.gov.bc.ca
- BC Geological Survey, Paper 2026-02, Exploration and mining in British Columbia, 2025 (2026): cmscontent.nrs.gov.bc.ca
- BC Geological Survey, Information Circular 2026-03, MapPlace, MINFILE and ARIS (2026): cmscontent.nrs.gov.bc.ca
- DataBC, Mineral, placer and coal tenure spatial view (downloaded 2026): catalogue.data.gov.bc.ca
- DataBC, MINFILE mineral occurrence database (downloaded 2026): catalogue.data.gov.bc.ca
- DataBC, Parks, ecological reserves and protected areas (downloaded 2026): catalogue.data.gov.bc.ca
- Province of British Columbia, Mineral Tenure Act (consolidated 2026): bclaws.gov.bc.ca
- Province of British Columbia, Mineral Tenure Act Regulation, B.C. Reg. 529/2004 (consolidated 2026): bclaws.gov.bc.ca
- Province of British Columbia, Mineral Titles Online, MCCF notice (2025): mtonline.gov.bc.ca
- Government of British Columbia, Mineral Tenure Act reform engagement (2025): engage.gov.bc.ca
- Tahltan Central Government, Our territory (2026): tahltan.org
- European Space Agency, Sentinel-2 mission, SentiWiki (2026): sentiwiki.copernicus.eu
- Google Earth Engine, Harmonized Sentinel-2 MSI Level-2A catalogue (2026): developers.google.com
- van der Meer et al., Potential of ESA's Sentinel-2 for geological applications, Remote Sensing of Environment 148 (2014): doi.org
- NASA Earthdata, ASTER SWIR anomaly (updated 2025): earthdata.nasa.gov
- Google Earth Engine, GLIMS glacier outlines catalogue (2026): developers.google.com
Discussion
Questions, corrections or field experience? Share them below. First-time comments are reviewed before they appear, and your email is never published.
No comments yet. Be the first to add a question or your experience.

 Vulcan International Limited
 Kidepo Associates
 GKY Mining
 Alkimy SARL
 Double A Trading
 GemSprout Metals Limited
 Qader Group
 Ileys General Trading
 SG Gold Mining LLC
 VRV Global Pte Ltd
 Omsri International FZE
 G.I.T.T.
 Jaunita Erss Ltd
 Almosi SARL
 SRK Consulting
 Berks Gold Limited
 Mwerezi Minerals Company Limited
 Mining SARL
 SenGold Invest SAS
 Sean Mining Limited
