

Customer case study · Winter wheat
Winter Wheat Monitoring in Lithuania: Septoria and Aphids
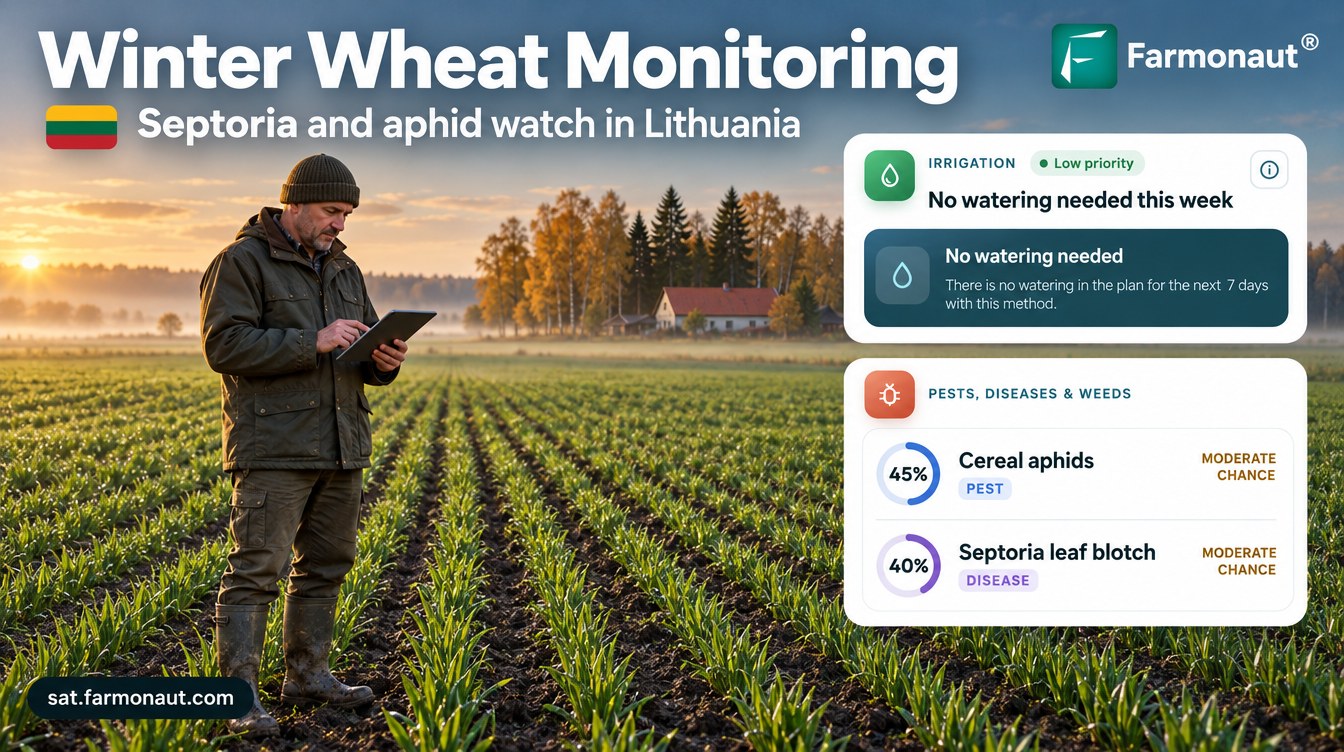
Winter wheat monitoring by satellite rated cereal aphids at 45% and Septoria leaf blotch at 40% as a 15-hectare field in Tauragė County, Lithuania, emerged in October, after the previous crop’s Septoria score ran at 79–84% through heading and grain fill.
Key takeaways
- A winter wheat grower in Tauragė County, Lithuania, received 44 satellite advisories for a 15.1 ha (37.3-acre) field from May to October 2026, covering two crops.
- At emergence (BBCH 00–13) in October, NDVI was 0.24–0.30, within the normal range, with cereal aphids scored at 45% and Septoria leaf blotch at 40%.
- The previous crop’s Septoria score averaged 84% in May and 79% in June; head blight averaged 95% and 93%.
- On the stubble, Septoria scores stayed near 50%, matching the stubble-borne spores that start new infections.
- The plan left 87% of 157 days dry, and every one of 41 nutrient recommendations came with an organic option.
In this article
- The farm and the brief
- Why winter wheat matters in Lithuania
- How winter wheat monitoring works on this field
- Two crops in one field: the season timeline
- Septoria leaf blotch risk by stage
- The first leaves: what the emergence advisory flagged
- Water: a rainfed crop with a light plan
- Nutrition and soil
- Contrast: a harvested wheat crop in Tajikistan
- What other wheat growers can take from it
- FAQ
Winter wheat monitoring by satellite gave a grower in Lithuania’s Tauragė County a risk score for each threat from the very first leaves. On a 15-hectare field that emerged in October, the advisory rated cereal aphids at 45% and Septoria leaf blotch at 40% at emergence (BBCH 00–13), with NDVI at 0.24–0.30, inside the normal range for that stage. In the season before, the same field’s Septoria score ran at 79–84% through heading and grain fill in May and June.
This case study follows 44 advisories sent for the field from May to October 2026. That covers the end of one winter wheat crop and the start of the next. It shows what the satellite saw, what each advisory recommended, and how other cereal growers can use the same data. All figures come from the grower’s advisory records. Risk scores are modelled probabilities, not confirmed infections, water figures are planned amounts, not metered use, and yields are estimates.
The farm and the brief
The grower farms winter wheat on flat arable land in Tauragė County, in western Lithuania. The monitored field is 37.3 acres, or about 15.1 hectares. It was drawn once in the Farmonaut app in May 2026, and a new advisory has arrived every few days since then.
Where the wheat field is
Tauragė County shaded; the marker shows the approximate area only
A winter wheat field in this part of the Baltic spends about ten months in the ground. It is sown in late September, sits through a winter when the January mean at the nearby Laukuva station is −3.2°C, and ripens the next summer. This field’s previous crop had ripened by late July. That long season gives fungal diseases and aphids many chances to build up. The grower wanted one screen that showed crop vigour, disease and pest risk, weeds and nutrients for the field, so that scouting time went where it mattered.
| Item | Detail |
|---|---|
| Region | Tauragė County, western Lithuania |
| Crop | Winter wheat |
| Field size | About 15.1 ha (37.3 acres) |
| Water | Mainly rainfed, sprinkler as a backup |
| Monitoring period | May to October 2026 |
| Advisories | 44, covering two crops |
| Soil (modelled) | pH 6.2 to 6.5, low salinity, organic carbon rated low |
| Contrast farm | 6 irrigated wheat fields, northern Tajikistan |
Why winter wheat matters in Lithuania
Winter wheat is the backbone of Lithuanian arable farming. Eurostat’s crop production table shows the country grew 814,730 hectares of common winter wheat and spelt in 2025, which gave 4.53 million tonnes at an average 5.56 tonnes per hectare. The first 2026 figures in the same table show 793,780 hectares and 4.76 t/ha.
Yields move a lot from year to year. Over the eight harvests from 2018 to 2025 the national average ranged from 4.30 to 5.65 t/ha. The AHDB lists wet weather in May and June among the high-risk factors for Septoria, so a wet early summer can cost yield twice. A field that can be watched closely through those weeks has a better chance of reaching the top of that range.
Chart
Lithuania: average winter wheat yield
Common winter wheat and spelt, tonnes per hectare, 2018–2025
How winter wheat monitoring works on this field
Each advisory starts with fresh satellite images of the field. The Sentinel-2 satellites have a revisit time of five days from their two-satellite constellation, with 10-metre detail in the visible and near-infrared bands. From these bands the system works out vegetation indices such as NDVI, which compares red and near-infrared light reflected by the land surface to show how much green leaf is present.
Infographic
How each field advisory is built in 4 steps
- 1Satellite passSentinel-2 images the field every few days; Sentinel-1 radar reads soil moisture through cloud.
- 2Read the canopyNDVI and water indices show leaf cover and moisture across the field.
- 3Add stage and climateThe growth stage and local conditions set disease, pest and water risk.
- 4Field planWater, risk scores, weeds, nutrients with organic options, soil and a yield estimate.
In this record, NDVI readings were often missing in autumn because of cloud. For that reason the system also uses radar. Sentinel-1 radar can observe the surface at any time of day or night, regardless of weather, so the field still gets a radar soil moisture reading when the camera only sees cloud.
The images are combined with the field’s growth stage, the local climate and the crop’s known needs. The result is one advisory with six parts: an irrigation plan for the next seven days, pest and disease risk scores, weed risk, a fertilizer plan with organic options, a soil summary and a yield estimate.
Two crops in one field: the season timeline
The first advisory arrived in mid-May 2026, when the previous crop was already heading. The record then runs through grain fill, harvest and stubble, and on to the new crop’s emergence in October. Where the stage label in a single advisory did not match the satellite reading, we used the stage that the canopy data and the neighbouring advisories supported.
| Months | Stage | What the advisories focused on |
|---|---|---|
| Mid-May to June | Heading to grain fill | Septoria, head blight and grain aphid at their peak |
| July | Ripening and harvest | Risks fell as the crop dried down |
| August to September | Stubble after harvest | Spores on residue, slugs, grain weevil in store, volunteer wheat |
| Late September | New crop sown | Clean seedbed, volunteer control |
| October | Emergence (BBCH 00–13) | Aphids, frit fly and early Septoria on the first leaves |
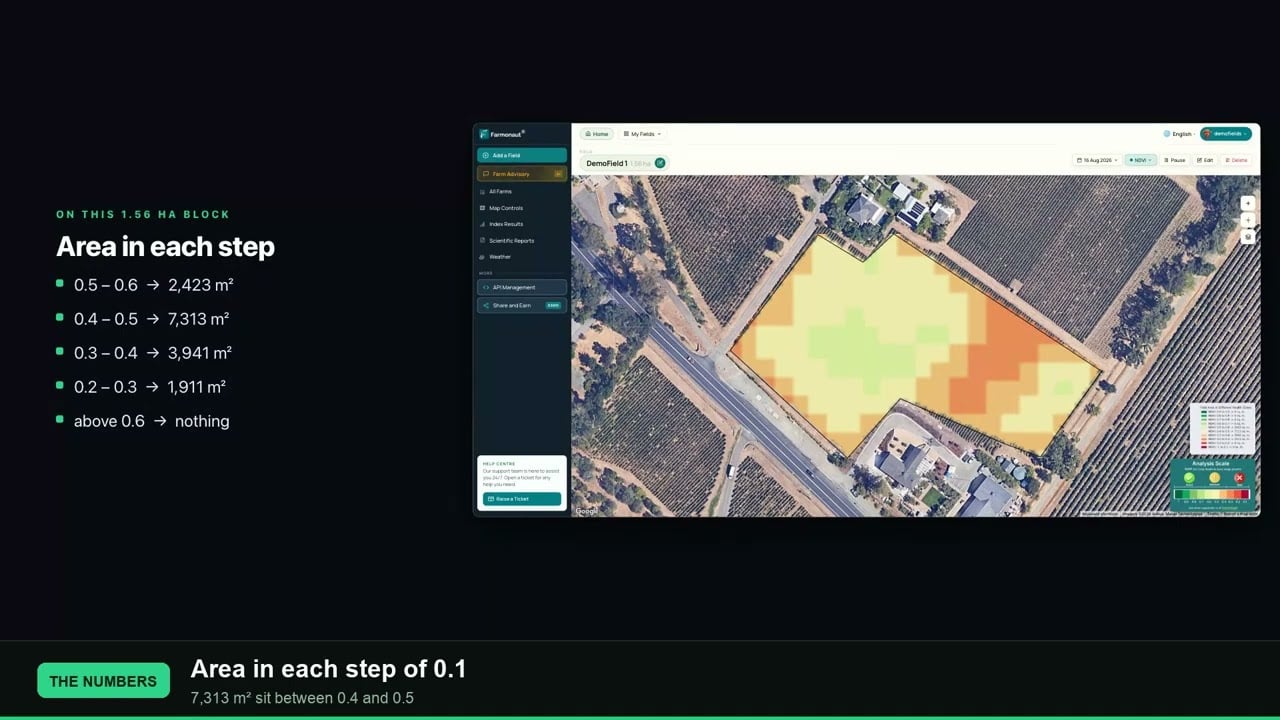
The NDVI readings tell the same story. The old crop’s canopy read about 0.70 to 0.74 in June. By 19 July it had fallen to 0.26 as the crop ripened and was cut. After the new crop came up in October, NDVI sat at 0.24 to 0.30. The advisory notes that this is inside the usual 0.15 to 0.30 range for emergence, so the young crop was developing normally. A thin, bright-red health map at this stage is normal: most of what the satellite sees is still soil between the rows.
▶ What NDVI values from -1 to +1 mean on a real field · 2:33
Septoria leaf blotch risk by stage
Septoria tritici blotch, caused by the fungus Zymoseptoria tritici, is one of the most damaging diseases of winter wheat, according to Lithuanian Research Centre for Agriculture and Forestry (LAMMC) research. A Teagasc research summary calls it the single greatest disease threat to Irish winter wheat and says about 70% of Europe’s annual cereal fungicide input is aimed at it. In this field’s records Septoria was the only pest or disease scored in every one of the 44 advisories.

▶ Practical ways to control aphids on farms · 12:44
From May to October the monthly average scores moved with the crop. Septoria and Fusarium head blight peaked at heading and grain fill, dropped sharply in July as the crop ripened, then rose again on the stubble in August and September before easing at emergence.
Heading and grain fill
In May the Septoria score averaged 84% and the head blight score 95%. Both stayed high in June, at 79% and 93%. The advisories linked this to high moisture in the canopy: satellite water indices and radar soil moisture were high while the heads were out. The AHDB guide says the T2 spray at flag leaf is the most important timing to keep the upper leaves clean. The grain aphid score also averaged 92% in May and 86% in June, as aphids move up to the ears during grain fill.
Stubble and the next crop
After harvest the scores did not drop to zero. In August and September the Septoria score averaged 52% and 53% on the stubble. The reason is the fungus’s life cycle. AHDB explains that Septoria survives on crop debris, autumn-sown crops and volunteers, and that ascospores released from previous wheat stubbles start epidemics in the winter and early spring. Lithuanian work points the same way: a LAMMC study found the most intense spread of these spores in early October and again in May. That matches the timing of the new crop’s first Septoria score.
The organic option on the advisory card was residue incorporation, which buries the infected stubble. Volunteer wheat, which can carry both Septoria and aphids into the new crop, was scored at 80% to 90% from August to mid-October.
Using the data well
The advisory names a chemical option for each threat as well as an organic one. In Lithuania, the LAMMC study found increased resistance in the local Septoria population to azoxystrobin, pyraclostrobin and prothioconazole, while carboxamide fungicides worked best in its field trials. Treat the risk score as a cue to scout and to check current local advice on products. Always follow the product label and local rules.
Chart
Modelled disease risk by month
Monthly average risk score for the field, %, May–October 2026
The first leaves: what the emergence advisory flagged
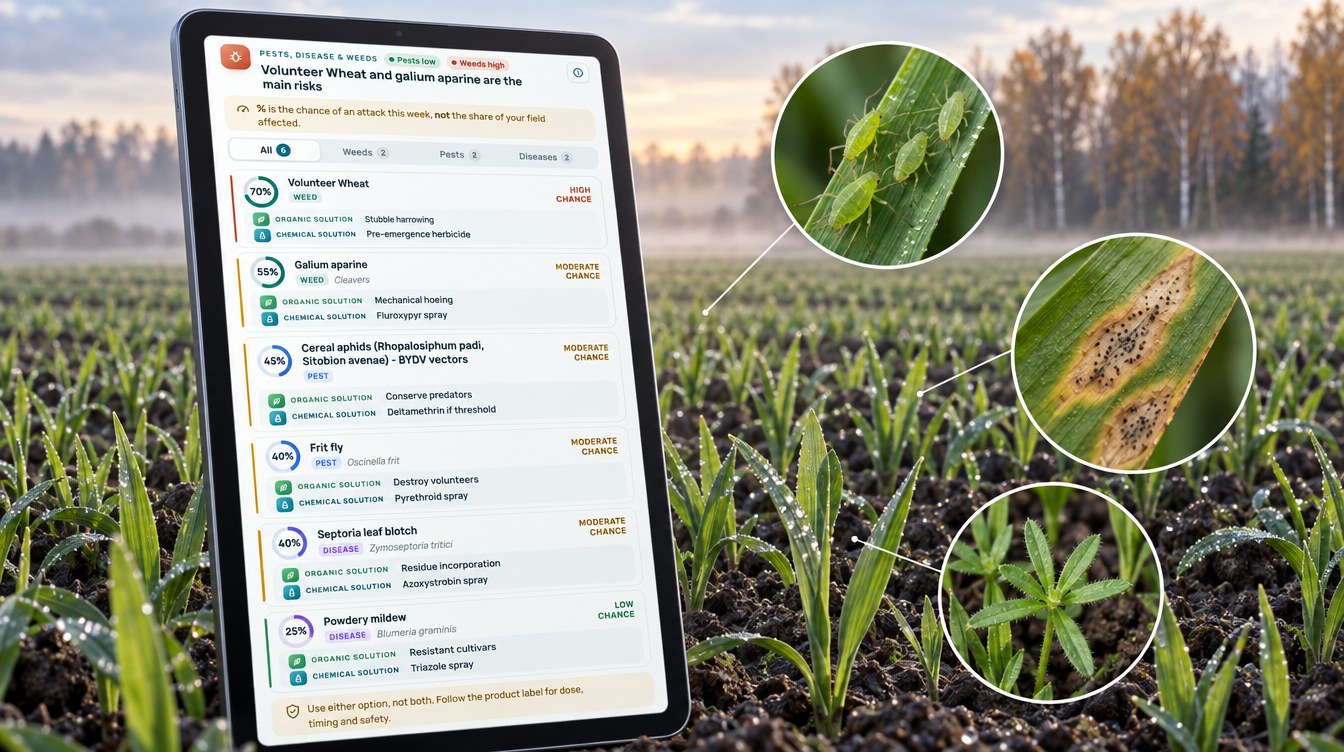
The new crop’s first advisories, on 18 and 20 October, placed it at emergence to early leaf (BBCH 00–13). They listed six threats. Two were weeds, two were pests and two were diseases.
Chart
Threats scored at emergence
Modelled chance of an attack this week, %, advisory of 20 October 2026
Cereal aphids and barley yellow dwarf virus
The cereal aphid score was 45%. The advisory named the bird cherry-oat aphid, which can carry barley yellow dwarf virus (BYDV) into young plants in mild autumn spells. The AHDB T-sum method gives growers a way to time checks. It adds up daily air temperatures above 3°C from crop emergence, and a second aphid generation may be in the crop when the total reaches 170. The AHDB also notes that temperatures below 11°C are linked to limited aphid flights. The Laukuva weather station’s October mean is 6.7°C, so autumn flights were likely tailing off. The advisory suggested scouting rather than spraying by default.
Septoria on the first leaves
The Septoria score was 40%. Infection at this stage does not show straight away. AHDB says symptoms appear after a latent period of 14 to 28 days, and on young autumn-sown wheat they may be visible by early December on the lowest leaves. A risk score in October tells the grower which field to walk first when those leaves can be checked.
Frit fly, powdery mildew and weeds
Frit fly was scored at 40%, with destroying volunteers as the organic option. Powdery mildew was low at 25%, because cool, wet autumn weather and a thin canopy limit it. The two weed scores were the highest on the card: volunteer wheat at 70% and cleavers at 55%. The advisory suggested stubble harrowing and a stale seedbed as the organic route, and a herbicide timed around BBCH 12–13 for cleavers.
The same risk logic applies to other crops, but the disease is not the same. Septoria leaf spot on tomatoes is caused by a different fungus, and our guide to septoria leaf spot treatment covers that crop.
Water: a rainfed crop with a light plan
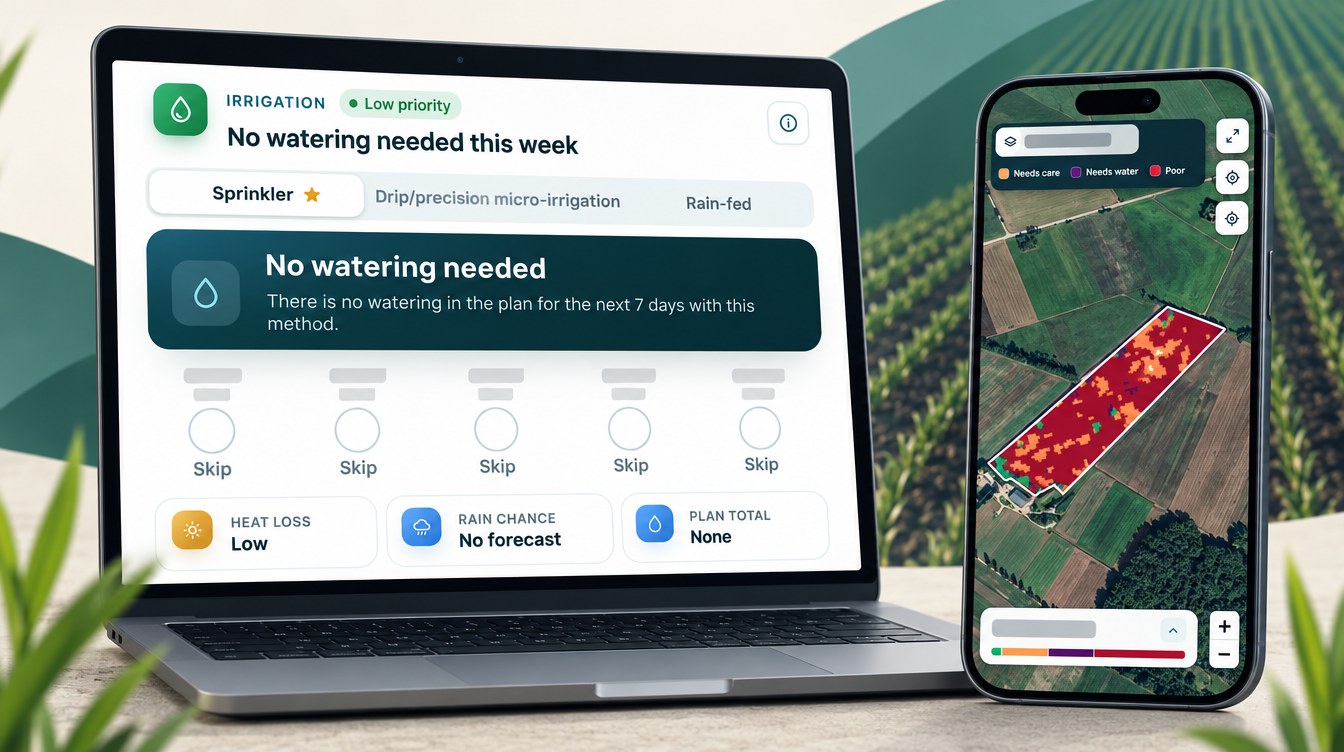
This field is mainly rainfed. The irrigation part of each advisory still plans a sprinkler amount for each of the next seven days, in case the field needs a top-up. When advisories overlapped, we kept the newest plan for each day. That left 157 planned days from 17 May to 27 October. On 137 of them, or 87%, the plan was no water at all.

▶ Why radar satellites can see crops through cloud · 2:37
The plan follows the crop’s water use. The FAO irrigation guide gives winter wheat on frozen soils a crop coefficient of 0.4 at the start of the season, 1.15 in mid-season and 0.25 to 0.4 at the end. In this record the only planned water fell between mid-May and the end of June, at heading and grain fill, when the crop uses the most. From July onwards, through ripening, harvest, stubble and emergence, every planned day was dry.
Local rainfall explains why so little was planned. At the Lithuanian Hydrometeorological Service’s Laukuva station in Tauragė County, the 1991–2020 standard climate norm is 789 mm a year. July and August are the wettest months, with 85 and 90 mm, and October brings another 85 mm.
Planned water compared with a daily routine
To compare, we worked out what the field would have received if it had been given its own average watering dose every day of the planned window. In the 47 days from 17 May to 2 July, the plan had 27 dry days (57%). It came to about 80 mm, or 800 m³/ha, against about 187 mm, or 1,870 m³/ha, with a same-dose routine. That is 57% less. This is a comparison of plans, not a metered saving, but it shows how much of the water depends on timing.
Chart
Rainfall norm vs planned water by month
mm per month; Laukuva 1991–2020 norm vs the field’s plan, 2026 (May covers 17–31 May only)
Nutrition and soil
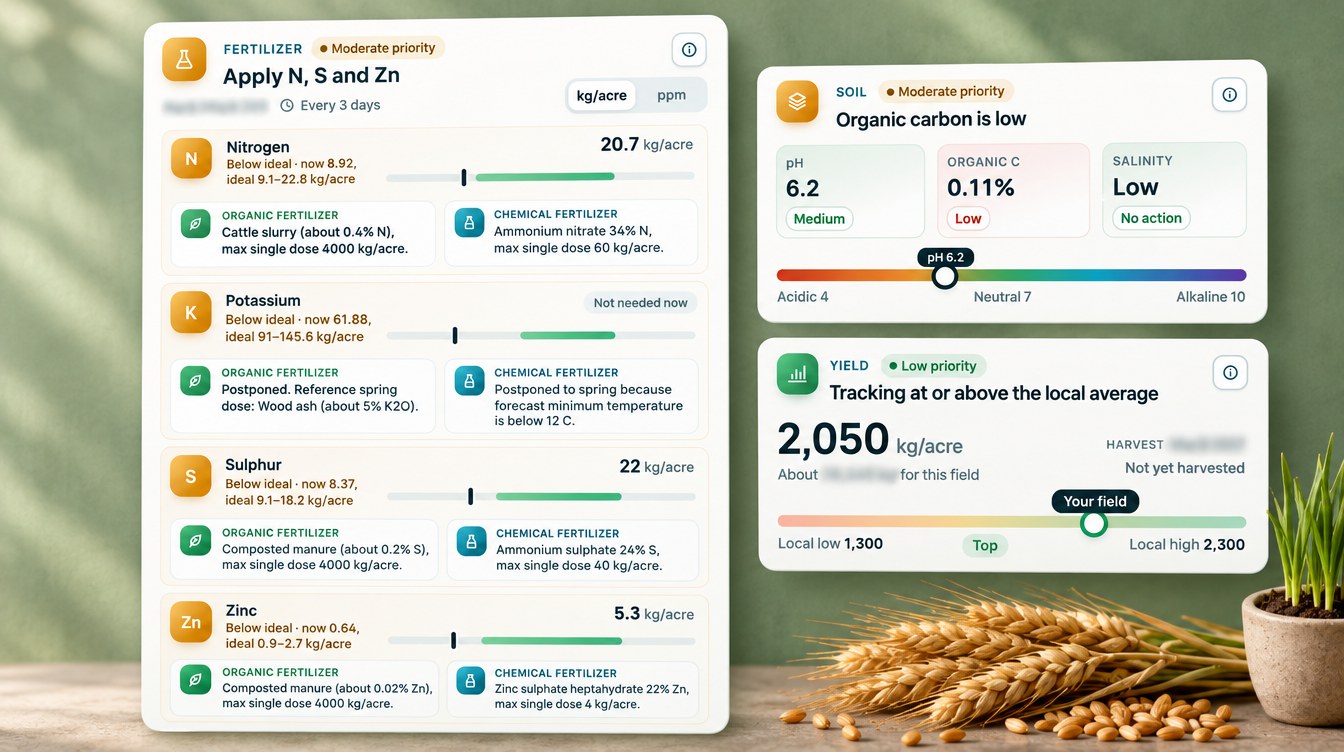
The fertilizer part of each advisory compares the field’s modelled nutrient levels with the ideal range for the current stage. It then gives a rate for each nutrient that is short. Across the record the advisories gave 41 non-zero nutrient recommendations, and every one of them came with an organic source, such as cattle slurry, farmyard manure, bone meal or wood ash, as well as a mineral fertilizer.
The advisories also knew when not to feed. From harvest to emergence the rates were zero. At emergence, the advisory held phosphorus and potassium until spring because the soil was below 12°C and uptake is minimal. Its slurry option came with a note to apply only where local Nitrates Directive spreading deadlines allow. The main nitrogen is planned for spring regrowth, in split doses.
The soil section rated the field at pH 6.2 to 6.5 for most of the record, with low salinity and organic carbon rated low. The yield card put the new crop at 2,050 kg per acre, which is about 5.1 t/ha, inside a local range of 3.2 to 5.7 t/ha. During grain fill, the old crop’s estimates ranged from about 4.8 to 6.8 t/ha. These are modelled estimates, not forecasts.
Contrast: a harvested wheat crop in Tajikistan
Another Farmonaut user grows irrigated wheat in six small fields in northern Tajikistan, about 11.5 hectares (28.3 acres) in total. Their 298 advisories from April to October 2026 show how much the calendar shifts between climates.
- Earlier harvest. The Tajik fields went from stem elongation in April to heading in May. The fields were labelled at ripening or harvest from 20 May to 29 June. The Lithuanian crop was only heading in June.
- Different main threat. In Tajikistan the top-scored pest was the sunn pest, at 90% to 92% in April and May, with yellow rust at 83% in April. In Lithuania Septoria and head blight led.
- Water matters more. The Tajik fields rely on furrow and flood irrigation. From April to June the plan left 62% of field-days dry, and planned about 63% less water than a same-dose daily routine.
The same system adapts to each field’s stage and climate. That is the point of watching each field rather than following a regional calendar.
Chart
Planned water vs a same-dose routine
m³ per hectare; Lithuania 17 May–2 Jul, Tajikistan fields Apr–Jun 2026
What other wheat growers can take from it
Three lessons stand out from this field’s record.
- Septoria risk carries over. The score stayed near 50% on the stubble after harvest, and the new crop got its first score within days of emergence. Residue and volunteers link one crop to the next.
- Watch risk by stage, not by calendar. Septoria, head blight and grain aphid scores peaked at heading and grain fill, and dropped in a matter of weeks once the crop ripened.
- Use the score to plan scouting. At emergence, aphid and Septoria scores of 40% to 45% are a cue to check the field, not an automatic spray.
If you grow winter wheat, the calculator below shows whether a spray pays for itself on your own field. Enter your own yield, grain price, spray cost and the share of yield you expect the spray to protect.
Try the numbers for your own farm below.
Calculator
Does a Septoria or aphid spray pay on your wheat?
Enter your own field size, yield, grain price, spray cost and the share of yield you expect the spray to protect.
- Grain protected: 3.8 t
- Value of grain protected: 750 EUR
- Total spray cost: 675 EUR
- Break-even yield protection: 4.5 %
Example values only, not a benchmark or forecast. The yield protected by a spray varies by field, variety and season; enter your own estimate. Prices are in euros. Always follow the product label and local rules.
FAQ
What is winter wheat monitoring by satellite?
It uses regular satellite images of each field to track crop vigour, moisture and change over time. Farmonaut turns those images, plus the crop’s growth stage and local conditions, into a plan for water, nutrients, weeds and pest and disease risk for each field.
Can a satellite see Septoria leaf blotch?
Not directly. A satellite sees changes in the canopy, not the fungus. The advisory combines canopy and moisture data with the growth stage to score the risk, and the grower confirms any disease in the field.
When is the Septoria risk highest in winter wheat?
In this case study the score was highest at heading and grain fill in May and June, at 79% to 84%. AHDB and LAMMC both point to stubble as the source of the first autumn infections, which is why the score came back at emergence.
Why did the advisory plan almost no water?
The field is mainly rainfed, and the 1991–2020 norm at nearby Laukuva is 789 mm a year. The plan only added water at heading and grain fill, when the crop used the most, and planned no water from July onwards.
Does satellite monitoring work in a cloudy climate?
Yes. In this field the advisories used radar soil moisture alongside the optical images, because Sentinel-1 radar works through cloud. NDVI readings were sometimes missing in October, but the advisories kept coming.
Farmonaut crop monitoring
Get a stage-by-stage plan for your wheat
Draw your fields once, and Farmonaut sends a satellite-based water, nutrient, weed and disease-risk plan for each one every few days on web, Android or iOS.




Keep reading
Sources
- Farmonaut advisory records for a winter wheat field in Tauragė County, Lithuania, and six wheat fields in northern Tajikistan (2026): sat.farmonaut.com
- Eurostat, Crop production in EU standard humidity (apro_cpsh1), Lithuania, common winter wheat and spelt (updated September 2026): ec.europa.eu
- Eurostat API extract, apro_cpsh1, Lithuania C1111 (2026): ec.europa.eu
- Lithuanian Hydrometeorological Service, Standard climate norm 1991–2020 (2021): meteo.lt
- LAMMC, Spread, pathogenicity and control of Zymoseptoria tritici in winter wheat, dissertation annotation (2023): lammc.lt
- AHDB, Septoria tritici in winter wheat: ahdb.org.uk
- AHDB, Barley yellow dwarf virus (BYDV) tool for cereals: ahdb.org.uk
- Teagasc, Investigating sources of resistance in wheat to septoria tritici blotch (2015): teagasc.ie
- FAO, Irrigation and Drainage Paper 56, Chapter 6 crop coefficients (1998): fao.org
- ESA, Sentinel-2 facts and figures: esa.int
- Copernicus SentiWiki, Sentinel-1 mission: sentiwiki.copernicus.eu
- NASA Earth Observatory, Measuring vegetation (NDVI and EVI): science.nasa.gov
Discussion
Questions, corrections or field experience? Share them below. First-time comments are reviewed before they appear, and your email is never published.
No comments yet. Be the first to add a question or your experience.

 Fyllo
 FieldZero
 Indico Company
 Kubota
 FFBS
 Jontra
 Kalustyan
 Tucor
 Geno
 Hayleys Agriculture
 Linx Agritech
 Adinet
 Save Your Soils

 Licence holder · Niger · Gold










