

Australia mining · State-by-state map guide
Australia Mineral Deposits Map: Mines by State
Geoscience Australia runs the national Mines Atlas, and each state keeps its own viewer. This page shows which to open, where the main deposits sit by state, and how Australian resources compare with the world.
Key takeaways
- The national map is the Geoscience Australia Mines Atlas; state viewers are GeoVIEW.WA, MinView, GeoVic, GeoResGlobe, SARIG and STRIKE.
- Australia’s economic resources at December 2024 include 12,955 t of gold, 108 Mt of copper, 8,799 kt of lithium and 58,522 Mt of iron ore (Geoscience Australia, AIMR 2025).
- Western Australia sold A$171 billion of minerals in 2024-25; iron ore was A$122 billion and gold a record A$29 billion (WA Statistics Digest).
- Australia holds about 28% of world economic lithium resources and produced about 32% of world mine output in 2025 (Geoscience Australia; USGS estimate).
- Gold and copper show a gap: about 20% and 11% of world economic resources, but roughly 8.5% and 3% of 2025 mine output (Geoscience Australia; USGS).
In this article
- Australia mining map: the official viewers state by state
- Mineral deposits in Australia by state and commodity
- Pilbara iron ore: where Australia's biggest mines are
- Gold, lithium, nickel and copper: what the numbers show
- How much of the world's resources sit in Australia
- Rare earths and coal in brief
- Active mines in South Australia
- How to use the maps to research a block of ground
- Estimate the value of a year of iron ore output
- How satellite imagery fits with the state maps
- Frequently asked questions
Short answer. There is no single official map of every Australian mine. The national one is the Geoscience Australia Mines Atlas, inside the Geoscience Australia portal, and each state keeps a finer viewer for its own deposits: GeoVIEW.WA and MINEDEX in Western Australia, MinView in New South Wales, GeoVic in Victoria, GeoResGlobe in Queensland, SARIG in South Australia and STRIKE in the Northern Territory. This page tells you which viewer to open for which question, then walks through where the main deposits sit, by state and by commodity.
The scale explains why the maps matter. Geoscience Australia puts the country’s economic resources of gold at 12,955 tonnes, copper at 108 million tonnes (Mt) of contained metal, lithium at 8,799 thousand tonnes (kt) and iron ore at 58,522 Mt, as at December 2024 (Australia’s Identified Mineral Resources). In Western Australia alone, minerals sales reached A$171 billion in 2024-25, and iron ore was A$122 billion of that (WA Statistics Digest).
Australia mining map: the official viewers state by state
A map of deposits and a map of operating mines are different things. A deposit is a body of mineralised rock that someone has drilled and described. A mine is a deposit that a company is digging now. The state surveys show both, plus the mining titles (tenements or licences) that decide who may explore the ground. Start with the viewer for the state you care about.
| Area | Viewer | What it is good for |
|---|---|---|
| Whole of Australia | Geoscience Australia portal (Mines Atlas) | The Australian Atlas of Mineral Resources, Mines and Processing Centres. For a yearly snapshot, Geoscience Australia also issues the Australian Operating Mines Map, with a spreadsheet of operating mines, mines under development and mines on care and maintenance as at December 2025 (data.gov.au). |
| Western Australia | GeoVIEW.WA with MINEDEX | Geology, tenements, mines and mineral deposits with commodity and ownership. Company exploration reports (WAMEX) open from the same map. |
| New South Wales | MinView | Current and historic exploration and mining titles, areas available for exploration, and downloadable geoscience data. |
| Victoria | GeoVic | Tenements, geology, geophysics, boreholes, and mines and mineral occurrences. |
| Queensland | GeoResGlobe | A 3D globe viewer for the state’s geoscience data. It needs a browser with WebGL. |
| South Australia | SARIG | The state’s resources information gateway: tenements, drillholes, geology and mines. |
| Northern Territory | STRIKE | Mineral occurrences, exploration drillholes, geochemical samples and mineral tenure; desktop browsers only. |
| Tasmania | Mineral Resources Tasmania (Department of State Growth) | The state’s geological survey and mining titles information. |
In Western Australia, MINEDEX is the database of mines and deposits and GeoVIEW.WA is the map you search it through (Government of Western Australia). The same viewer links to WAMEX, the library of exploration reports that companies must lodge. That matters if you want to know whether a block of ground has been drilled before: the report is often public once its confidentiality period ends. Anyone looking for Pilbara mine surveys will find the state geological survey maps and past company reports for each tenement in this one place.
▶ Farmonaut video: how to read the Western Australian state map viewers (GeoVIEW.WA, WAMEX, MINEDEX and Tengraph). · 4:13
Mineral deposits in Australia by state and commodity
The table gives the headline commodities for each state, with operations that are named in the sources behind this page. It is a starting point for choosing a viewer, not a complete mine list. Check company reports for status before you rely on any row.
Chart
Western Australia share of world output
Percent of world production, 2024
| State or territory | Main commodities | Operations named in sources |
|---|---|---|
| Western Australia | Iron ore, gold, lithium, nickel, rare earths, mineral sands | Pilbara iron ore; Boddington and Tropicana gold; Greenbushes and Pilgangoora lithium; Mt Weld rare earths |
| New South Wales | Gold, copper, silver-lead-zinc, coal | Cadia (porphyry copper-gold); Broken Hill, where Rio Tinto traces its Australian roots to a zinc operation from 1905 |
| Queensland | Copper, zinc, lead, silver, bauxite, coal | Mount Isa Mines and George Fisher (Glencore); Weipa bauxite (Rio Tinto) |
| South Australia | Copper, gold, uranium, iron ore, opal | Olympic Dam, Carrapateena and Prominent Hill (BHP); Beverley and Four Mile uranium; Middleback Range iron ore, feeding the Whyalla steelworks; Coober Pedy opal |
| Northern Territory | Gold | Tanami (Newmont) |
| Victoria | Brown coal; other deposits are mapped in GeoVic | Australian brown coal production is reported by the Victorian Government (Geoscience Australia) |
| Tasmania | Tungsten; other deposits are held by Mineral Resources Tasmania | Kara mine (Tasmania Mines Pty Ltd), counted in Geoscience Australia’s tungsten estimate |
Sources for the rows: Cadia sits on the porphyry copper-gold belt shown in the NSW Resources gold opportunities map; Rio Tinto describes its Broken Hill origin, Weipa and Pilbara operations on its Australia page; Glencore describes its Mount Isa copper, zinc, lead and silver chain in a media release on the Mount Isa smelter; the Tropicana and Tanami operations appear in a Surbiton Associates gold report.
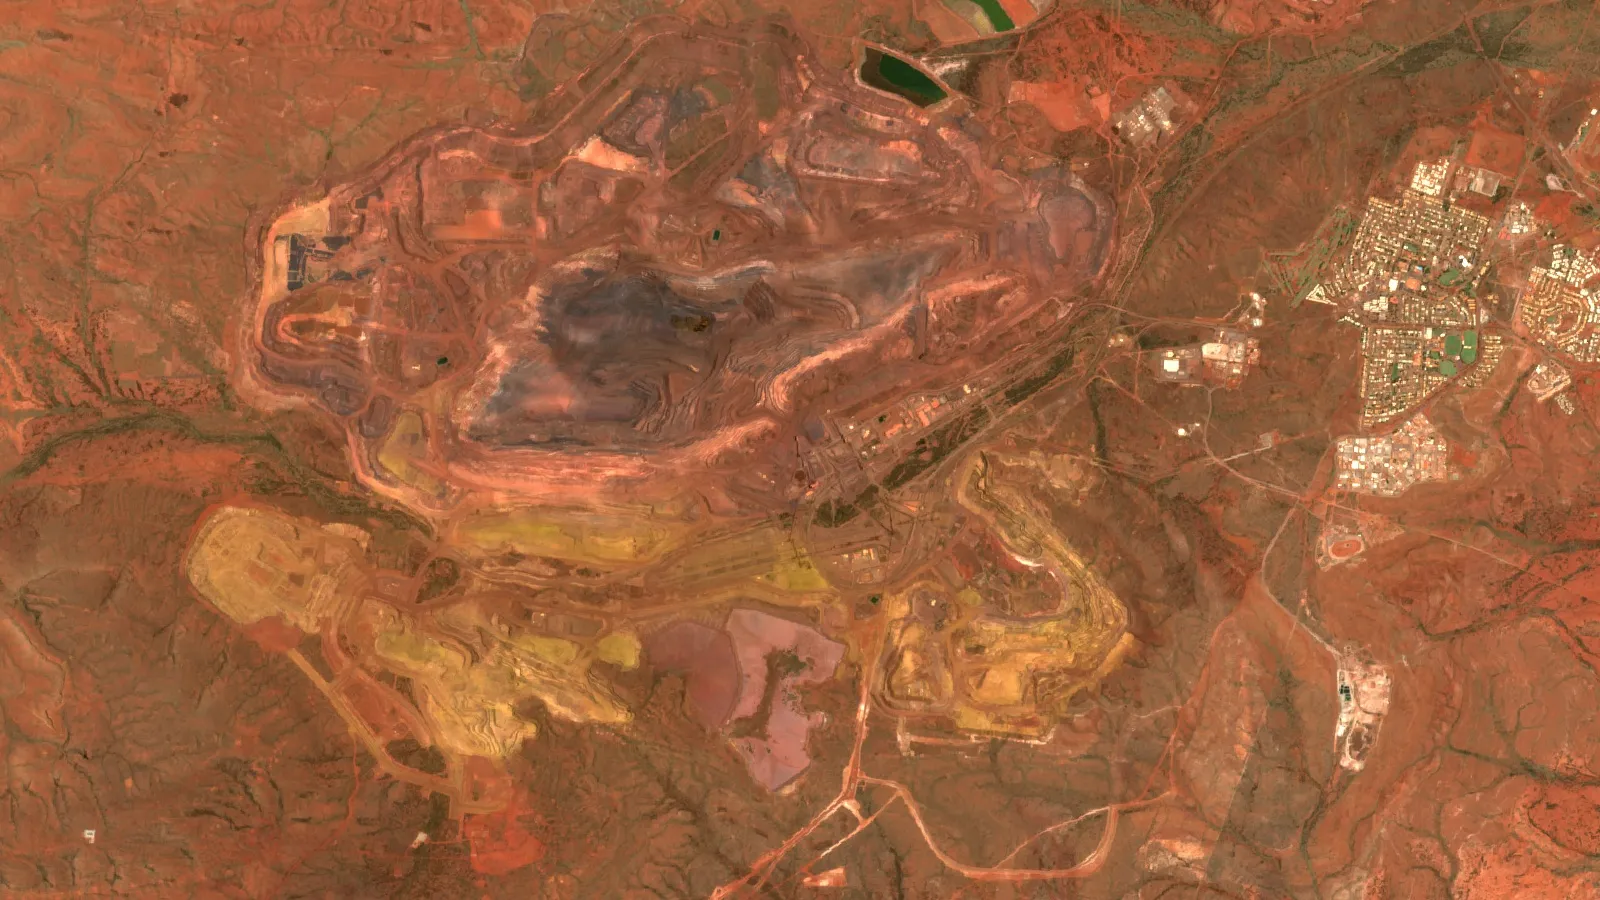
Western Australia dominates several world rankings. Its share of global output in 2024 was 35.6% for iron ore and 41.6% for lithium, and it ranked first in the world for both, plus garnet and rutile (WA Statistics Digest, 2024-25). The chart shows the shares.
Pilbara iron ore: where Australia’s biggest mines are
The Pilbara region, in the north-west of Western Australia, produces most of the country’s iron ore. The region’s mines sold A$122.8 billion of minerals in 2024-25, of which iron ore was A$119.0 billion. Within the region, the Ashburton shire accounted for A$64.3 billion and East Pilbara for A$55.4 billion (WA Statistics Digest, 2024-25).
Western Australia produced a near-record 864 Mt of iron ore in 2024-25, at an average price of US$101 per tonne, down from about US$120 the year before. Fortescue set a production record and BHP came close to one, while Rio Tinto output fell because of ore depletion at Paraburdoo and Yandicoogina, the move to the Western Range mine and cyclones (same source). For a mine-by-mine view of Rio Tinto’s Pilbara operations, see our Pilbara mines map and prospecting guide.
Nationally, the US Geological Survey estimates Australian usable iron ore output at 980 Mt in 2025 and 982 Mt in 2024, with 59,000 Mt of crude ore in reserves (USGS Mineral Commodity Summaries, 2026). Geoscience Australia counts 33,596 Mt of hematite and 26,014 Mt of magnetite ore as economic resources. Hematite is the high-grade direct-shipping ore most Pilbara mines sell. Magnetite is lower in grade and needs processing, so it matters more to the long-term resource than to current shipments.
Reading the Pilbara on a map: in GeoVIEW.WA, switch on the mines layer and the tenement layer together, and note how many blocks around the known pits already have a holder. Port Hedland, in the East Pilbara, is the region’s main iron ore export port. Ground near active mines is usually held, so a newcomer needs to check each tenement’s status before planning any work.
Gold, lithium, nickel and copper: what the numbers show
Commodity prices move sales more than tonnes do, and 2024-25 shows it. Gold sales in Western Australia hit an all-time high of A$29 billion on about 6.7 million troy ounces (209 tonnes), as the price averaged US$2,820 per ounce. Lithium sales fell to A$4.3 billion from A$8.5 billion a year earlier, even though a record 3.85 Mt of spodumene concentrate was produced, because the average price slid to US$780 per tonne. Nickel sales were A$2.1 billion, the lowest in more than 20 years, and copper sales were A$995 million, the lowest since the global financial crisis (all from the WA Statistics Digest, 2024-25).
Chart
Western Australia sales value by commodity
A$ billion, 2024-25; selected commodities
Gold
Gold is spread across every state. In Western Australia, the Goldfields-Esperance region sold A$21.8 billion of gold in 2024-25, led by the Laverton, Leonora and Coolgardie shires (WA Statistics Digest). Australia ranked third in the USGS list of leading gold producers, behind China and Russia, at an estimated 280 tonnes in 2025 (USGS, 2026). Olympic Dam in South Australia is the largest by-product gold producer, at 216,000 ounces in calendar 2025 (Surbiton Associates, March 2026). For state-by-state detail, use our Australia gold deposits by state guide and the NSW gold mines map.
Lithium
Lithium in Australia comes from spodumene, a lithium mineral found in pegmatite rock. The Western Australian mines named in the digest include Greenbushes, Pilgangoora, Mt Marion, Mt Holland and Kathleen Valley. The digest records the Ngungaju plant at Pilgangoora and the Bald Hill mine being placed in care and maintenance in December 2024 after the price fall, and Rio Tinto’s Mt Cattlin winding down. Greenbushes was held by Talison Lithium Australia, a joint venture of Tianqi Lithium and IGO (51 per cent) and Albemarle (49 per cent). The USGS estimates Australian lithium output at 92,000 tonnes of contained lithium in 2025, about a third of the world total (USGS, 2026). The full owner table is in our Western Australian lithium mines list.
Copper and nickel
In Western Australia, copper sales fell after the end of the DeGrussa mine and nickel mine suspensions removed copper by-product (WA Statistics Digest). The best-documented copper operations are in South Australia (Olympic Dam) and Queensland (Mount Isa), covered below and in the state table. The USGS estimates Australian mine production at 730 kt of copper in 2025, from 765 kt in 2024 (USGS, 2026). Nickel fell much further: the USGS estimates a 54% drop in Australian nickel output after several companies put mines on care and maintenance on low prices, to 45,000 tonnes in 2025 from 98,000 in 2024 (USGS, 2026). The resource has not gone anywhere: Geoscience Australia still counts 24.7 Mt of nickel as economic resources.
How much of the world’s resources sit in Australia
Resources and production tell different stories, and the gap shows where the upside or the constraint lies. The chart compares Australia’s share of world economic resources (Geoscience Australia) with its share of world mine production (USGS estimate for 2025). Lithium and iron ore are mined close to the share they hold underground. Gold and copper are not: Australia holds about a fifth of the world’s economic gold resources but produced roughly 8.5% of mined gold. That gap is one reason exploration companies keep working in mature districts. Both sources use different definitions, so treat the comparison as a guide, not an exact ratio.
Chart
Australia: resources versus output
Percent of world total; resources Dec 2024, output 2025 estimate
Rare earths and coal in brief
Rare earths are a group of 17 metals used in magnets and electronics. Australia’s economic resources are 7.36 Mt of rare-earth oxide (Geoscience Australia, December 2024) and the USGS estimates output at 29,000 tonnes in 2025 (USGS, 2026). The key mine is Mt Weld near Laverton, Western Australia, run by Lynas Rare Earths. The state describes it as the world’s largest producing rare-earth mine outside China, at roughly 30 kt of contained oxide, about 8% of global mined output; Lynas also operates a processing facility in Kalgoorlie, and Iluka’s Eneabba rare earths refinery is among the committed projects in the state’s investment pipeline (WA Statistics Digest). For a comparison with the US picture, see our US rare earth minerals map.
Coal is covered only briefly here because it is mapped mainly by Queensland and New South Wales. Geoscience Australia counts 86,640 Mt of black coal in situ as economic resources, and 81,234 Mt of brown coal (December 2024). The Queensland GeoResGlobe and NSW MinView viewers hold the coal titles and basins.
Active mines in South Australia
South Australia is copper country. BHP’s Olympic Dam, Carrapateena and Prominent Hill form its copper precinct, and BHP reported a 20-year copper production record at Olympic Dam in the year to June 2026, with about 320 kt of copper a year produced in the state and a plan to lift that towards 500 kt (InDaily, 18 August 2026). Olympic Dam lies 560 km north of Adelaide near Andamooka; Western Mining Corporation found it in 1975 by drilling a geophysical target near a small stock water dam called Olympic Dam, and the orebody also holds uranium, gold and silver (World Nuclear Association). The Middleback Range on Eyre Peninsula hosts iron ore mines, including South Middleback, which supplies the Whyalla steelworks; the government-backed sale of those steelworks narrowed to two final bidders on 27 May 2026 (InDaily; Global Energy Monitor).
Uranium is the other SA commodity on the list: the World Nuclear Association names Olympic Dam and the Beverley plant, which also treats ore from Four Mile, as the state’s uranium producers, and records that Honeymoon was shut in 2013 pending better prices (World Nuclear Association).
For opal, the state’s best-known field is Coober Pedy; see our guide to the Coober Pedy opal mines. To list active South Australian mines yourself, open SARIG, switch on the mines and mineral deposits layer and the current tenements layer, and read the status field for each point.
How to use the maps to research a block of ground
- Open the state viewer and find the tenement. Note the holder, the status and the dates.
- Switch on the mineral occurrences or deposits layer within a few kilometres. Record the commodity and the status of each point.
- Pull the geology map. Check whether your ground sits on the same rock belt as a known deposit.
- Download or request past exploration reports (WAMEX in Western Australia and the equivalent open-file libraries elsewhere). Look for drilling, assay tables and geochemical anomalies.
- Check land access: native title, pastoral leases, national parks and heritage areas can limit work, and the state regulator decides what is allowed.
- Only then commission fieldwork or imagery, so that spending follows the strongest evidence.
Estimate the value of a year of iron ore output
The calculator below turns a tonnage into a yearly sales value and a simple government take, so you can see how price and exchange rate move a project. Enter your own numbers.
Calculator
What is a year of iron ore output worth?
Enter your own tonnes, price, exchange rate and government take.
- Sales in US$ million: 1,000
- Government take (A$ million): 75.0
- Sales per tonne (A$): 150.0
Example values only, not a forecast or a benchmark. The price and exchange rate are examples: use today’s price. For scale, Western Australia’s average iron ore price was US$101 per tonne in 2024-25 (WA Statistics Digest). Royalty rules differ by state and agreement, so enter the rate from your regulator.
How satellite imagery fits with the state maps
State viewers show what has been recorded. Satellite imagery shows what is on the ground now: iron-stained or clay-altered rock, new pits and waste dumps, and tracks. Used before you buy or option a claim, it helps you screen ground for alteration and structure that lines up with known deposits, so that drilling money goes to the best targets. Satellite results are exploration targets that sit ahead of a resource estimate. Farmonaut turns a KML, KMZ or polygon of your licence into a satellite mineral detection report.

▶ Farmonaut video: what AI does in mineral exploration, where it fails, and how to check any claim. · 4:37
Frequently asked questions
Is there an official map of all mines in Australia?
Geoscience Australia’s Mines Atlas, available through the Geoscience Australia portal, is the national atlas of mineral resources, mines and processing centres. For tenements and finer detail, use the state viewers listed above.
Where are the biggest mineral deposits in Australia?
By value, iron ore in the Pilbara of Western Australia is largest: A$119.0 billion of sales in 2024-25. Large copper-gold-uranium deposits include Olympic Dam in South Australia, and large gold and lithium operations are concentrated in Western Australia.
Which Australian state has the most mines?
Western Australia has the most principal projects in a published government count: 139 in 2024-25, meaning projects that sold more than A$5 million of minerals (or more than 2,500 ounces of gold) in the year (WA Statistics Digest). For a like-for-like national count, open Geoscience Australia’s Australian Operating Mines Map 2025 spreadsheet and count the operating mines by state.
Which state is best for gold?
Western Australia leads on value, with A$29 billion of gold sales in 2024-25, and its Goldfields-Esperance region alone sold A$21.8 billion of gold. New South Wales, Victoria, Queensland and the Northern Territory all have operating gold mines. See the gold by state guide linked above.
Where is lithium mined in Australia?
Mainly in Western Australia: Greenbushes in the south-west, and Pilgangoora, Mt Marion, Mt Holland and Kathleen Valley elsewhere in the state. Australia produced an estimated 92,000 tonnes of contained lithium in 2025 (USGS).
Where are rare earths mined in Australia?
The main operating mine is Mt Weld, near Laverton in Western Australia, run by Lynas. Iluka’s Eneabba refinery is a committed project in the same state.
What are the active mines in South Australia?
BHP’s Olympic Dam, Carrapateena and Prominent Hill copper operations, uranium at Olympic Dam and Beverley-Four Mile, iron ore in the Middleback Range, and opal at Coober Pedy. SARIG shows the current status of each.
Can I download Australian mine locations?
Geoscience Australia publishes its Australian Operating Mines Map and spreadsheet on data.gov.au (the 2025 edition is as at December 2025), and the state surveys offer downloads from their viewers, for example MinView in New South Wales. Check the licence and date on each file.
Can I prospect on any ground shown on the map?
No. A map shows geology and titles, not permission. You need the holder’s consent where ground is under a tenement, the right permit from the state regulator, and compliance with land access and environmental rules. Never use mercury.
How current are the figures for Australian mineral resources?
Geoscience Australia publishes its resource estimates once a year, as at 31 December of the previous year. The edition used here is as at December 2024.
This page is for information only. It is not investment advice or legal advice. Figures are estimates with the dates given; mine status and tenement holders change, so confirm them with the company and the state regulator. Satellite results are exploration targets that sit ahead of a resource estimate. Prospecting needs the permission of the tenement holder and the regulator, and mercury must never be used.
Farmonaut mining
Map your own Australian licence from space
Send a KML, KMZ or polygon of your tenement and get a satellite mineral detection quote.

Mining Pro sample view, synthetic data
Keep reading
Sources
- Geoscience Australia, Australia’s Identified Mineral Resources (AIMR 2025): ga.gov.au
- Government of Western Australia, Mineral and Petroleum Statistics Digest 2024-25: wa.gov.au
- USGS, Mineral Commodity Summaries 2026: Iron Ore: pubs.usgs.gov
- USGS, Mineral Commodity Summaries 2026: Gold: pubs.usgs.gov
- USGS, Mineral Commodity Summaries 2026: Lithium: pubs.usgs.gov
- USGS, Mineral Commodity Summaries 2026: Copper: pubs.usgs.gov
- USGS, Mineral Commodity Summaries 2026: Nickel: pubs.usgs.gov
- USGS, Mineral Commodity Summaries 2026: Rare Earths: pubs.usgs.gov
- Geoscience Australia portal: Mines Atlas: portal.ga.gov.au
- Operating Mines OZMIN dataset, data.gov.au: data.gov.au
- Government of Western Australia, GeoVIEW: wa.gov.au
- Government of Western Australia, Access MINEDEX: wa.gov.au
- NSW Resources, MinView: minview.geoscience.nsw.gov.au
- Resources Victoria, GeoVic: resources.vic.gov.au
- Queensland Government, GeoResGlobe: georesglobe.information.qld.gov.au
- South Australia, SARIG map viewer: map.sarig.sa.gov.au
- Northern Territory Geological Survey, STRIKE: strike.nt.gov.au
- NSW Resources, Gold: Opportunities in New South Wales: resources.nsw.gov.au
- Rio Tinto, Australia and New Zealand: riotinto.com
- Glencore Australia, Mount Isa copper smelter agreement: glencore.com.au
- Mining.com.au, Australia’s gold output rises: Surbiton (16 March 2026): mining.com.au
- InDaily, SA record falls as BHP posts profit (18 August 2026): indailysa.com.au
- World Nuclear Association, Australia’s uranium mines: world-nuclear.org
- Global Energy Monitor, SIMEC South Middleback Mine: gem.wiki
- Mineral Resources Tasmania (Department of State Growth): mrt.tas.gov.au
- InDaily, final bidders for Whyalla Steelworks (27 May 2026): indailysa.com.au
- Geoscience Australia, AIMR 2025 Appendices: ga.gov.au
- Data.gov.au, Australian Operating Mines Map 2025 (Geoscience Australia): data.gov.au
Discussion
Questions, corrections or field experience? Share them below. First-time comments are reviewed before they appear, and your email is never published.
No comments yet. Be the first to add a question or your experience.

 Southbridge & Wess PDC Ltd
 Qader Group
 Ileys General Trading
 SG Gold Mining LLC
 VRV Global Pte Ltd
 Omsri International FZE
 G.I.T.T.
 Jaunita Erss Ltd
 Almosi SARL
 SRK Consulting
 Berks Gold Limited
 Mwerezi Minerals Company Limited
 Mining SARL
 SenGold Invest SAS
 Sean Mining Limited
 NTS Group (Pty) Ltd
 Mine4Africa
 Lithspo Minerals Limited











