

Gold ore grade · Explainer and calculator
Grams per Tonne Gold: What g/t Ore Grade Means
Grams per tonne (g/t) is the grams of gold in each tonne of rock; 1 g/t equals 1 ppm and about 31 tonnes of ore per troy ounce. Agnico Eagle’s 2025 reserves average 1.30 g/t (Agnico Eagle, 2026).
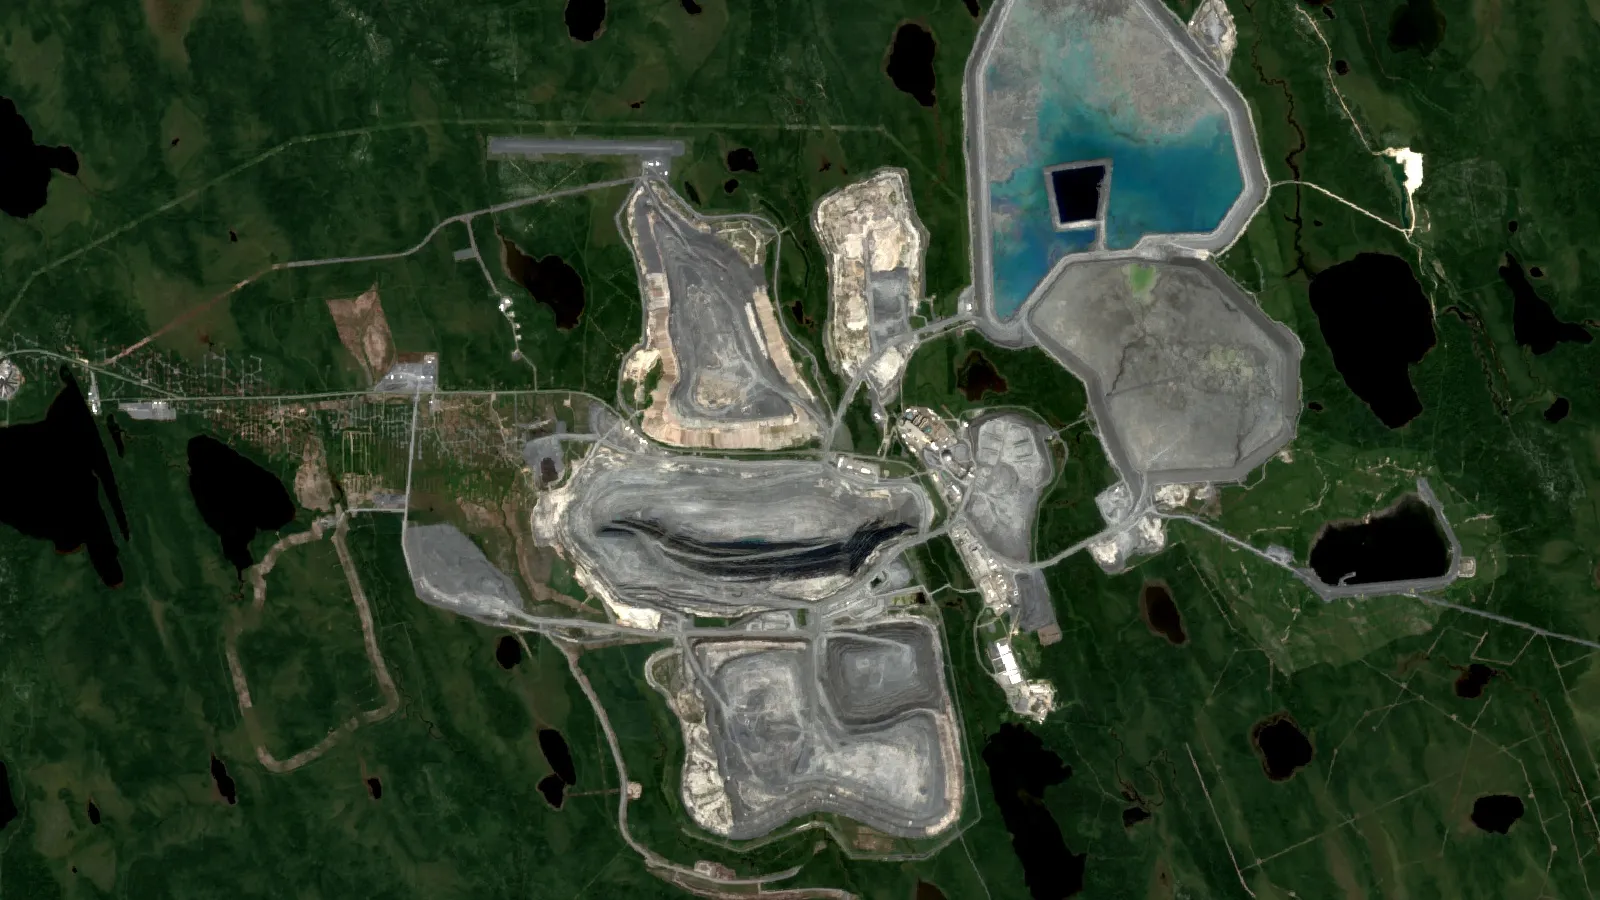
Key takeaways
- 1 g/t = 1 ppm = 1 gram of gold per tonne; 1 troy ounce is 31.1035 g (NIST), so 1 g/t needs about 31 tonnes of rock per ounce.
- To convert to US units, divide g/t by 34.2857 to get troy ounces per short ton (NIST constants).
- Agnico Eagle’s year-end 2025 reserves: the biggest open pits near 0.7 to 1 g/t, underground mines from 1.6 to 8.8 g/t; cut-offs run from 0.27 to 4.00 g/t (Agnico Eagle, 2026).
- Contained gold = tonnes x g/t / 31.1035; recovery (88% to 94% at the mines listed, 87% at Pueblo Viejo) then sets the ounces you sell.
- Resources are estimated from assays, density and geostatistics, then classed Inferred, Indicated or Measured (JORC Code, 2012; Barrick, 2026).
In this article
- What grams per tonne means in gold mining
- Grams per tonne to ppm, oz/t and oz per short ton
- How much rock does one ounce of gold take?
- What is a good gold ore grade?
- Cut-off grade: why 0.3 g/t can be ore and 3 g/t can be waste
- Grade times tonnage: how much gold is in a deposit
- Gold value calculator: ounces, margin and break-even grade
- How geologists estimate the quantity of gold in a deposit
- How to read a drill intercept in g/t
- Where satellite data fits with grade
- Frequently asked questions
Grams per tonne (g/t) is the standard way to state how much gold sits in a tonne of rock. A grade of 1 g/t means one gram of gold in every tonne of ore, which is the same as 1 part per million (ppm). One troy ounce is 31.103 grams (NIST SP 811), so a 1 g/t deposit needs about 31 tonnes of rock for each ounce of gold. Agnico Eagle’s reserves at the end of 2025 averaged 1.30 g/t across 1,330 million tonnes, for 55.4 million ounces (Agnico Eagle, February 2026). The rest of this guide shows how to convert the units, what counts as a good grade, why cut-off grade matters, and how geologists turn drill assays into a gold estimate.
The page is written for licence holders, consultants and investors who read resource tables and drill results. Terms are explained the first time they appear. All grade, tonnage and cut-off figures come from company filings and technical reports, and each carries its date.
What grams per tonne means in gold mining
Grade is the concentration of the valuable metal in the rock. For gold it is nearly always quoted in g/t, because gold is rare. The US Geological Survey puts estimates of the gold content of the average crust at 0.001 to 0.006 ppm (USGS Circular 603, 1968). Ore at 1 g/t is therefore roughly 170 to 1,000 times richer than average rock, and ore at 5 g/t is roughly 830 to 5,000 times richer. Nature has to concentrate the metal before it can be mined, and grade tells you how far that went.
A tonne here is a metric tonne of 1,000 kilograms. A gram of gold is a very small amount, which is why the numbers that matter in a deposit are always two at once: the grade (g/t) and the tonnage (how many tonnes carry that grade). Multiply them and you get the metal in the ground. A small tonnage at a high grade and a huge tonnage at a low grade can hold the same ounces.
Grade is an average. A drill core that returns 1 g/t over 100 metres can hide a few centimetres at 40 g/t and a long stretch of near-zero rock. Geologists therefore always state the length the grade covers, and the lab method used to measure it. Both are covered further down.
Grams per tonne to ppm, oz/t and oz per short ton
Four unit systems appear in gold reports, and mixing them is the most common reading error. Metric reports (Australia, Canada, Africa, Europe) use g/t. Some assay certificates use ppm or parts per billion (ppb). Older US reports use troy ounces per short ton (oz/st, written oz/t or opt). Some reports state ounces per metric tonne. The conversions follow from two NIST constants: 1 troy ounce is 31.1035 grams, and 1 short ton (2,000 pounds) is 907.185 kilograms (NIST SP 811, Appendix B.8).
| Grade (g/t) | ppm | ppb | Troy oz per short ton | Troy oz per tonne | Tonnes of rock per ounce |
|---|---|---|---|---|---|
| 0.5 | 0.5 | 500 | 0.0146 | 0.0161 | 62.2 |
| 1 | 1 | 1,000 | 0.0292 | 0.0322 | 31.1 |
| 2 | 2 | 2,000 | 0.0583 | 0.0643 | 15.6 |
| 3 | 3 | 3,000 | 0.0875 | 0.0965 | 10.4 |
| 5 | 5 | 5,000 | 0.1458 | 0.1608 | 6.2 |
| 10 | 10 | 10,000 | 0.2917 | 0.3215 | 3.1 |
The rules to remember are short:
- g/t to ppm: the number does not change (1 g/t = 1 ppm). A gold-in-soil result of 0.05 ppm is 50 ppb, or 0.05 g/t.
- g/t to oz per short ton: divide by 34.2857. A US filing that says 0.05 oz/t is about 1.7 g/t.
- oz per short ton to g/t: multiply by 34.2857.
- g/t to oz per tonne: divide by 31.1035.
- Per cent: 1% is 10,000 g/t, so a 10 g/t ore is 0.001% gold.
The short ton trap
A “ton” in the United States is a short ton of 907 kg. A “tonne” is 1,000 kg. A report that says “grams per ton” without stating which one is off by about 10%: 1 gram per short ton is about 1.10 g/t. Canadian and Australian filers use the metric tonne. Always check the footnote or the glossary of the report before comparing two projects.
How much rock does one ounce of gold take?
The chart below turns real reserve grades into tonnes of rock per troy ounce, using the 31.1035 g constant. At Agnico Eagle’s Detour Lake, the lower-grade part of the reserve (below 0.5 g/t, average 0.38 g/t) needs about 82 tonnes of ore for an ounce. At Macassa, an underground mine in Ontario, the reserve grade of 8.84 g/t needs about 3.5 tonnes per ounce (Agnico Eagle reserve tables, 31 December 2025).
Chart
Tonnes of ore for one troy ounce, by reserve grade
Tonnes of ore per ounce contained, before recovery losses; selected Agnico Eagle reserve grades and Pueblo Viejo (Barrick)
That 23-fold difference explains why mine design changes with grade. At 0.4 g/t you move enormous volumes in open pits with giant trucks, and every cent of cost per tonne matters. At 9 g/t you can afford narrow underground stopes, expensive ventilation and a long haul, because each tonne carries far more metal. For scale, world mine production was an estimated 3,300 tonnes of gold in 2025, about 106 million troy ounces, against world reserves of 66,000 tonnes (USGS Mineral Commodity Summaries, 2026).
What is a good gold ore grade?
There is no single “good” grade. A grade is good when the gold in a tonne is worth more than the cost of mining, hauling and processing that tonne, with a margin. That depends on the mining method, the size of the deposit, the metallurgy and the gold price. The reserve tables of one large producer show the pattern. In Agnico Eagle’s year-end 2025 reserves, the biggest open pits and deposits sit near or below 1 g/t: Detour Lake 0.72 g/t over 798 million tonnes, Canadian Malartic mine 0.77 g/t, and the Marban deposit 0.95 g/t. Several underground operations sit much higher: Meliadine 5.10 g/t (open pit and underground combined), Hope Bay 6.53 g/t, and Macassa 8.84 g/t, while Goldex, also underground, is 1.60 g/t (Agnico Eagle, 2026).
Pueblo Viejo, an open-pit gold mine in the Dominican Republic, shows the middle of the range. Its proven and probable reserves at 31 December 2025 are 310 million tonnes at 2.06 g/t, about 20 million ounces (100% basis; Barrick owns 60%) (Barrick Pueblo Viejo technical report, February 2026). Ore mined from 2010 to 2025 averaged 3.0 g/t, which is richer than the 2.06 g/t that remains in reserve, so at this mine the leaner ore comes later.
These are single-company and single-mine figures, not a world average. For wider statistics on typical copper and gold grades by deposit type, see our guide to typical ore grade statistics. A rough way to read any table:
- Below about 1 g/t: seen in very large open pits, where the tonnage runs to hundreds of millions of tonnes.
- About 1 to 3 g/t: open pit or bulk underground methods, depending on depth and size.
- About 4 to 10 g/t: underground mining of narrower veins and shear zones, where selective mining keeps dilution down.
- Above 10 g/t: high-grade, usually narrow, often with very uneven gold (the “nugget effect”, explained below). Small tonnages can still make a strong mine.
These bands are a reading aid built from the tables above, not a rule. Cost and price move the dividing lines. Grade also says nothing about size: the 2.06 g/t at Pueblo Viejo carries far more gold than the 8.84 g/t at Macassa because the tonnage is nearly fifty times larger. If you want the lens of one lode type, our guide to the world’s main gold belts and top mines shows where the high-tonnage, low-grade districts sit.

▶ How gold is mined and refined, from rock to ring. · 5:27
Cut-off grade: why 0.3 g/t can be ore and 3 g/t can be waste
The cut-off grade is the lowest grade at which a block of rock pays for itself. Blocks above it are ore and are mined and processed. Blocks below it are waste, or sometimes stockpile. The standards that govern public reporting require that a resource has “reasonable prospects for eventual economic extraction”, and they expect the estimator to state the cut-off grade and its assumptions (CIM Definition Standards, 2014; JORC Code, 2012).
Chart
Cut-off grade versus average reserve grade
g/t gold; cut-offs are minimum values stated by Agnico Eagle for each operation
Cut-off grade is not a fixed number for a country or a style of deposit. It depends on the cost of the mine and mill and on the price. Agnico Eagle’s year-end 2025 reserve tables list the cut-offs that were used: 0.27 g/t at Detour Lake, 0.35 g/t at Canadian Malartic, 3.00 g/t at Fosterville, 3.35 g/t for long-hole stoping at Macassa, and 4.00 g/t at Hope Bay (Agnico Eagle, 2026). The same grade of 1 g/t is ore in the first mine and waste in the last three. The average reserve grade always sits above the cut-off, because everything below it has been excluded. Several cut-offs in the table are “not less than” values that vary by zone and depth.
Detour Lake shows the effect directly. Its reserve is split in two tiers. The tier at or above 0.5 g/t holds 501 million tonnes at 0.93 g/t, about 15.0 million ounces. The tier below 0.5 g/t holds 297 million tonnes at 0.38 g/t, about 3.6 million ounces. Both count as reserves because the cut-off is only 0.27 g/t, so rock between 0.27 and 0.5 g/t is still planned as ore.
Price changes the cut-off
When the gold price rises, the cut-off falls, and rock that was waste becomes ore. Agnico Eagle calculated its reserves at US$1,600 per ounce for most operating assets (US$1,500 for the Detour Lake open pit) and its resources at US$2,000 per ounce for most operating assets (Agnico Eagle, 2026). Barrick used US$1,500 for the reserves and US$2,000 for the resources at Pueblo Viejo, which is one reason that mine’s measured and indicated resource (which includes the reserve) is 410 million tonnes at 1.89 g/t while its reserve is 310 million tonnes at 2.06 g/t. Spot gold traded near US$4,066 an ounce on the afternoon of 4 November 2026 (Kitco, 4 November 2026) and near US$4,119 on the morning of 5 November (Kitco, 5 November 2026). Both companies plan with long-term prices well below that spot level, so a reserve statement is not a bet on today’s price. When you read a resource table, find the price assumption first.
Cut-offs can also be built from several metals. At Pueblo Viejo the cut-off is expressed as gold equivalent (AuEq), because silver and sulphur content change recovery and cost. For blocks with about 7.9% sulphide sulphur, the AuEq cut-off ranges from 1.17 to 1.29 g/t AuEq (Barrick, 2026). Some mines use a net smelter return in dollars per tonne instead of a grade, such as LaRonde, which Agnico Eagle states in Canadian dollars per tonne.
Grade times tonnage: how much gold is in a deposit
The size of a gold deposit is calculated from two numbers:
Chart
Bigger reserves grade lower
Proven and probable gold reserves, selected Agnico Eagle operations and projects, 31 December 2025
Contained gold (oz) = tonnes of ore x grade (g/t) / 31.1035
Worked example: 10 million tonnes at 1.5 g/t holds 15 million grams, or 15,000 kg, of gold. Divide by 31.1035 and you get about 482,000 troy ounces. At 3 g/t the same tonnage holds about 964,000 ounces. Doubling the grade doubles the gold, as does doubling the tonnage. Check any company claim with this line. Detour Lake: 798 million tonnes at 0.72 g/t gives 18.5 million ounces, against the 18.6 million in the report (the small gap is rounding of the grade). Pueblo Viejo: 310 million tonnes at 2.06 g/t gives 20.5 million ounces, against 20 million reported.
The trade-off between grade and tonnage is the heart of deposit economics. The plot below shows eight Agnico Eagle reserves, with tonnage on a log scale. The big deposits are near 1 g/t, and the narrow underground ones are high in grade but small in tonnage. A grade-tonnage curve is the standard way to show this inside one deposit: it plots how many tonnes lie above each cut-off, and what their average grade is. The video below shows one built from satellite targets in a demo project.
Contained gold is not recovered gold
The contained ounces in a resource table are the gold that is in the rock. They are not what you sell. Gold is recovered by crushing, grinding and leaching or gravity concentration, and some is lost to tailings. Recovery is the share captured. Agnico Eagle lists metallurgical recovery next to each reserve: 88.8% at Canadian Malartic, 88.4% at Detour Lake and 94.4% at LaRonde. San Nicolás is the exception at 17.6% for gold, because it is a copper-zinc deposit where gold is a by-product and most of it is not recovered as gold. At Pueblo Viejo, processed ore averaged an 87% recovery for 2010 to 2025 (Barrick, 2026).
The chain from rock to bar is: contained gold, times recovery, gives recovered gold; times the price gives revenue; less cost gives margin. A mill head grade of 1.5 g/t at 90% recovery delivers 1.35 g/t, or about 0.043 ounces per tonne. The calculator below walks through this and shows your own break-even grade.
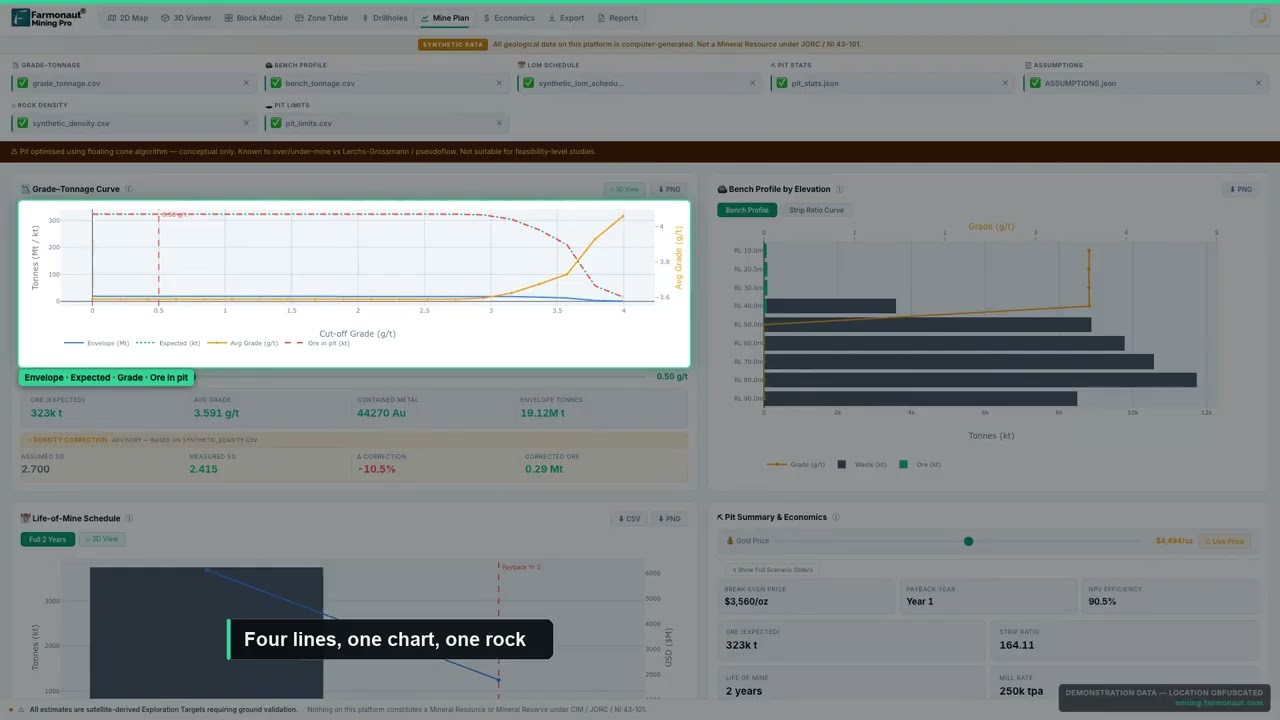
▶ A grade-tonnage curve built in Farmonaut Mining Pro from a satellite gold survey, and why it has the shape it does (de-identified demo data). · 4:46
Gold value calculator: ounces, margin and break-even grade
Use the calculator below to test a deposit. The break-even grade is the grade at which revenue per tonne equals cost per tonne. Compare it with the cut-offs listed above: 0.27 g/t is the cut-off at Detour Lake, a very large open pit, and 4.00 g/t is the cut-off at Hope Bay, an underground project in Nunavut.
Calculator
How much gold is in my ore, and what grade breaks even?
Enter your own tonnes, grade, recovery, price and cost. Every default is an example.
- Recovered gold (oz): 43,403
- Revenue per tonne (US$): $174
- Margin per tonne (US$): $114
- Break-even grade (g/t): 0.52
- Grade in oz per 100 short tons: 4.38
Example values only, not a benchmark. Uses 31.1035 g per troy ounce (NIST SP 811). Price is an example, use today’s price (Kitco bid was US$4,073.40 per ounce on 10 November 2026, 7:32 a.m. ET); all money is in US$ and the cost per tonne is an example covering mining, processing and overheads.
How geologists estimate the quantity of gold in a deposit
No one measures the gold in a deposit directly. The quantity is estimated from samples, and the estimate carries a confidence level that is stated in public reports. The steps below follow the Pueblo Viejo technical report, which is one of the most detailed public descriptions of the workflow, and the JORC and CIM standards.
- Drill and sample. Drill core or chips are cut into intervals. At Pueblo Viejo the standard geochemical sample length is 2.0 m, shortened where the geology changes (Barrick, 2026).
- Assay. A lab measures the gold. Fire assay is the benchmark method: the sample is melted with lead-bearing flux, the gold collects in a lead button, and the lead is removed to leave a bead that is measured. Labs offer 30 g or 50 g charges with detection ranges from 0.001 to 10 ppm and gravimetric finish for high grades (ALS Geochemistry). At Pueblo Viejo, samples above 10 g/t are re-assayed by gravimetric finish.
- Check the lab. Each batch carries certified reference materials, blanks and duplicates, so a drift in the lab shows up before it enters the model.
- Measure density. Tonnes need volume times density. Pueblo Viejo measures dry bulk density by the Archimedes water-immersion method on core, then uses a regression on sulphur to assign density to blocks.
- Model the geology. A 3D wireframe or grade shell outlines the mineralised body. At Pueblo Viejo the shell used 6.0 m composites and a 1.0 g/t gold threshold.
- Deal with outliers. A few extreme assays can inflate an estimate, so they are capped or limited in how far they spread. Pueblo Viejo limits high grades in selected domains to a 50 m x 50 m x 50 m zone around the sample.
- Estimate block grades. Geostatistics, usually kriging, estimates grade in each block from nearby samples. Pueblo Viejo used ordinary kriging with 3 x 3 x 5 m block discretisation.
- Apply the cut-off and a pit shell. Only blocks that meet the economic test count, which is the “reasonable prospects” requirement discussed above.
- Classify the confidence. Resources are Inferred, Indicated or Measured. An Inferred resource rests on limited evidence that implies but does not verify continuity. An Indicated resource has enough detail to apply modifying factors for mine planning. A Measured resource has enough detail for detailed planning and final economic evaluation (JORC Code, 2012). Only the Indicated and Measured categories can be converted to reserves.
For a plain-language walk through each category and the NI 43-101 rules, see our guide to mineral resource estimation, and for how to read a JORC resource table, our JORC guide. A Competent Person (JORC) or Qualified Person (NI 43-101) has to sign the estimate. Anyone can publish a number in g/t, but only a professional who takes responsibility for the sampling, the lab data and the method can publish a resource.
The nugget effect: why gold grades jump
Gold often occurs as scattered particles, so two samples a short distance apart can differ by a factor of ten. Geostatisticians call the random, short-range part of that variation the nugget effect. At Pueblo Viejo the modelled nugget is about 15 to 30% of the total variance for gold, which the authors consider appropriate for that style of mineralisation. Where coarse gold is common, estimators expect a larger nugget share and may take more or larger samples, such as 50 g charges. A short result, a single hole or a high-grade grab sample should never be read as the grade of a deposit.
How to read a drill intercept in g/t
News releases report drill results as an intercept: a length and a grade, for example “12 m at 3.4 g/t”. That is a length-weighted average of the assays inside the interval. Example: a 2 m sample at 10 g/t and an 8 m sample at 1 g/t give (2 x 10 + 8 x 1) / 10 = 2.8 g/t over 10 m. A “including” line inside an intercept names the richest part, such as “including 1 m at 22 g/t”, which should not be read as the whole width.
Check four things when you read an intercept:
- Length versus true width. A hole that cuts a dipping vein at a low angle drills a longer length than the real thickness of the vein. The true width is what matters for tonnage. Our guide to strike length and true width explains the calculation.
- Cut-off applied. Companies state the lower cut they used, and a low cut can stretch an intercept with lean rock.
- Capping. Check whether high assays were cut.
- Depth and spacing. One hole is one line through the ground. A resource needs a pattern of holes, and the closer the spacing, the higher the confidence class.
If you are weighing whether a drill plan is likely to hit, see how deep gold is found, which covers depth. Grade and depth together decide cost.
Where satellite data fits with grade
A satellite cannot read grade in g/t. Satellites map surface and near-surface signatures: iron-oxide staining, clay and mica alteration, silica, and faults and fracture patterns. Sampling and drilling then confirm what is there. The practical use for a licence holder is to rank ground before spending on assays, by finding which parts of a licence share the signatures of known gold systems. A Farmonaut satellite mineral report delivers such a ranked list of exploration targets in 5 to 20 business days, from a KML, KMZ or polygon boundary. Targets are exploration targets, not a resource under JORC, NI 43-101 or SAMREC. For the report format, see the sample exploration report, and for the wider method, satellite-based mineral detection.
The reader of any estimate should keep the order of confidence clear: the grade is measured at the lab, the tonnage is modelled between holes, and the economics rest on a price and a cost assumption that change each year.
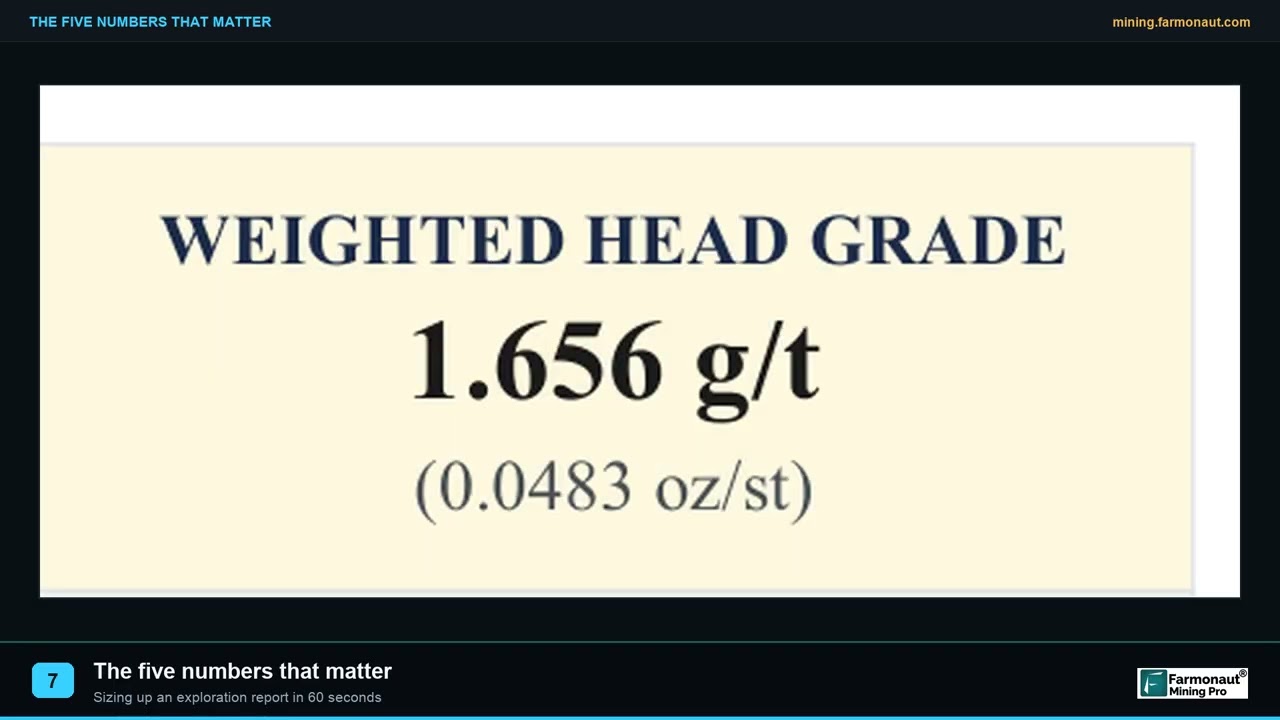
▶ The five numbers that matter in a satellite gold report. · 2:00
Frequently asked questions
What does g/t mean in gold mining?
It means grams per tonne: the grams of gold in each metric tonne of rock. 1 g/t is 1 ppm. The unit is used for gold, silver and platinum-group metals because those metals occur at very low concentrations.
Is g/t the same as ppm?
Yes. A tonne is 1,000,000 grams, so 1 gram in a tonne is 1 part in a million. A lab certificate that reads 3.2 ppm Au is 3.2 g/t.
How do I convert g/t to oz/t?
Divide by 34.2857 for troy ounces per short ton (US filings), or by 31.1035 for troy ounces per metric tonne. For example, 5 g/t is 0.146 oz per short ton and 0.161 oz per tonne.
What is a good gold grade?
It depends on the mining method. In Agnico Eagle’s year-end 2025 reserves, the biggest open pits average 0.7 to 1 g/t, while underground mines range from 1.6 g/t (Goldex) to 8.84 g/t (Macassa). Cost, size and recovery decide whether a grade pays.
How many tonnes of ore make one ounce of gold?
Divide 31.1035 by the grade in g/t. A 1 g/t ore needs about 31 tonnes per ounce, a 5 g/t ore about 6.2 tonnes, and a 10 g/t ore about 3.1 tonnes, before recovery losses.
What is cut-off grade?
It is the lowest grade at which a block of rock is worth mining and processing. Below it the block is waste. It varies with price, cost and recovery, from 0.27 g/t at Detour Lake to 4.00 g/t at Hope Bay in Agnico Eagle’s tables.
How do geologists estimate the quantity of gold in a deposit?
They drill, sample and assay the rock, measure density, model the mineralised body, estimate block grades by geostatistics, apply a cut-off, and classify the result as Inferred, Indicated or Measured. A qualified professional signs it off.
What is the difference between a resource and a reserve?
A resource is the part of a deposit that could be mined economically in the future. A reserve is the part of Measured and Indicated resources that has been shown, by studies on mining, processing and cost, to be economic. Reserves therefore use stricter assumptions.
Why do companies report grade and ounces separately?
Because the same ounces can come from very different projects. 18 million ounces at 0.72 g/t needs an enormous pit, while 1.9 million ounces at 8.84 g/t can come from a compact underground mine.
How is gold grade measured in the lab?
The standard method is fire assay on a 30 g or 50 g charge, with an atomic absorption, ICP or gravimetric finish, depending on the expected grade (ALS Geochemistry). Samples above the top of the range are re-run by a gravimetric method.
Can a high-grade drill result be trusted?
Treat it as a sign of mineralisation, not as the grade of the deposit. Gold is often patchy, so a single high result needs repeat assays, nearby holes and an estimate across the whole body.
What gold price is used to report reserves?
Each company states its own long-term assumption in the table notes. Agnico Eagle used US$1,600 per ounce for most reserves and US$2,000 for resources at year-end 2025. These are planning prices, not forecasts.
This page is for information only. It is not investment advice. Grades, tonnages and cut-offs are company-reported figures at the dates shown and change with each update. Satellite results are exploration targets, not a resource under JORC, NI 43-101 or SAMREC.
Farmonaut mining
Rank your licence before you drill
Send a boundary and get a satellite screening report that maps alteration and surface signatures as exploration targets in 5 to 20 business days.

Mining Pro sample view, synthetic data
Sources
- Agnico Eagle, Q4 and full-year 2025 results with reserve and resource tables (February 2026): s205.q4cdn.com
- Barrick, Pueblo Viejo Mine technical report (February 2026): s25.q4cdn.com
- JORC Code (2012): jorc.org
- CIM Definition Standards for Mineral Resources and Mineral Reserves (2014): mrmr.cim.org
- NIST SP 811, Appendix B.8: factors for units: nist.gov
- USGS Circular 603, Gold in meteorites and in the earth’s crust (1968): pubs.usgs.gov
- USGS Mineral Commodity Summaries 2026: Gold: pubs.usgs.gov
- ALS Geochemistry, Gold by fire assay: alsglobal.com
- Kitco, Gold climbs above $4,000 (4 November 2026): kitco.com
- Kitco, Gold climbs above $4,100 (5 November 2026): kitco.com
Discussion
Questions, corrections or field experience? Share them below. First-time comments are reviewed before they appear, and your email is never published.
No comments yet. Be the first to add a question or your experience.

 Sahel Shipping SA
 Sania Corporation
 Sean Mining Limited
 NTS Group (Pty) Ltd
 Mine4Africa
 Lithspo Minerals Limited
 Tintina Mining Group
 Dalgety Minerals Pty Ltd
 Vortex Minerals Pty Ltd
 Faith At Work (Pty) Ltd
 Geotech Mining Solutions plc
 Vulcan International Limited
 Kidepo Associates
 GKY Mining
 Alkimy SARL
 Double A Trading
 GemSprout Metals Limited
 Qader Group
 Ileys General Trading
 SG Gold Mining LLC
 VRV Global Pte Ltd
 Omsri International FZE
 G.I.T.T.
 Jaunita Erss Ltd

 Client · Tanzania · Gold
 Client & affiliate partner · Ghana · Gold










