

Sample report · What you get
Mineral Exploration Report Sample: What Is Inside
A mineral exploration report sample from Farmonaut, shown page by page: the summary, the ranked zones, the drilling plan and the 3D models. Every page is from a SAMPLE report on a DEMO licence with synthetic data, not a real client.
Key takeaways
- The pages shown are from a SAMPLE report on a DEMO licence: synthetic data, a placeholder client, and no real result.
- The sample Premium report runs to 86 pages and Premium+ to 128, each with a PDF and georeferenced GIS files; Premium+ adds TargetMax drilling intelligence and 3D models.
- Zones are judged on two scales: signal strength (Strong to Marginal) and confidence tier (High, Medium, Low). The ranked order tells you which zone to sample first.
- Exploration targets are not a mineral resource: under the JORC Code an exploration target is potential with too little exploration to estimate one.
- To start, send a KML, KMZ or polygon, the country and the mineral; delivery takes 5-20 business days.
In this article
A mineral exploration report sample answers one question before you spend anything: what exactly will I receive? This page walks through a sample Farmonaut satellite mineral report, section by section, using pages from our demonstration reports. Each page is explained in plain words: what it shows and what a licence holder does with it.
Read this first: every report page shown on this page comes from a SAMPLE report written for a DEMO licence. The data is synthetic, the client is a placeholder called “Sample Client”, and none of it describes a real licence, a real company or a real result. The numbers inside the sample pages are not results, so this page does not quote them. It describes what each table and map is for.
What you get in a Farmonaut satellite mineral report
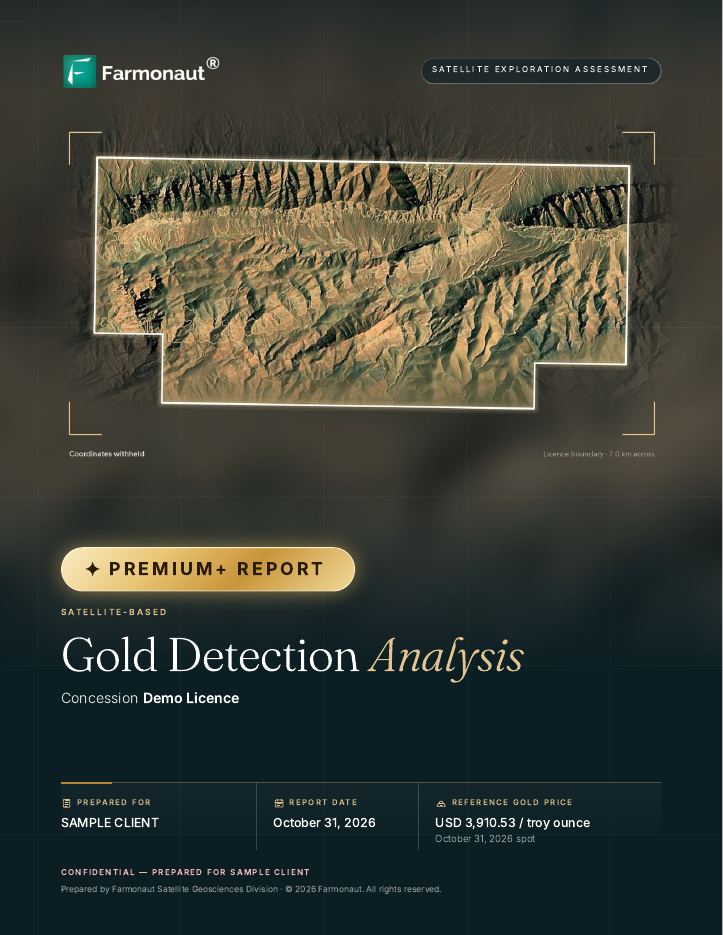
A Farmonaut satellite mineral report is a written, mapped screening of your licence area from space. It finds ground that looks like the mineral you are after, ranks it, and tells you where to put your first samples. The sample reports run to 86 pages (Premium) and 128 pages (Premium+).
You receive the work in these forms:
- A PDF report. Maps, tables and a plain-language reading of each zone, in the order shown in the tour below.
- Georeferenced GIS files. The zones as polygons with their scores and attributes, and the underlying rasters. The sample file list includes GeoJSON zones, GeoTIFF layers at 30 m and 10 m pixel size, and the overlay images used in the report, so your own mapper can open them in the GIS software they already use.
- 3D views and models (Premium+). Rendered 3D scenes, plus model files in DXF, OBJ and OMF formats that import into mine-planning software such as Leapfrog Geo, Maptek Vulcan, GEOVIA Surpac and Datamine.
The report covers gold, silver, copper and a long list of other minerals; the mineral is chosen when you ask for a quote. The sample pages here are from a gold report.
A tour of the report, section by section
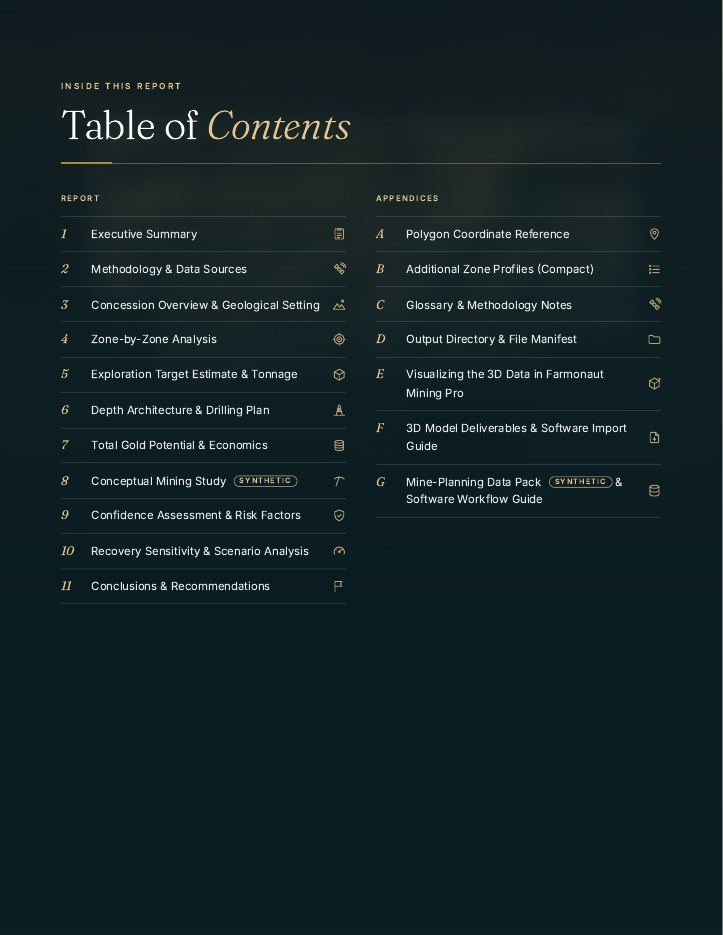
The sample opens with a contents page. Chapters one to eleven hold the findings; appendices A to G hold the raw material and the files. The Premium sample has ten chapters and four appendices.
Executive summary
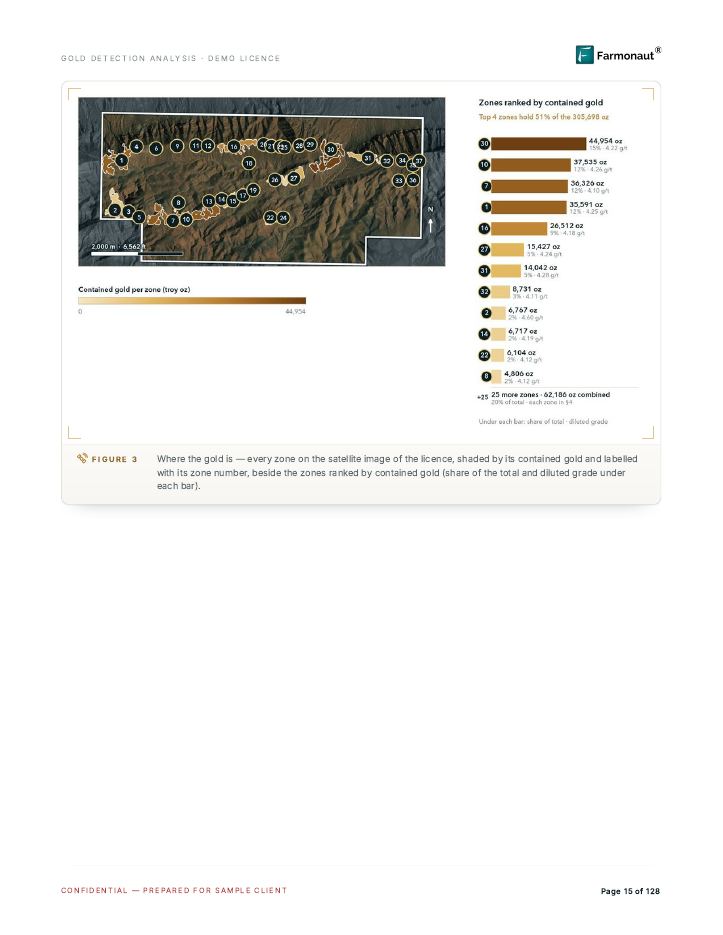
This is the two-page answer for someone who will not read the rest. It states how many anomaly zones were found, how they split by confidence, how deep they are likely to sit, and what decides whether the ground is worth drilling. In the Premium+ sample a bottom-line box and a sensitivity table open the chapter; a Key Metrics Dashboard and a “Key Findings at a Glance” list follow.
How a holder uses it: to decide in five minutes whether the licence deserves a sampling budget, and to forward to a partner or lender who wants the short version. A zone map on the page after the summary shows every detected zone, numbered, on the satellite image of the licence.
Methodology and data sources
Here the report lists what was measured and how. The sample combines optical imagery from Sentinel-2, short-wave infrared mapping from ASTER, radar from Sentinel-1 and PALSAR, thermal data from MODIS, a regional magnetic model and a terrain model. Each source answers a different question. Radar from Sentinel-1 works day and night and in all weather, so it sees surface texture and structure through cloud. The short-wave infrared bands on ASTER (30 m pixels) are the ones that pick up clay and alteration minerals.
The chapter also explains how the pixels become zones, how a target tonnage is worked out, and how to read the colour legends printed on the maps.
How a holder uses it: to see exactly which satellites and layers support each finding, and to hand the method to a geologist or buyer who wants to check it.
Concession overview and geological setting
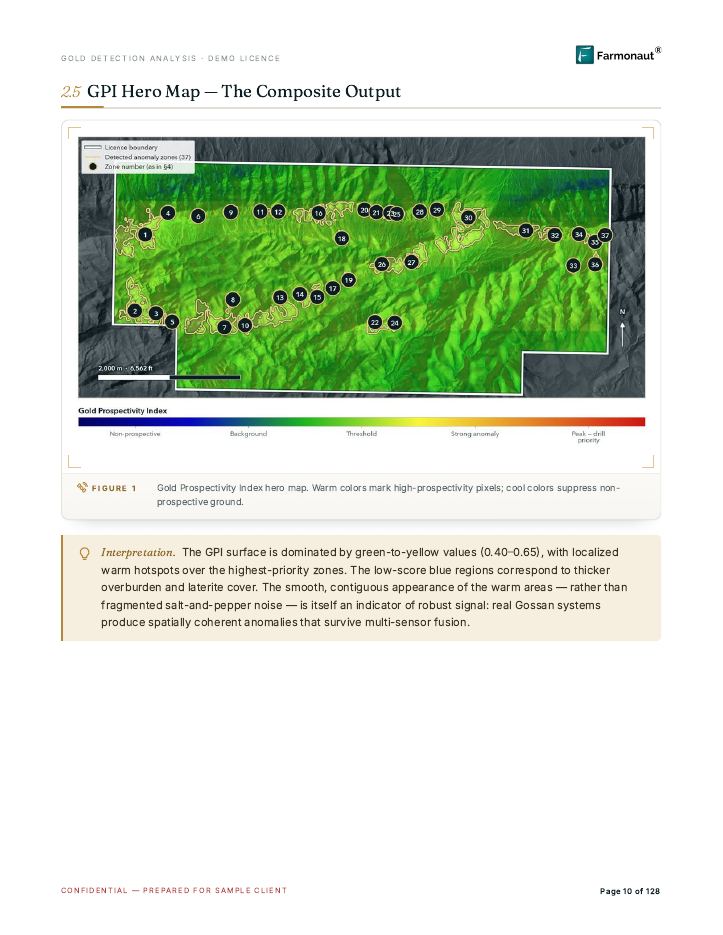
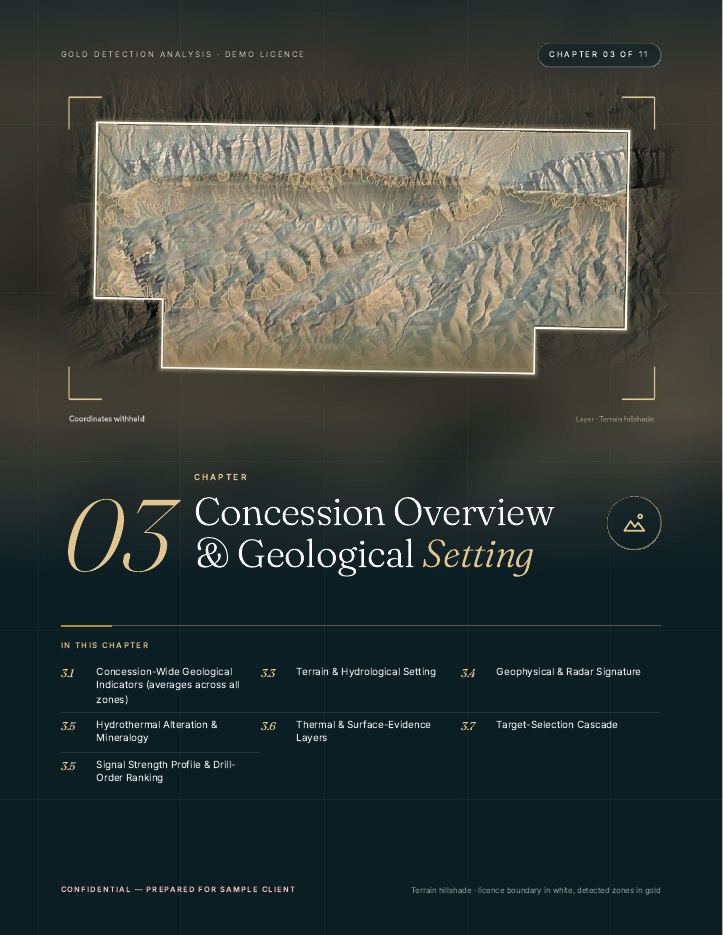
This chapter describes your ground layer by layer: terrain and drainage, radar and structure, alteration minerals, thermal and surface-evidence layers, and a ranking of how strong each signal family is across the whole licence. Each layer is a map with a colour key and a short interpretation box underneath.
How a holder uses it: to understand the ground before walking it. A licence holder can see where the faults line up, where the soil is bare enough to be read, and where thick cover hides the signal, which tells the field crew where a sample can and cannot say much.
Zone-by-zone analysis
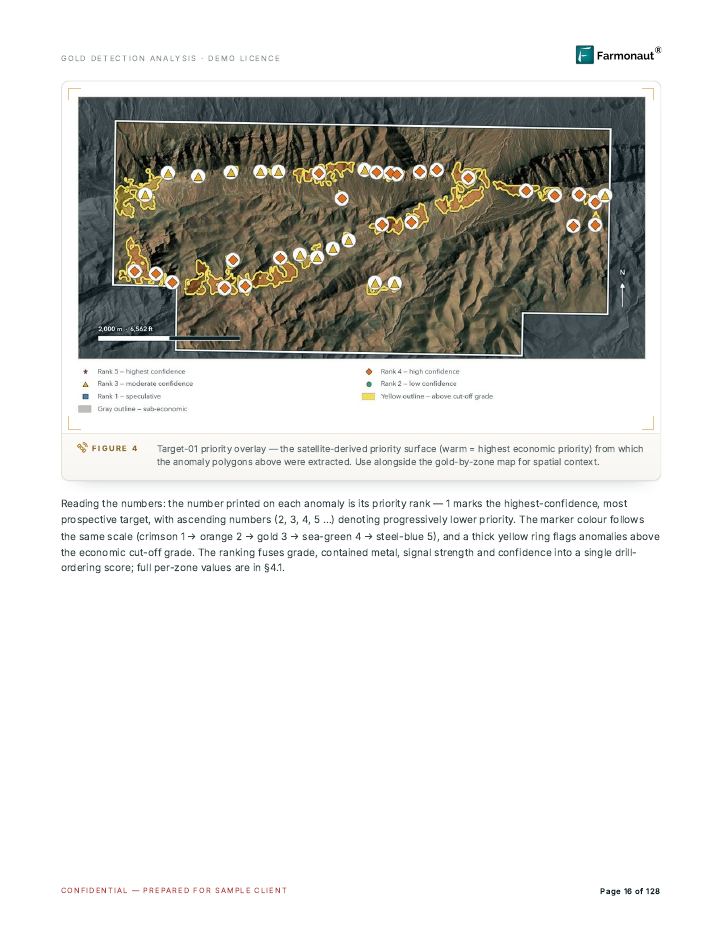
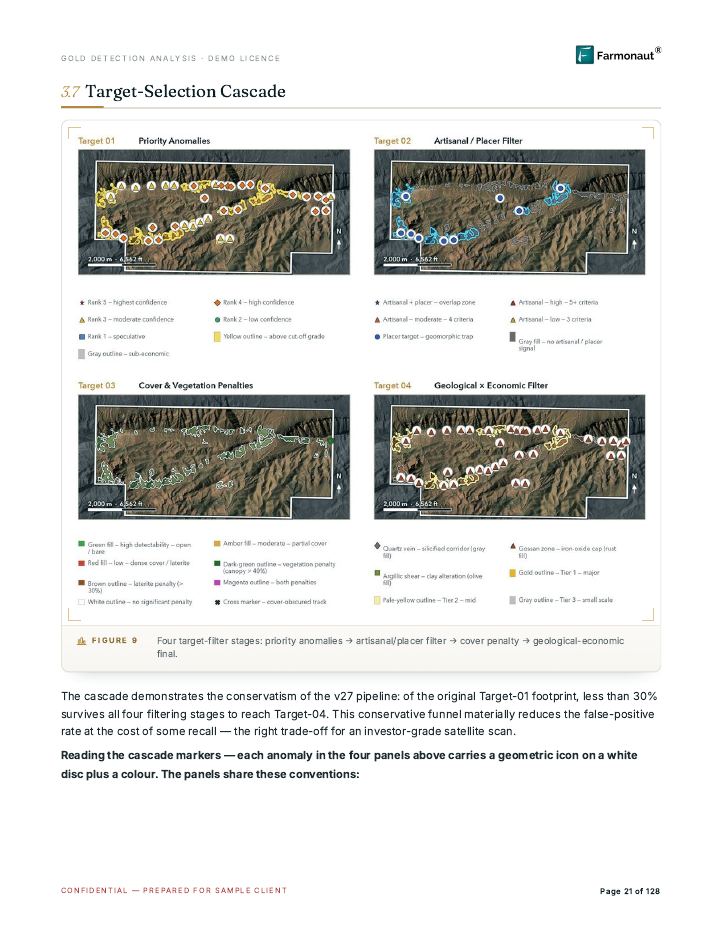
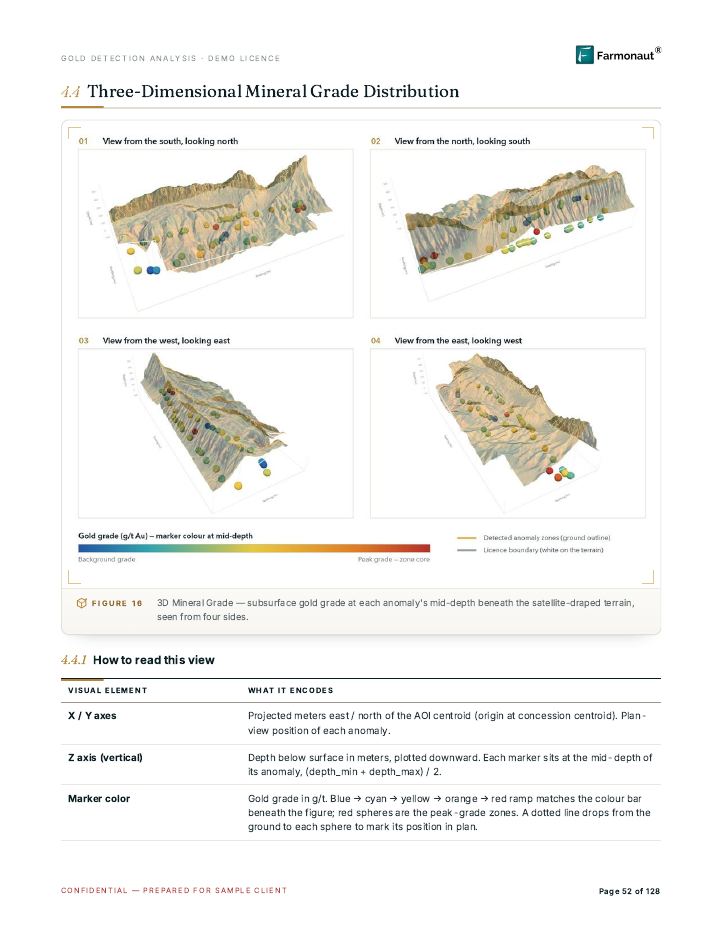
The core of the report. A master comparison table puts every detected zone side by side: its priority, tier, strike length, signal strength and confidence, with an estimated grade range and tonnage per zone. After the table come detailed profile pages for the strongest zones, each with its own map, signal chart and notes. A priority overlay map marks each zone with its rank, the target-selection cascade narrows the list in four filter steps, and a final section shows the zones in 3D above the satellite-draped terrain.
How a holder uses it: to pick which zone to sample first. You start at the top of the ranked table, open that zone’s profile page, and read what the satellite layers agree on before you commit a field team.
Exploration target estimate and tonnage reconciliation
This chapter turns each zone’s footprint into an exploration target: area, modelled thickness, rock density and a dilution allowance, shown both undiluted and diluted so you can see how the number was built. The estimate is a target, not a resource. Reporting codes treat the two very differently: the JORC Code defines an exploration target as potential that has had too little exploration to estimate a mineral resource, and says it must not be presented as one. Canada’s NI 43-101 sets its own disclosure rules for mineral projects. A Farmonaut report is neither a JORC nor an NI 43-101 document.
How a holder uses it: to compare zones by size, and to explain to a partner what the number is and what it is not. Drilling and sampling are what could turn a target into a resource.
Depth architecture and drilling plan
For each zone the report estimates the cover depth, the top and base of the likely mineralised body, and a suggested drilling geometry: compass direction, hole angle, hole length, number of holes and method (the Premium sample has this table too; Premium+ adds the TargetMax drilling intelligence and the 3D plan views). Typical depth estimates in our reports run to about 225-250 m. A strip ratio page shows how much waste rock would sit above the target if it were ever mined from the surface.
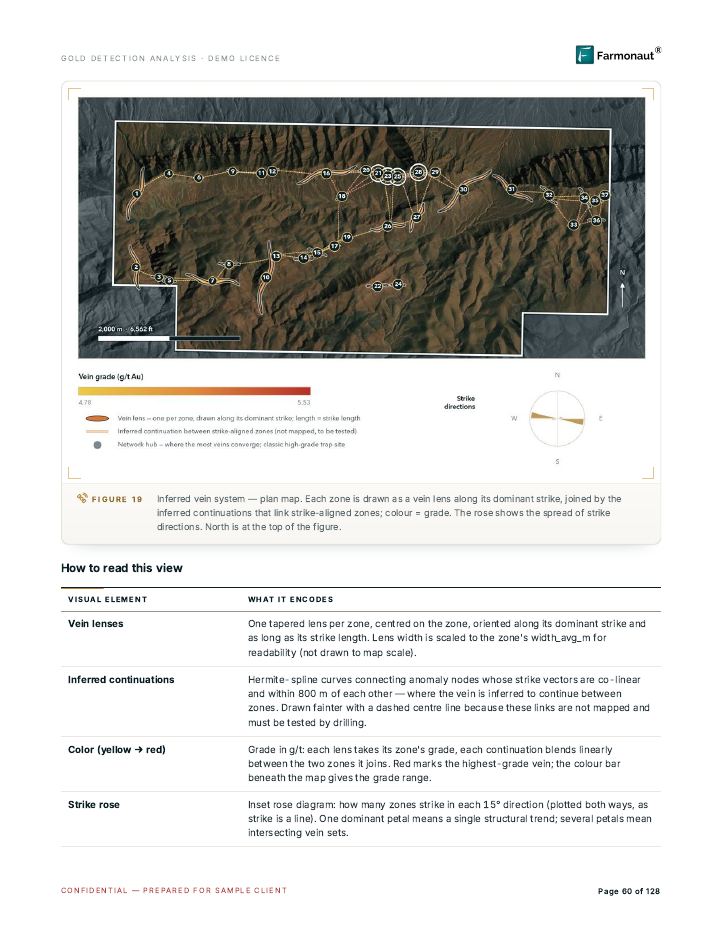
How a holder uses it: to brief a drilling contractor with a starting plan, and to see early whether the target sits shallow enough for the kind of work you can afford. Premium+ also draws an inferred vein plan: each zone becomes a lens along its likely strike, and dashed lines show where the report infers a link between zones, links that drilling has to test.
Total potential and economics
The economics chapters put a conceptual price on the targets, show how the answer moves as the metal price and the recovery change, and list the assumptions behind them. The Premium+ sample adds a conceptual mining study, clearly labelled SYNTHETIC, with a pit shell, grade and tonnage curves and a conceptual schedule, plus geology cross-sections.
How a holder uses it: to see which assumptions the answer depends on, so you know what the first drill holes have to test. These pages guide scoping; they are not a feasibility study.
Confidence assessment and risk factors
Every zone carries a confidence label, and the rule that sets the label is printed in full so anyone can recompute it. This chapter also lists the checks that disagreed with the main signal on individual zones, such as a zone clipped by the licence edge or a layer that does not match the structure around it.
How a holder uses it: to see where the report is least certain and plan the cheapest ground check for those zones first.
Conclusions and phased plan
The last chapters give the order of work: what to sample or map first, what to drill next, and what each phase should answer before the next one is paid for.
Appendices: coordinates, glossary, file manifest and 3D deliverables
The appendices hold the polygon coordinates, a compact profile for every extra zone, a glossary of terms, and a manifest that names every delivered file and what it contains. The Premium+ sample adds guides for loading the 3D models into mine-planning software and a synthetic mine-planning data pack. The pack’s drillholes and block values are generated examples that show the file format, not measurements.
How to read a zone page
Every zone in the report is judged on two separate scales. Keep them apart.
Signal strength: how loud is the satellite evidence
Each zone is placed in a class: Strong, Moderate, Weak or Marginal. The class is a summary of several signal families that are checked independently, among them alteration minerals, thermal contrast, radar roughness, magnetic response, structure lines, vegetation stress and bare ground. The class is the report’s headline roll-up of those families. A zone that stands out on a signal that is quiet across the rest of the licence deserves a closer look, because the neighbouring ground does not repeat it.
Confidence tier: how much to trust the strength
The tier is High, Medium or Low. It comes from the signal class and from how many independent cross-checks disagreed with it. In the sample, a High zone is a Strong zone with few or minor disagreements; a Medium zone has a real signal but at least one layer that does not support it; a Low zone has partial surface evidence. The sample states that tiers set the order of work, not whether a zone is checked: all three tiers go into the validation plan.
Ranked order: where to go first
The drill-order table ranks zones by priority, with the first tier meaning drill first and the last tier meaning watch and validate. It combines how many signal families are Strong, how many are Moderate, the headline class and the count of risk flags.
A worked way to use these three together
- Open the ranked table and take the top zones that are Strong and High confidence.
- Read each zone’s profile page. Check that the alteration, structure and radar layers point the same way.
- Check the access notes, such as stream distance and terrain, so the first samples are cheap to collect.
- Plan soil or rock sampling and mapping over those zones before any drilling.
- Send the results back into the plan. A zone that samples well moves up; one that does not moves down.
Satellites map surface and near-surface signatures; drilling and sampling confirm them. The report is built to make your first field dollar land on the right ground.
Premium and Premium+: what is different
Both reports start from the same satellite analysis of your area. Premium+ adds drilling intelligence and 3D work on top.
| Feature | Premium | Premium+ |
|---|---|---|
| Satellite analysis of your licence, ranked zones, maps | Yes | Yes |
| Executive summary, methodology, zone-by-zone analysis, confidence assessment | Yes | Yes |
| Estimated location and depth range of each zone | Yes | Yes |
| PDF report and georeferenced GIS files | Yes | Yes |
| TargetMax drilling intelligence: drilling-angle recommendations and higher intersection probability | No | Yes |
| Interactive 3D subsurface models of structures and mineral distribution | No | Yes |
| Conceptual mining study and mine-planning data pack (shown as synthetic in the sample) | No | In the sample |
| Sample length | 86 pages | 128 pages |
A holder who wants to know which part of the ground to sample usually starts with Premium. A holder planning a drill programme, or one talking to a drilling contractor or investor, gets more from the Premium+ drilling and 3D pages. Tell us which fits when you ask for a quote.
What to send to start
You need three things:
- Your area. A KML or KMZ file of the licence, or the polygon coordinates. The recommended minimum area is 10 acres.
- The country or region. It sets the terrain and climate rules the analysis applies.
- The mineral. The one you want to find, such as gold, copper or lithium.
Farmonaut picks the satellite data that suits the mineral and ground, runs the analysis, and delivers in 5-20 business days, depending on area size and mineral complexity. Our check your licence area page helps you confirm the area you hold.
To ask for a quote, use the form at the bottom of this page. Our cadastre portal guide by country helps you find your licence boundary if you only hold paper maps.
Where this sample sits in the picture
The sample answers “what is in the report”. Two other pages answer the questions on either side of it. How satellite mineral exploration works explains the method step by step, and satellite mineral exploration results shows what clients found when they went to the ground. If you are weighing satellites against soil sampling or geophysics, satellite vs geochemistry vs geophysics compares them.
For what comes after the report, three guides cover the field steps: geophysical survey companies, geological core samples and exploration drilling rigs. Holders in Tanzania can start from the Tanzania cadastre and licence guide, and small-scale miners from the artisanal mining licence guide. Check with the ministry before you apply for or change any licence.
Frequently asked questions
Is the sample report a real client’s report?
No. It is a sample written for a demo licence with synthetic data. The client is a placeholder, the licence does not exist and the numbers are invented to show the layout. Real reports use your own licence boundary and your own satellite data.
Does the report give me a mineral resource I can put in a filing?
No. The report gives exploration targets: ranked zones with estimated location, depth range and indicative quantity. A mineral resource under JORC, NI 43-101 or SAMREC needs drilling, sampling and a qualified person. The report tells you where to start that work.
How deep can the satellite analysis see?
Satellites read the surface and the ground just below it. The report estimates depth ranges for each zone using terrain, structure and the way the surface signal is built, typically to about 225-250 m. These are estimates to plan sampling and drilling, and the drill result is the measurement.
What area is the minimum?
We recommend at least 10 acres.
How long does a report take and which files do I get?
Delivery takes 5-20 business days, depending on the size of the area and how complex the mineral is. You get the PDF report and georeferenced GIS files. Premium+ also includes the 3D models and the drilling pages shown above.
Can I use the report with my own geologist?
Yes, that is the usual way. The method page, the data dictionary and the confidence rule are all written so a geologist can check how each zone was scored, and the GIS files open in the software they already use.
This page is for information only. The sample reports use synthetic data for a demo licence and are not a real client’s results. Satellite exploration targets are not a mineral resource or reserve under JORC, NI 43-101 or SAMREC. Confirm any licence rules with the regulator.
Farmonaut mining
Get a report like this for your own licence
Send your area, country and mineral, and we will quote a Premium or Premium+ satellite report with delivery in 5-20 business days.

Mining Pro sample view, synthetic data
Sources
- JORC Code, 2012 Edition, Exploration Targets (Australasian Joint Ore Reserves Committee): jorc.org
- Ontario Securities Commission, National Instrument 43-101 Standards of Disclosure for Mineral Projects: osc.ca
- Copernicus Data Space Ecosystem, Sentinel-1 data collection: dataspace.copernicus.eu
- NASA/USGS LP DAAC, ASTER L1T product description: lpdaac.usgs.gov
Discussion
Questions, corrections or field experience? Share them below. First-time comments are reviewed before they appear, and your email is never published.
No comments yet. Be the first to add a question or your experience.

 Tipareth Mines
 GemSprout Metals Limited
 Qader Group
 Ileys General Trading
 SG Gold Mining LLC
 VRV Global Pte Ltd
 Omsri International FZE
 G.I.T.T.
 Jaunita Erss Ltd
 Almosi SARL
 SRK Consulting
 Berks Gold Limited
 Mwerezi Minerals Company Limited
 Mining SARL
 SenGold Invest SAS
 Sean Mining Limited
 NTS Group (Pty) Ltd
 Mine4Africa











