

Reviewed September 2026 against USDA NASS, NOAA National Weather Service, and peer-reviewed US yield-loss research.
Try it: Run your own numbers →
A weather forecast for agriculture is only useful if it changes what you do that day. The US National Weather Service publishes Quantitative Precipitation Forecasts with a 7-day lead time (NOAA NWS, 2024), but a raw forecast doesn’t tell a wheat grower in Kansas whether that rain window means spray now or wait, or tell a Central Valley almond grower whether frost risk justifies running the wind machines tonight. That gap — between a forecast and a farm decision — is what a farmers weather forecast app is supposed to close. This guide covers what these apps actually do, where forecast accuracy breaks down during extreme weather, and how to check the data yourself rather than take a vendor’s word for it.
Why Generic Weather Forecasts Fall Short for Farmers
The core problem isn’t forecast availability — it’s forecast translation. A forecast that says “above-normal rainfall probability” doesn’t tell a corn grower that excessive rainfall cut US maize yields by an average of 17%, and by as much as 34%, in affected years between 1981 and 2016 (Li et al., Global Change Biology, 2019).
This is the case for an AI-powered farmers weather app: not a prettier forecast, but one that sits on top of raw NWS data and translates probability into a recommendation — spray, hold, irrigate, protect. Farmonaut’s platform pulls real-time conditions, short- and long-term forecasts, and historical weather data into one view, then layers crop-specific alerts on top so a wheat frost warning and a cotton heat-unit alert don’t look the same.
What a Farmers Weekly Weather Forecast Should Actually Contain
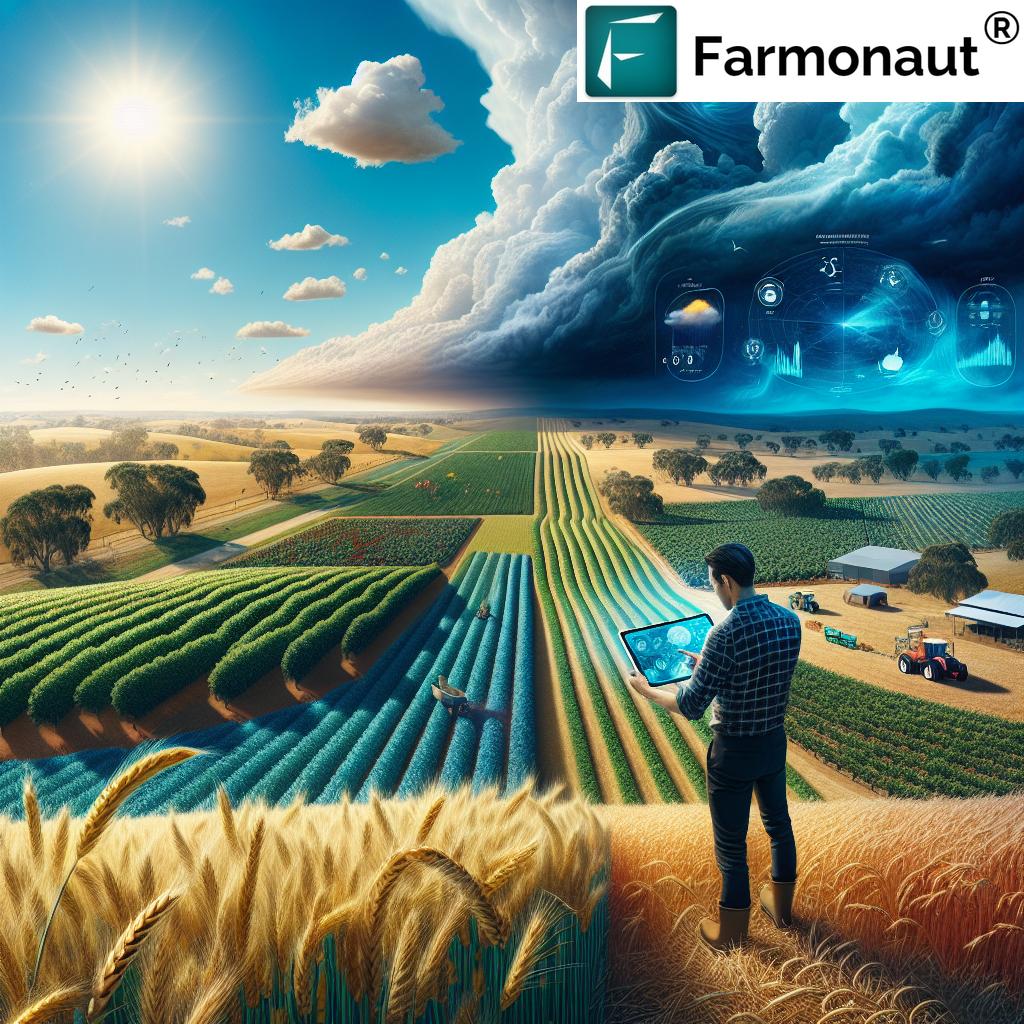
A farmers weekly weather forecast is only as good as the fields it reports. At minimum, it needs to answer five questions a daily forecast can’t: what’s the disease pressure this week, when’s the next dry window for harvest, is there a frost risk in the next 5 days, what’s the irrigation deficit building up to, and is a spray window closing.
This structure matters because the NWS 7-day Quantitative Precipitation Forecast (NOAA NWS QPF portal) gives you the raw probability, but it takes a farm-facing layer to turn “1.2 to 2.0 inches over 3 days” into “spray before Thursday or wait a week.” Farmonaut’s Jeevn AI Advisory System does that translation using your specific crop type, soil conditions, and local forecast, rather than a one-size-fits-all threshold.
Building (or Buying) an AI-Powered Farmers Weather App
If you’re evaluating whether to build an AI-powered farmers weather app in-house or license an existing platform, the honest answer depends on scale. The question for most operations is build versus buy.
For most operations — the average US farm was 463 acres in 2022, with 1.9 million farms on 880.1 million acres (USDA NASS 2022 Census of Agriculture) — building an in-house AI weather stack from scratch means procuring satellite feeds, training crop-stress models, and maintaining forecast APIs indefinitely. That’s a multi-year, multi-engineer commitment most farms of this size can’t justify. Licensing an existing platform with an open API is the faster path, and it’s why Farmonaut publishes both a weather and satellite API and full developer documentation for teams that want to plug real-time weather, historical data, and crop-specific indices directly into an existing farm management system rather than build one from zero.

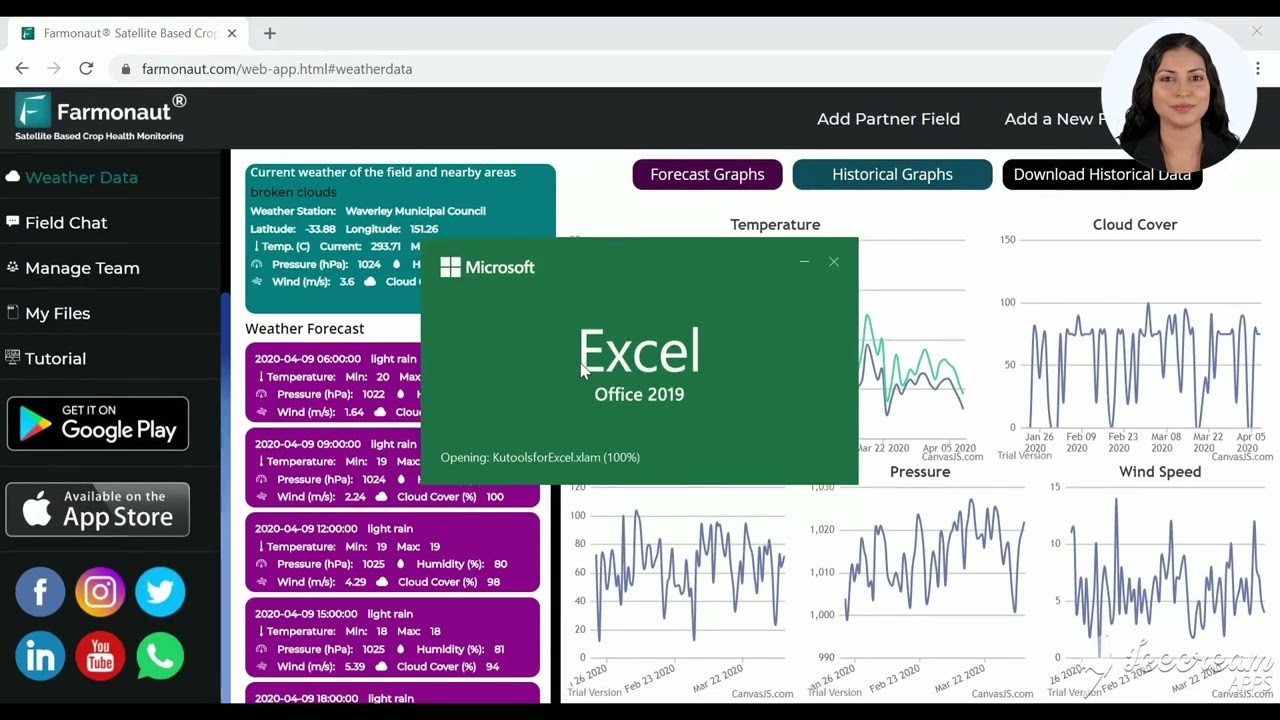
The video above walks through downloading and interpreting weather data on Farmonaut’s platform — useful whether you’re evaluating the app directly or scoping what an in-house build would need to replicate.
Agricultural Weather Forecasting Companies: What to Compare
“Agricultural weather forecasting companies” is a broad category — some sell hardware (on-farm weather stations), some sell software layered on public NWS/NOAA data, and some sell both. When you’re comparing vendors, the questions that actually differentiate them are: does the platform integrate satellite imagery alongside weather data, does it offer crop-specific alert thresholds rather than generic severe-weather warnings, is historical weather data included for trend analysis, and is there an API for custom integration. Farmonaut’s platform answers yes to all four — combining remote sensing vegetation health indices (NDVI), soil moisture analysis, and weather intelligence in one system, rather than weather as a bolt-on feature.
Check current vendor quotes rather than assuming last year’s price sheet still holds.
Radar, Synoptic Charts, and Satellite Layers
Precision farming weather tools typically layer three data types on top of the base forecast: radar maps, synoptic charts, and remote sensing. Radar maps give real-time precipitation tracking for immediate decisions — is that storm cell going to reach the field in the next 20 minutes. Synoptic charts show the broader pressure systems driving next week’s pattern. Satellite imagery adds a visual layer: cloud cover, and — combined with NDVI — vegetation health, which lets you cross-reference “did the forecast rain actually help” against measured crop response rather than assumption.


Remote Sensing Layered on Weather Data
Remote sensing in agriculture is what separates a weather app from a full crop-monitoring platform. On its own, weather data tells you what happened in the sky. Combined with satellite imagery, it tells you what happened to the crop:
- Vegetation health indices (NDVI) for early detection of crop stress, cross-checked against recent rainfall or heat events
- Soil moisture analysis for precision irrigation timing, rather than a fixed calendar schedule
- Crop yield estimation that factors in the season’s actual weather pattern, not just historical averages
- Early detection of pest and disease pressure that often follows specific humidity and temperature windows
This is the layer that matters most in an extreme season: a weather forecast alone may miss the severity of an extreme event’s impact, but satellite-measured vegetation stress shows the actual damage as it develops, days before it’s visible from the ground.
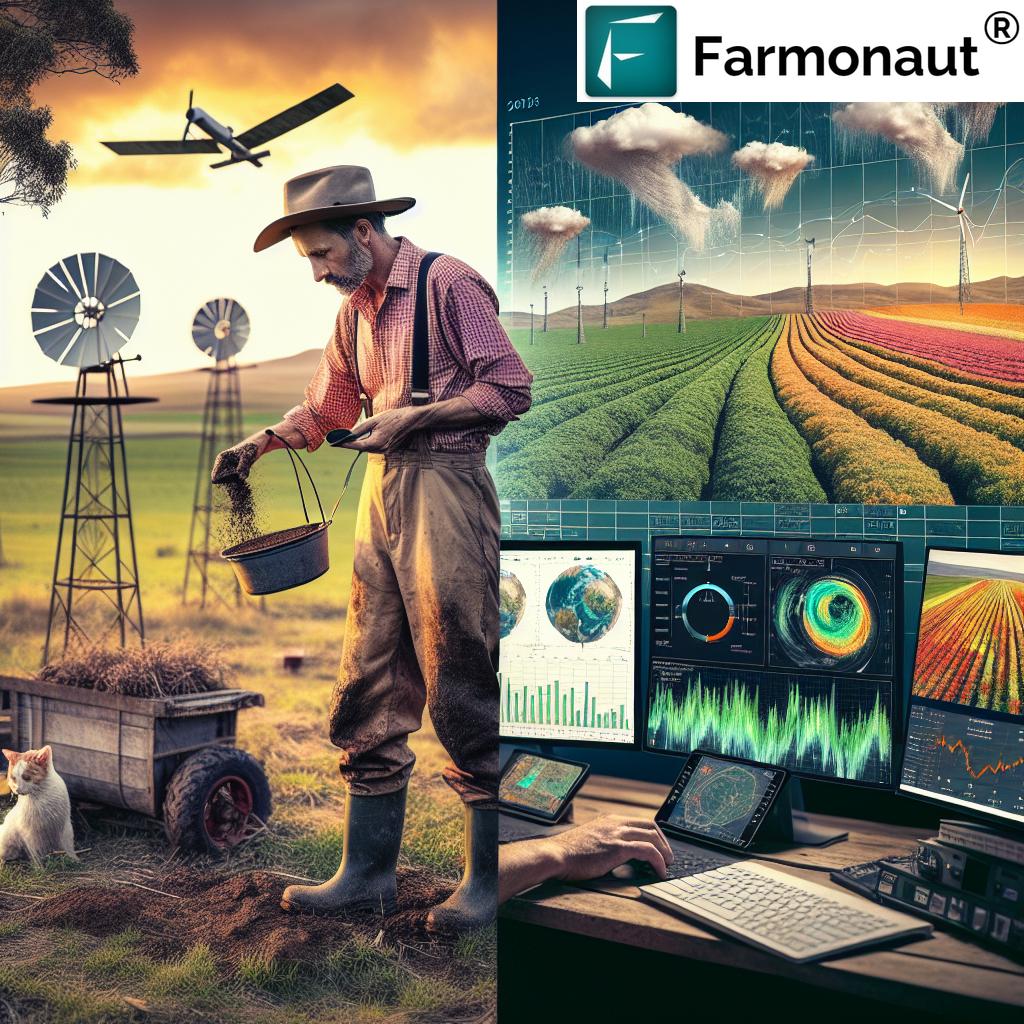

The video above covers integrating weather data via the Farmonaut API — the same integration path referenced for custom builds above.
Regional Weather Forecast Needs: US, Canada, UK, and Australia
“Weather forecast farmers australia” is one of the higher-volume queries this page serves, alongside farmers across North America and Europe, so it’s worth being specific about what changes by region rather than treating “agricultural weather” as one undifferentiated product.
- US Corn Belt and Great Plains: Excessive-rainfall risk to maize (averaging 17% yield loss, up to 34% in the worst years per the study cited above) and drought risk to wheat are the two dominant concerns; frost windows matter most at planting and late-season harvest.
- Canadian Prairies: Drought is the headline risk for wheat, with frost alerts needed at both ends of the season.
- UK arable regions: Forecast needs center on rainfall timing around planting and harvest windows, with Defra as the relevant government data source for regional agricultural statistics.
- Australian agricultural zones: Fire danger indices and UV index sit alongside standard forecast fields because of bushfire risk, with ABARES as the relevant national data source.
A weather app built for one region and relabeled for another usually gets this wrong — showing fire danger ratings to a UK wheat grower who’ll never use them, or omitting frost alerts for a Prairie grower who needs them every spring. Farmonaut’s platform adjusts which fields surface by region rather than showing a fixed template everywhere.
Free Weather Forecasts for Australian Farmers
Most Australian growers start with the Bureau of Meteorology (BOM), and its main farm tools cost nothing:
| Tool | What it gives a farmer | Source |
|---|---|---|
| BOM Weather app | Hourly forecasts for 72 hours (temperature, UV, humidity, dew point, wind, gust, rain), 7-day forecast, fire danger rating, rain radar 90 minutes back and forward, alerts for up to 3 locations. Free and ad-free. | BOM Weather app |
| MetEye | 7-day frost forecast, which replaced the old Frost Potential map from August 2024 | BOM MetEye |
| Water and the Land | Forecast rainfall and wind maps, 3-month rainfall outlook, potential frost days, recent and average evapotranspiration | BOM Water and the Land |
| Long-range forecasts | Outlooks for the weeks, months and season ahead | BOM long-range forecasts |
| SILO | Daily climate data from 1889 to the present for more than 18,700 stations, point or gridded, free under a CC BY 4.0 licence; run by Queensland Treasury | SILO |
A sensible routine: check the app’s hourly rain and wind before spraying, MetEye’s frost forecast before a cold night in flowering or emergence, and the 3-month outlook before sowing decisions. SILO is the one to use for your paddock’s rainfall history when you want to compare this season with past ones, or feed a crop model. A paid farm app earns its keep only if it adds something on top of these, such as crop-specific alerts or satellite crop-health maps.
Weather-Based Decision Support for Specific Crops
Different crops carry different weather sensitivities, and a genuinely useful farmers weather app reflects that rather than issuing one generic alert type to every user:
- Wheat: Frost risk alerts, heat-stress warnings, and harvest timing keyed to moisture levels.
- Corn/Maize: Excessive-rainfall alerts, since the 17% average and 34% peak yield losses from excess rain are driven by timing as much as total volume.
- Cotton: Heat-unit accumulation tracking, irrigation scheduling, and boll-opening forecasts.
- Soybeans: Disease-pressure forecasting keyed to humidity and temperature windows, plus harvest-window dry-spell tracking.
- Fruit and orchard crops: Chill-hour accumulation, bloom-time prediction, and frost-protection alerts timed to bud stage.
Integrating Weather Intelligence into Daily Farm Management
A forecast only pays off if it’s checked and acted on. The integration sequence that gets the most value out of a farmers weather forecast app looks like this:
- Daily weather check: Review current conditions and the updated short-range forecast each morning.
- Task scheduling: Adjust the day’s and week’s field tasks against the forecast — not the calendar.
- Resource allocation: Use the precipitation forecast to decide whether irrigation runs today or waits.
- Risk management: Act on frost, heat, or storm alerts before the event, not after.
- Crop health cross-check: Compare the forecast against satellite-measured vegetation health to confirm the crop is responding as expected, or flag stress it wouldn’t otherwise be able to explain from weather data alone.

This video demonstrates Farmonaut’s web app and satellite-based crop monitoring, showing how weather intelligence connects with other precision farming tools on the same platform, and how these forecasts inform decisions like crop rotation planning for the following season.
Estimate Your Rainfall Risk: Spray Window Calculator
Use the calculator below to estimate how many usable spray or field-work days you’ll have this week, based on your forecast rainfall total and how much rain your equipment can tolerate before a field becomes inaccessible.
Run your own numbers
Assumes a 7-day window and one closing event per rain total exceeding the threshold; excludes wind, temperature, and soil-type effects on drying time. Cross-check against your own NWS forecast and field conditions before scheduling.
Forecast Accuracy: What Improves It and What Doesn’t
It’s worth being direct about forecast accuracy rather than implying any app makes forecasts perfect. The NWS 7-day QPF lead time (NOAA NWS) is a well-established, publicly verifiable baseline — check the QPF portal directly for current skill scores in your region before trusting any vendor’s accuracy claim at face value. What an AI layer adds isn’t a better raw forecast than NOAA’s models produce; it’s translation of that forecast into a farm-specific action, and cross-validation against satellite-measured crop response so a bad forecast doesn’t go undetected until harvest.
The practical takeaway: trust short-range forecasts for tactical decisions (spray, irrigate, harvest this week), and treat long-range seasonal outlooks as directional risk signals rather than precise yield predictions, especially in a year shaping up to include extreme events.
Farmonaut’s API for Custom Weather Integration
For agribusinesses building their own tools rather than using an app directly, Farmonaut’s API exposes real-time weather data, historical records, crop-specific weather indices, and satellite-derived vegetation health metrics through a single integration. This is the same infrastructure referenced in the build-vs-buy comparison above — rather than standing up separate satellite and weather data pipelines, a development team can pull both through one API, documented in full at the developer docs.

This tutorial covers generating time-lapse visualizations through the API, useful for tracking how a season’s weather pattern correlates with measured crop change over time — relevant for teams building climate-related agricultural risk tools.
How to Verify Any Forecast Claim Yourself
Rather than take any app’s accuracy claim on faith, here’s the durable check: pull the NOAA NWS QPF portal for your county and compare its stated forecast skill score against what the app you’re evaluating reports for the same period. If a vendor can’t show you their forecast against the NWS baseline for your region, that’s the question to ask before subscribing. For farm-count and acreage figures used for scale comparisons, USDA NASS’s Census of Agriculture is republished on a multi-year cycle with annual interim updates — check data.nass.usda.gov’s Farms and Land in Farms charts directly for the current year’s preliminary figures rather than relying on a fixed number from any article, including this one.
Farmonaut Subscriptions
Further reading:
Frequently Asked Questions
- What’s the best weather app for farmers?
The best app for your operation is the one that combines your region’s actual forecast data with crop-specific thresholds, not a generic severe-weather push notification. Compare candidates on: does it integrate satellite/NDVI data, does it offer crop-specific alerts, and does it expose an API if you need custom integration. - How often is weather data updated?
Farmonaut’s platform updates weather data multiple times daily. For the underlying NWS raw forecast skill scores, NOAA’s Climate Prediction Center updates monthly — check the QPF portal directly for the current figure. - Can the app be customized for specific crop types?
Yes — alert thresholds are set per crop type and growth stage rather than one fixed severe-weather threshold for all users. - How accurate are long-range seasonal forecasts?
Treat them as directional risk signals, not precise predictions. - Does this work for farms outside the US?
Yes — coverage extends to major agricultural regions in Canada, the UK, the EU, and Australia, with region-specific fields (e.g., fire danger index for Australia, frost alerts for Prairie wheat). - How do I integrate this into existing farm management software?
Through the API — see the developer docs linked above for endpoint details and authentication. - Are there mobile apps?
Yes, Android and iOS apps are both available, linked above. - Does the app help with frost prediction?
Yes — frost risk alerts are included and tied to crop-specific frost tolerance where that data is set.
A forecast alone can’t tell you what to do about the weather — that’s the layer worth paying for. Whether you use an existing app, license an API into your own system, or build from scratch, the questions to ask are the same: what’s the actual NWS lead time and skill score for your region, does the platform translate that into a crop-specific action, and can you verify the numbers yourself rather than take them on faith.

 Doodlakine
 Nale Network
 Exurbia Geospatial
 FieldZero
 Indico Company
 Kubota
 FFBS
FFBS Jontra
 Kalustyan
 Tucor
Tucor Geno
Geno Hayleys Agriculture
 Linx Agritech
 Adinet
