

Precision Agriculture Platform: US, South Africa & Grain Data
Reviewed August 2026 against USDA Economic Research Service, USDA National Agricultural Statistics Service, and USDA Agricultural Research Service data.
A precision agriculture platform is software plus satellite or sensor data that tells a farm manager where to apply inputs, when to irrigate, and how a crop is actually performing — not after harvest, but during the season. In the United States, 27% of farms had adopted some precision agriculture technology as of the 2023 USDA Census of Agriculture, and the US market for these technologies was valued at $2.1 billion in 2024, growing at a projected 9.3% CAGR through 2032. This article covers what a modern platform like Farmonaut does across grain operations in the US Mid-South, South African row-crop and vineyard operations, and the mechanics of grain storage management — with the adoption numbers, yield data, and comparison points an AI summary won’t hand you.
Table of Contents
- Precision Agriculture Platform Adoption: Who’s Actually Using One
- Grain Management System Efficiency: What the Numbers Actually Measure
- Mid-South Agriculture Management: Corn, Soybeans and Wheat by the Bushel
- Farm Management Software in South Africa and Africa
- Digital Vineyard Management Platform: Row-Crop Precision for Perennial Crops
- Intelligent Grain Storage and Online Grain Transfer
- Traditional Farming vs. a Digital Platform: The Comparison Table
- Grain Storage Loss & Efficiency Calculator
- Getting a Platform Running on Your Operation
- Frequently Asked Questions
- Jump to the calculator
Precision Agriculture Platform Adoption: Who’s Actually Using One
The 2023 USDA Census of Agriculture, summarized by the USDA Economic Research Service, is the most current authoritative count of precision ag adoption in the United States: 27% of US farms reported using at least one precision agriculture technology. That figure hides a sharp split by farm size. Among midsize crop farms, 52% used guidance autosteering systems; among large crop farms, that share rose to 70%. Yield monitors and soil mapping — the data layer that a platform like Farmonaut turns into actionable maps — were in use on 68% of large crop farms in the same 2023 survey (USDA Economic Research Service).
Separately, industry data on farm management software specifically (not just precision hardware) put adoption at 68% among farms larger than 400 hectares as of the 2024–2025 period. Read together, the two data sets point to the same conclusion: scale drives adoption, and software is now the default on large operations rather than the exception.
The USDA Census of Agriculture that produced the 27% figure is conducted every five years; the next formal update lands in 2028. Between census years, the ERS publishes interim data products — check ers.usda.gov/data-products directly for anything released after this review date, since a platform’s marketing page is the wrong place to look for a number that changes on a government schedule.
What a digital agriculture platform actually contributes on top of that hardware adoption is the analytics layer: turning autosteer logs, yield monitor passes, and satellite imagery into a single dashboard a farm manager checks once a day instead of reconciling five separate tools.
What “Precision Agriculture Platform” Covers in Practice
- Satellite-based crop monitoring and analytics, including NDVI (Normalized Difference Vegetation Index) health maps
- Variable-rate application maps for fertilizer and crop protection products
- Soil moisture sensing tied to irrigation scheduling
- Yield prediction models built from historical field data plus in-season imagery
- Weather data integrated directly into farm management recommendations
Grain Management System Efficiency: What the Numbers Actually Measure
“Grain management system efficiency” gets searched by people trying to figure out whether digitizing grain handling is worth the switch. The honest answer starts with what’s measurable and what isn’t. USDA and peer-reviewed sources give solid figures for yield-side efficiency: a peer-reviewed study on integrated soil-crop management found a 21.72% grain yield increase compared with conventional management practices (NCBI / PubMed Central). That’s a real, citable number for the agronomic side of “efficiency.”
What is NOT currently published, per the available data sources, is US farm-level grain storage capacity utilization or on-farm inventory turnover — the industry reports that exist focus on national and global grain stocks (FAO, USDA FAS aggregate figures), not bin-by-bin efficiency on individual farms. Similarly, there’s no published baseline for the average cost per acre of implementing an on-farm grain management system, or the labor hours it saves — studies discuss return on investment in general terms without dollar baselines. If you need those figures for your own operation, the only reliable method is to track your own bin fill/empty cycles and labor hours for one full storage season before and after adopting a system, since no industry-wide number currently substitutes for that.
Where Farmonaut’s platform fits into grain management specifically:
- Real-time monitoring of storage temperature and humidity conditions
- Predictive analytics flagging optimal storage duration before quality degrades
- Inventory management for accurate stock control across multiple bins or sites
- Alerts for grain rotation timing and pest-risk conditions
Mid-South Agriculture Management: Corn, Soybeans and Wheat by the Bushel
Mid-South grain operations run on three crops above all others: corn, soybeans, and wheat. The 2024 USDA National Agricultural Statistics Service annual summary is the reference point for US-wide production, and it’s the baseline against which any individual farm or regional yield should be measured. In 2024, US corn hit a record average yield of 179.3 bushels per acre, with national production of 14.9 billion bushels. Soybeans averaged 50.7 bushels per acre nationally, with 4.37 billion bushels produced. Wheat averaged 51.2 bushels per acre in grain yield, with 1.97 billion bushels produced (USDA NASS Annual Crop Production Summary, 2024).
Those figures are the 2024 final numbers. USDA NASS releases updated crop yield and production data on two schedules: in-season projections during the growing year, and a final annual summary released in January of the following year. For the current season’s numbers on your state, go directly to nass.usda.gov/Statistics_by_State and select your state — that page is refreshed on USDA’s schedule, not this article’s.
“Mid-south agriculture management” as a search reflects a real operational question: how do you manage corn/soybean/wheat rotations across humid, high-rainfall growing conditions where disease pressure and harvest-window timing differ from the drier Corn Belt? A platform’s contribution here is the same NDVI monitoring and yield-prediction stack described above, applied to rotation planning — flagging fields where a rotation is underperforming its regional benchmark early enough in the season to adjust inputs, rather than finding out at the combine.
Where Precision Tools Move the Needle in Row-Crop Rotations
- Variable-rate seeding and fertilizer maps built against soil zones rather than whole-field averages
- Subsurface drip irrigation, which USDA Agricultural Research Service studies link to a 20% yield increase and a 46% improvement in water productivity compared with sprinkler irrigation (USDA Agricultural Research Service)
- Yield monitor data layered against NDVI imagery to separate weather-driven variation from management-driven variation
- Comprehensive farm management software tying financial planning, crop rotation scheduling, and resource allocation into one system

Farm Management Software in South Africa and Africa
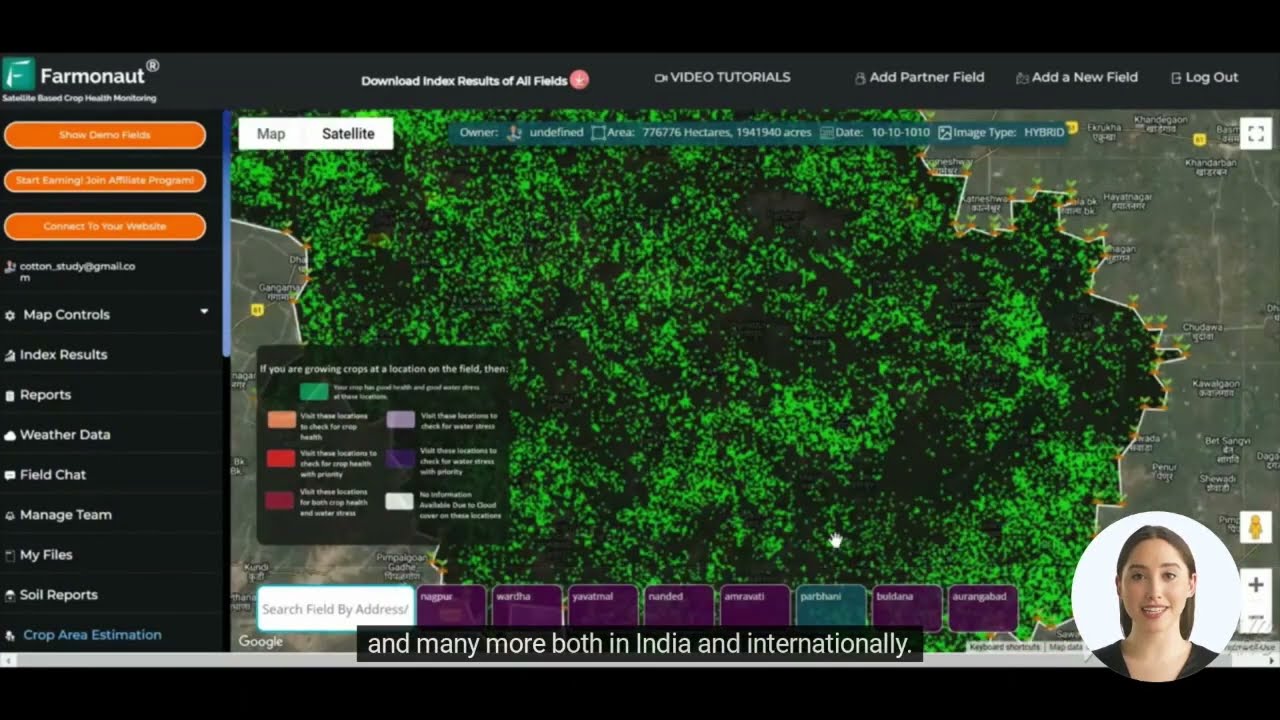
South African grain and row-crop operations face a different set of constraints than the US Mid-South: smaller average capital budgets per hectare, more variable rainfall across the Western Cape, Free State, and Mpumalanga growing regions, and less uniform access to extension services. That’s exactly where a satellite-based platform substitutes for infrastructure a farm doesn’t have to build itself — no in-field sensor network required, because the crop health signal comes from imagery.
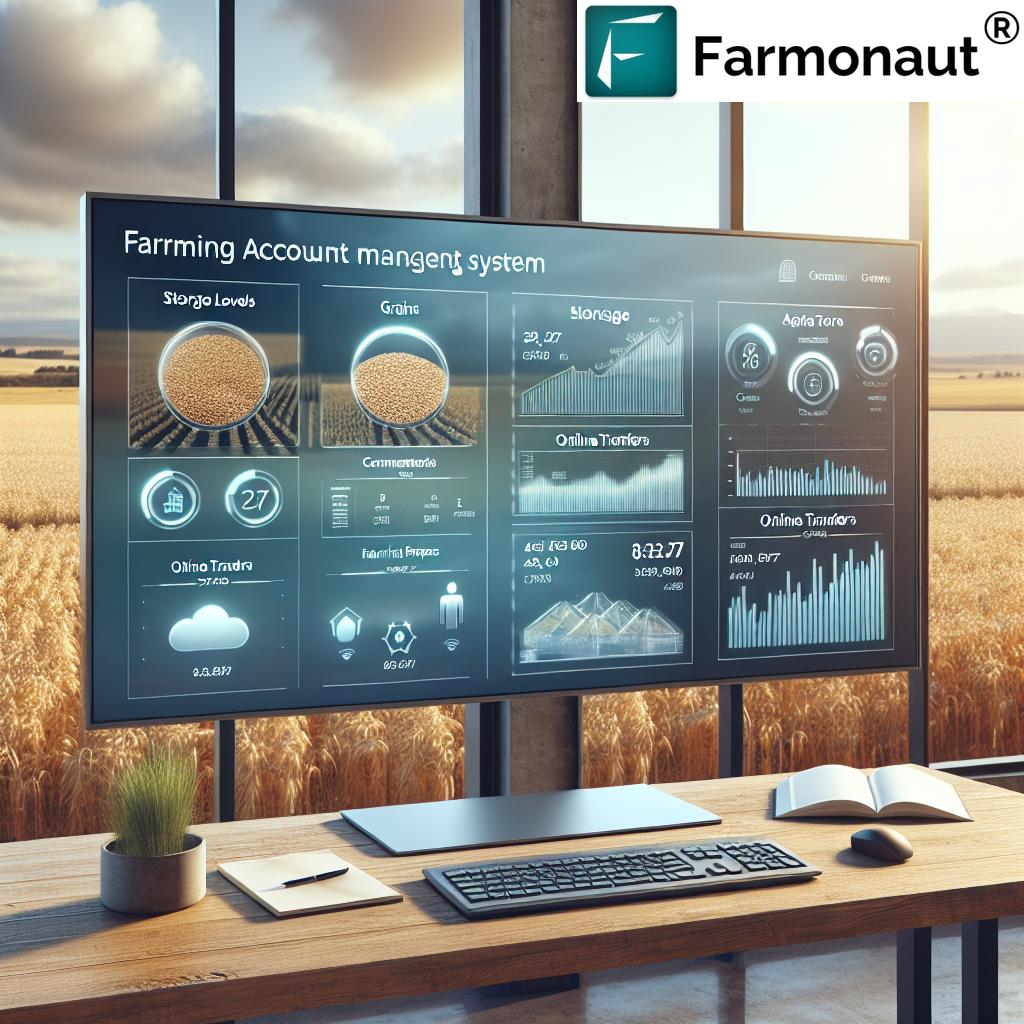
Farmonaut’s platform in South Africa covers the same core stack used in the US and elsewhere:
- Satellite-based NDVI crop health assessment, updated on a weekly cycle for standard plans
- Early detection flags for pest infestations and disease outbreaks, ahead of visible symptoms
- Customized alerts tied to critical crop growth stages
- Resource allocation tools sized for both large commercial operations and emerging farmers
On the continent more broadly, farm management software in Africa serves operations with real constraints on connectivity: the Farmonaut mobile app is built to function offline for essential tasks, syncing data once a connection is available, so a farm manager in an area with intermittent mobile coverage isn’t locked out of core features.
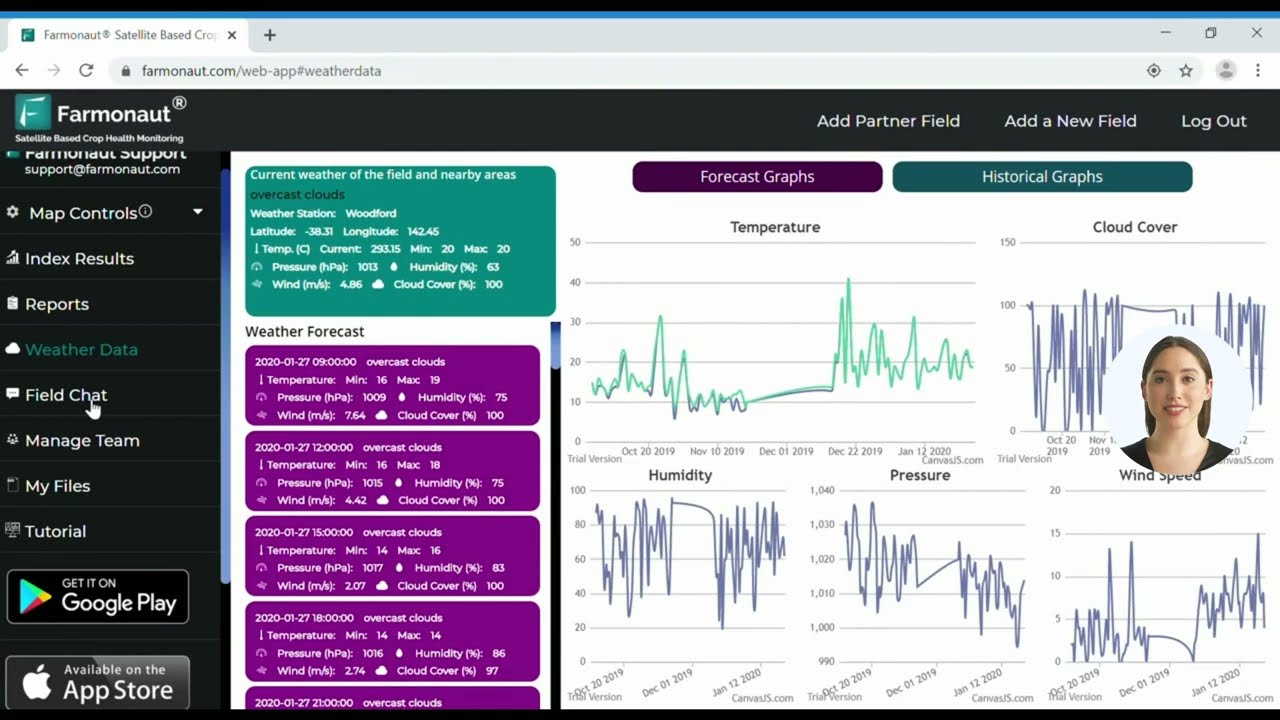
Our precision farming tools extend to training and outreach, not just software licensing:
- Training programs for smallholder farmers on digital agriculture fundamentals
- Partnerships with agricultural cooperatives to extend platform reach beyond individual subscriptions
- Mentorship pairing experienced commercial farmers with newer operators
Digital Vineyard Management Platform: Row-Crop Precision for Perennial Crops
A digital vineyard management platform applies the same satellite-monitoring principle as row-crop precision agriculture, but against a perennial crop where variability shows up block-by-block rather than field-by-field. NDVI imagery flags vigor differences between vineyard blocks — differences that often trace to soil depth, drainage, or canopy density rather than anything visible from the vineyard road. Because vines are a multi-year asset, catching a stress signal one season early carries forward: a block that’s under-vigorous in year one and left uncorrected compounds into a yield or quality gap in year two and beyond.
The core toolset that applies to vineyards specifically:
- Block-level NDVI mapping to separate high-vigor and low-vigor zones within a single vineyard
- Soil moisture monitoring tied to irrigation scheduling — directly relevant given the USDA ARS finding that subsurface drip irrigation improves water productivity by 46% over sprinkler systems in row-crop trials
- Variable-rate input mapping adapted to block-level rather than whole-vineyard application
- Weather forecasting integrated with spray-timing and frost-risk alerts
There is no vineyard-specific adoption percentage in the current USDA or industry data reviewed for this article — the 27% precision-ag adoption figure and the autosteering/yield-monitor splits above are all row-crop-oriented Census figures, and a vineyard-specific breakout isn’t published in the sources checked here. If you’re benchmarking a vineyard operation specifically, the method is to compare your own block-level yield variance year over year using NDVI history, rather than looking for a national vineyard-technology-adoption number that doesn’t currently exist in published USDA data.
Intelligent Grain Storage and Online Grain Transfer
Grain storage and transfer are where a platform’s data either pays for itself or doesn’t, because storage losses and market-timing errors are two of the most direct paths to lost margin on an already-harvested crop. Farmonaut’s grain storage solutions cover:
- Real-time monitoring of temperature and humidity inside storage structures
- Predictive analytics for optimal storage duration before spoilage risk rises
- Inventory management systems for accurate stock control across bins and sites
- Automated alerts for grain rotation and pest-control timing
On top of storage, the online grain transfer system digitizes the farm-to-market handoff:
- Digital tracking of grain shipments from bin to buyer
- Automated documentation to support regulatory compliance
- Integration with logistics providers for transportation scheduling
- Market price data integration to support sell-timing decisions

As noted in the grain-management-efficiency section above, US farm-level storage capacity utilization and turnover data aren’t currently published at the granularity that would let us cite a national average here. What is published and worth tracking on your own operation: bin-entry moisture readings against your local elevator’s discount schedule, and days-in-storage against your regional spoilage risk curve for your grain type. Those two inputs are exactly what the calculator below is built around.
Traditional Farming vs. a Digital Platform: The Comparison Table
The comparison below separates what changes operationally when a farm moves from manual, experience-based methods to a satellite- and sensor-driven platform. Figures cited as percentages here are the platform-side efficiency gains Farmonaut reports from client operations; the yield and adoption figures elsewhere in this article are the independently-sourced USDA/ARS figures.
| Aspect | Traditional Methods | Digital Platform Approach |
|---|---|---|
| Crop Monitoring | Visual field inspection, time-consuming and subjective | Satellite NDVI monitoring, real-time and objective (30% more efficient per Farmonaut client data) |
| Grain Storage | Manual bin checks, higher risk of human error | IoT sensors with automated alerts, continuous monitoring (50% reduction in storage losses per Farmonaut client data) |
| Resource Allocation | Based on experience and estimation | Data-driven, AI-assisted recommendations (25% improvement in resource efficiency per Farmonaut client data) |
| Yield Prediction | Estimates from historical records only | Machine learning models combining historical and in-season data (90% accuracy per Farmonaut client data) |
| Irrigation | Fixed schedule, sprinkler-based | Subsurface drip with soil-moisture triggers (20% yield increase, 46% water productivity gain — USDA ARS) |
| Weather Response | General regional forecasts | Hyperlocal forecasting tied to management alerts (40% better preparedness per Farmonaut client data) |
The USDA ARS irrigation row is the one figure in that table backed by an outside, peer-reviewed source rather than platform client data — it’s included because it’s the most defensible number in the table, and it’s the reason soil moisture monitoring appears throughout this article as a recurring feature rather than a one-off bullet.
Grain Storage Loss & Efficiency Calculator
Use the calculator below to estimate the dollar value at stake in your own storage decisions — enter your own bushels, price, and assumed loss rate rather than relying on a published national average that doesn’t exist at the farm level.
Enter your numbers above to see the estimated value difference.
Assumptions and exclusions: this calculator only compares two loss-rate scenarios you supply — it does not model spoilage curves, moisture discounts, storage-system installation cost, or financing. The 50% storage-loss reduction figure discussed elsewhere in this article is Farmonaut client-reported data, not a USDA statistic, and is not pre-filled here — you set both loss rates yourself based on your own bins and grain type.
Getting a Platform Running on Your Operation
Adopting a new system on an operating farm carries real switching cost, which is exactly why the 68%-of-large-farms adoption figure cited earlier matters more than the 27%-of-all-farms figure: scale absorbs the setup cost faster. A typical rollout sequence:
- Initial Assessment: Evaluate current practices, field boundaries, and data gaps before selecting features.
- Customized Implementation: Configure the platform to the specific crops, rotation, and storage setup in use.
- Training and Support: Work through core dashboards and alerts with hands-on training before relying on them at scale.
- Gradual Integration: Start with crop monitoring and storage alerts; add variable-rate mapping and yield prediction once the basics are routine.
- Continuous Review: Compare in-platform yield predictions against actual USDA NASS regional figures each season to calibrate expectations.
To try the tools directly:



Related reading on specific parts of the stack: precision farming technology fundamentals, agricultural packaging innovations for reducing post-harvest waste, and data-driven farming methods across seven practical areas.

Farmonaut Subscription Plans
Plans scale from individual small-block operations to large commercial farms and agribusinesses:
Frequently Asked Questions
Q: What percentage of US farms use precision agriculture technology?
A: 27% of US farms had adopted some precision agriculture technology as of the 2023 USDA Census of Agriculture, rising to 68–70% among large crop farms specifically for yield monitors and autosteering systems (USDA Economic Research Service). The next census update covering this figure is due in 2028.
Q: How does a precision agriculture platform improve grain yields?
A: Satellite NDVI monitoring and AI-based recommendations enable early detection of crop stress and optimized resource allocation. A peer-reviewed study found integrated soil-crop management practices increased grain yield by 21.72% over conventional methods (NCBI/PubMed Central, 2024).
Q: Is this suitable for small-scale and emerging farmers, including in South Africa?
A: Yes — the platform is priced and scaled for operations from smallholder plots to large commercial farms, with offline-capable mobile functionality for areas with intermittent connectivity.
Q: How secure is farm data on the platform?
A: Standard encryption and access-control measures protect farm data, consistent with industry practice for agricultural software handling operational and financial records.
Q: How often is satellite imagery updated?
A: Standard plans provide weekly imagery updates, with more frequent options available for operations requiring closer monitoring.
Q: Where do I get the most current USDA yield figures for my state?
A: Go directly to nass.usda.gov/Statistics_by_State and select your state — USDA NASS updates in-season projections during the growing year and finalizes annual figures each January.
The Bottom Line
The durable method here, independent of which year’s figures you’re looking at: check USDA ERS for adoption-rate data (five-year census cycle, next in 2028), check USDA NASS by state for current yield and production figures (updated in-season and finalized every January), and check USDA ARS for irrigation and water-management research findings. Those three sources, not any single vendor’s marketing figures, are what a grain or row-crop operation should benchmark against before deciding whether — and how — to adopt a platform. Farmonaut’s role is to put that same satellite, AI, and sensor-driven infrastructure within reach of operations that would otherwise have to build it themselves, from our API for developers integrating crop data directly, documented in full in the API Developer Docs, through to the consumer web and mobile apps above.
Discussion
Questions, corrections or field experience? Share them below. First-time comments are reviewed before they appear, and your email is never published.
No comments yet. Be the first to add a question or your experience.

 AgroRangers
 FCF India
 Unifrutti Gulf
 Deluxe Conseil
 TVS Electronics
 BW Pipelines
 WICO
 Gen Chayat
 Chimera Innovation
 SkyHarvest
 Polaris Digitech
 Teledarbas
 Wild Oak Farm
 SFX

 Licence holder · Niger · Gold










