

Autonomous Farm Equipment Market: US Adoption Data & Costs
Reviewed August 2026 against USDA Economic Research Service, National Agricultural Statistics Service (NASS), and Precedence Research.
Try it: Run your own numbers →
Autosteering guidance is already standard equipment on most large US crop farms: 70% of large-scale operations and 52% of mid-size operations used it in 2023, per USDA’s Economic Research Service. The US autonomous farm equipment market was sized at $25.78 billion in 2024 by Precedence Research. This piece breaks down what’s actually adopted, what it costs installed, and how to check the numbers yourself as they update.
Two different things get lumped under “autonomous farming”: guidance systems that steer a tractor along a line (autosteer), and fully autonomous machines that plan and execute a task with no operator aboard. The adoption data below is almost entirely about the first category — it’s the one with real penetration numbers. Fully driverless field machines exist commercially but USDA does not yet track a separate adoption rate for them, which is itself useful to know before you budget for one.

Table of Contents
- Autosteer & Precision Equipment Adoption, by Farm Size
- Farm Equipment Market Values: What GPS Steering Actually Costs
- Payback: How Long Until a Guidance System Pays for Itself
- Precision Irrigation Equipment: What’s Published, What Isn’t
- The Autonomous Farm Equipment Market Number
- Automated Farming Equipment Beyond Steering
- Autonomous Tractors: Where the Market Actually Stands
- Calculator: GPS Steering Payback for Your Acreage
- Autonomous Agriculture and the Labor Question
- FAQ
- Try it: Run your own numbers
Autosteer & Precision Equipment Adoption, by Farm Size
USDA’s Economic Research Service publishes farm-size adoption breakdowns for precision technologies using survey data. As of the 2023 survey round: 70% of large-scale crop farms and 52% of mid-size crop farms used autosteering guidance systems on tractors and harvesters. Separately, 68% of large-scale crop farms used yield monitors, yield maps, and soil maps — the data layer that makes variable-rate application possible. Both figures come from the same ERS chart series, which breaks adoption down specifically by farm size rather than reporting a single national average, because the gap between large and mid-size operations is the story: adoption is not uniform, and cost is the most obvious reason why.
Longer-run ERS publication data going back to 1996 shows automated guidance adoption crossing 50% of planted acreage for corn, soybeans, cotton, rice, sorghum, and winter wheat combined by 2019 — meaning the “autonomous farming” trendline predates the current wave of AI marketing by well over a decade. Autosteer is not an emerging technology on US row-crop farms; it’s a mature one that’s still working its way down from large operations to mid-size and small ones.
Small farms are the segment ERS’s headline charts don’t break out with a single comparable percentage in the same series — if you farm under roughly 600 acres and want your own bracket’s adoption rate, the ERS chart-of-note tool linked below lets you filter by farm size class directly rather than relying on a rounded citation.
Source: USDA Economic Research Service — 2023 precision technology adoption by farm size, and USDA ERS — automated guidance adoption trends, 1996–2019.
Farm Equipment Market Values: What GPS Steering Actually Costs
The number that actually matters to a buyer isn’t the multi-billion-dollar market size — it’s the installed price on a specific tractor. According to AllynNav Precision Agriculture Solutions, complete tractor GPS steering systems run $1,500 to $35,000 fully installed, depending on accuracy tier (basic WAAS-corrected assist versus RTK sub-inch guidance) and whether the tractor already has a compatible display and receiver mount. Motor-driven assisted steering systems — the kind that physically turn the wheel rather than just displaying a guidance line — run $18,000 to $35,000 installed when integrated into the tractor’s existing steering circuit.
That price spread is also why adoption skews toward large farms: the same $18,000–$35,000 motor-driven system is a much smaller share of total operating cost spread across 3,000 acres than across 300. It’s a fixed cost that only makes arithmetic sense past a certain scale, which is consistent with the ERS adoption gap between large (70%) and mid-size (52%) operations above.
Equipment prices generally have moved against buyers over the same period: NASS pricing data shows new agricultural equipment prices rose more than 20% between 2021 and 2023, a run-up documented in University of Illinois Farmdoc’s analysis of machinery cost trends. That increase applies to the base tractor or combine, not the guidance electronics specifically, but it changes the payback math below because it raises the denominator (total machine cost) even when the guidance add-on price holds steady.
Source: AllynNav Precision Agriculture Solutions — tractor GPS system pricing, and University of Illinois Farmdoc — machinery cost trends and purchase decisions.
Payback: How Long Until a Guidance System Pays for Itself
AllynNav’s operating figures put annual savings from GPS-guided equipment at roughly $15 per acre, driven by reduced overlap on passes, less operator fatigue on long shifts, and tighter input placement. At that savings rate, a $1,500 entry-level system pays back in a single season on as few as 100 acres. A $35,000 RTK motor-driven system needs roughly 2,333 acres of coverage to clear the same $15/acre savings rate in one year — which is why AllynNav’s own stated payback window is 1 to 2 years, and why that window assumes an operation large enough to put real acreage behind the investment. Run your own acreage through the calculator further down this page to see where you land.
Precision Irrigation Equipment: What’s Published, What Isn’t
Precision irrigation equipment sits inside the same broader precision-agriculture category as autosteer, but it is not broken out as its own line item in the USDA ERS adoption charts or the AllynNav pricing data cited above — both sources report on guidance and mapping technology specifically. That’s a real gap, not an oversight on our part: a distinct national adoption percentage and installed-cost range for variable-rate irrigation controllers, soil-moisture-linked scheduling systems, and drip automation hardware is not currently published in the sources checked for this article.
If you’re evaluating precision irrigation equipment for your own operation, the most direct paths to current figures are: USDA NASS’s Irrigation and Water Management Survey, conducted as part of the Census of Agriculture cycle, which reports irrigation technology adoption by state and system type; and your state’s Cooperative Extension irrigation program, which typically publishes regional cost-per-acre figures for center-pivot retrofits and drip conversions because installation costs vary sharply with well capacity, field shape, and existing infrastructure. Farmonaut’s own satellite-based soil moisture layer is built to feed exactly this kind of irrigation-scheduling decision with real-time field data rather than a fixed national average — explore it through the API for advanced agricultural insights.
The Autonomous Farm Equipment Market Number
Precedence Research sized the US autonomous farm equipment market at $25.78 billion for 2024. That’s a materially different figure from smaller global market-size estimates that circulate for “autonomous farm equipment” broadly, because scope matters enormously in this category: whether a market-sizing firm counts only fully driverless machines, or also counts every tractor sold with a factory autosteer package, changes the total by an order of magnitude. When you see a market-size figure for this space, check what the source actually defines as “autonomous” before comparing it to another source’s number — they are frequently not measuring the same thing.
Deere & Company, CNH Industrial, and Volvo Construction Equipment remain the equipment manufacturers with the deepest autosteer and autonomy integration in commercial tractors sold in the US market, bundling GPS guidance, yield mapping, and increasingly autonomous operation modes into their higher-end tractor lines rather than selling autonomy as a bolt-on retrofit exclusively.
Source: Precedence Research — US autonomous farm equipment market sizing.

Automated Farming Equipment Beyond Steering
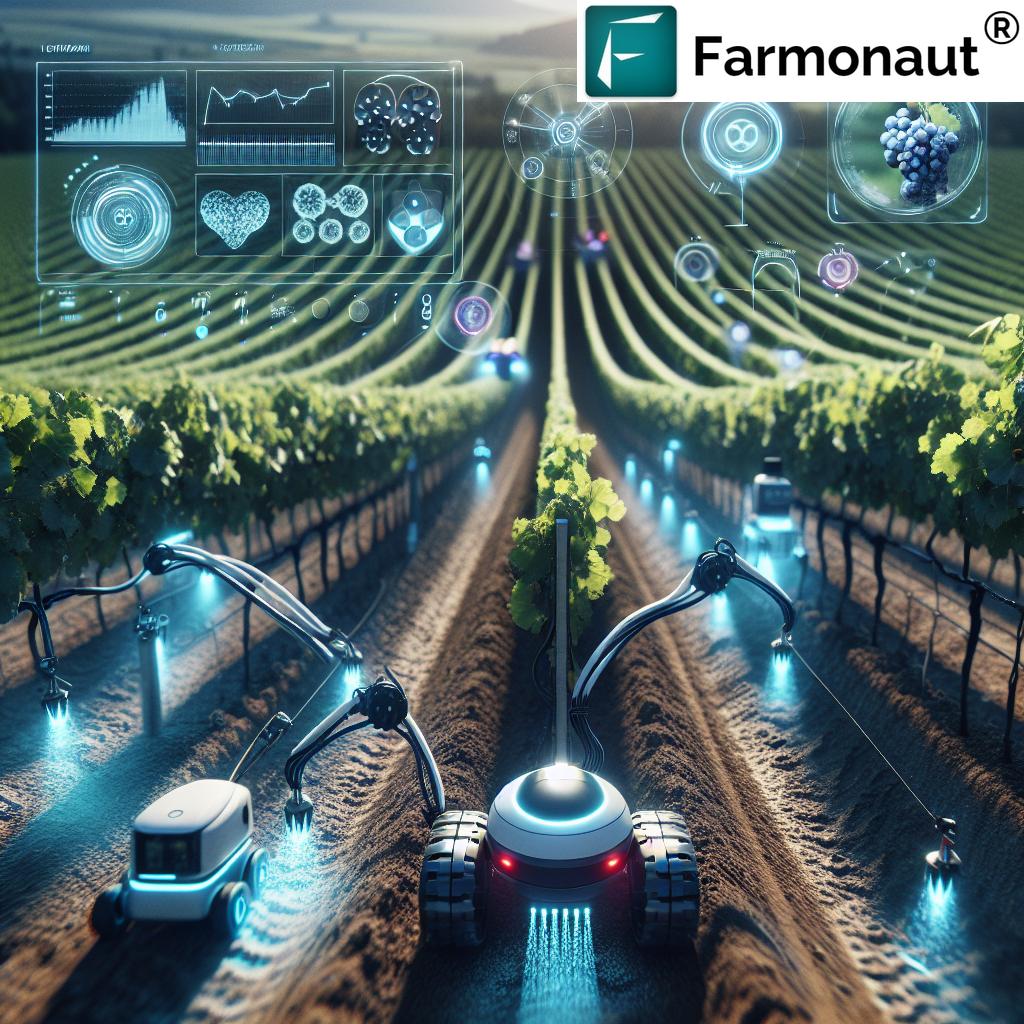
Autosteer is the adoption leader because it retrofits onto equipment farms already own. Automated farming equipment more broadly includes yield monitors and soil mapping tools (68% adoption on large-scale farms), variable-rate applicators that use that mapping data to adjust fertilizer or pesticide rates on the go, and — in vineyards and orchards especially — vision-guided pruning and spraying equipment that targets individual plants rather than treating a field uniformly.
Vineyard applications are a useful case study because the precision required is unusually high: row spacing is narrow, individual vine value is high, and the payoff from targeted spraying (reduced chemical volume, better coverage on the canopy that actually needs it) is easy to measure per acre. The same computer-vision approach used in vineyard sprayers is the technology base for row-crop applications like agricultural automation more broadly — the sensors and logic transfer even when the crop geometry doesn’t.
Precision Agriculture Equipment Technology: How the Pieces Fit
Three layers make up most precision agriculture equipment technology stacks on US farms today:
- Guidance layer: autosteer and RTK correction, priced $1,500–$35,000 installed (AllynNav)
- Sensing layer: yield monitors and soil maps, at 68% adoption on large-scale farms (USDA ERS)
- Application layer: variable-rate fertilizer, seed, and chemical controllers that consume the sensing layer’s data to adjust output row by row
Farmonaut’s satellite crop-health layer is designed to plug into the sensing layer specifically, giving farms without on-ground yield-monitoring hardware a remote-sensing alternative for the same variable-rate decisions — see how the pieces connect via the API Developer Docs.
Autonomous Tractors: Where the Market Actually Stands
“Autonomous tractor” gets used for two different products: a tractor with autosteer that still requires an operator in the seat for safety monitoring and headland turns, and a fully driverless tractor that operates a field with no cab occupant. The 70%/52% adoption figures cited above are entirely the first category — supervised autosteer. Fully unsupervised, cab-empty tractor operation is commercially available from select manufacturers but does not yet have a published US adoption percentage from ERS or NASS in the sources checked for this article; that’s a genuine gap, not a number we’re rounding down to zero.
If a specific driverless-tractor adoption rate matters for your purchasing decision, the manufacturer’s own dealer network is currently the most reliable source of unit-sales figures, since public agricultural statistics agencies have not yet built a survey category that separates “autosteer with operator” from “fully autonomous, no operator” at the national level.
This distinction is also the reason autonomous tractor case studies tend to focus on specific named deployments rather than national statistics — see the deeper technical walkthrough on autonomous farming advances for how individual manufacturer programs are structured.
Calculator: GPS Steering Payback for Your Acreage
Enter your acreage and the installed cost of the system you’re evaluating to see how many years it takes to recover, using AllynNav’s published $15/acre annual savings figure as the baseline.
Run your own numbers
Assumptions: uses AllynNav’s published $15/acre annual savings figure as the default, which the source describes as achievable with GPS-guided equipment generally rather than broken out by tractor size or crop. It does not account for financing interest, maintenance on the guidance hardware, or the 20%+ equipment price increase NASS recorded for 2021-2023, which affects base tractor cost but not the guidance system price range used here. Adjust the savings-per-acre field if your own operation’s overlap reduction or input savings differ from this baseline.
Autonomous Agriculture and the Labor Question
Every adoption figure above sits on top of a labor argument: autosteer and automated equipment reduce the operator-hours needed per acre, which matters most in regions already short on seasonal and skilled agricultural labor. That pressure is explored in more depth in the context of agricultural labor shortages, where automation is being adopted less as an efficiency upgrade and more as a continuity requirement — fields still need to get planted and harvested even when a crew can’t be fully staffed.
The flip side is training: a $35,000 RTK guidance system or a variable-rate applicator is only as good as the operator’s ability to run the software behind it. Farmer education programs, extension services, and dealer-provided training are increasingly part of the total cost of adoption even though they rarely appear as a line item in equipment pricing.
Autonomous and precision equipment also intersects with broader sustainability goals — reduced overlap and variable-rate input placement cut chemical and fuel use per acre, a theme covered in more detail in sustainable agriculture solutions and, for urban and peri-urban growing operations specifically, urban farming. The underlying hardware differs by scale, but the resource-efficiency logic — less waste per unit of output — is the same one driving adoption on 5,000-acre Midwest row-crop operations and quarter-acre urban plots alike. For farms elsewhere adapting similar guidance and mapping technology to their own regulatory and equipment-cost environment, the same precision layer discussed in eco-friendly farming methods illustrates how the sensing-and-application logic transfers across very different farm sizes.
Comparison: Adoption Rate vs. Installed Cost, by System Tier
| Technology | Adoption / Prevalence | Installed Cost Range | Source |
|---|---|---|---|
| Autosteer, large-scale farms | 70% (2023) | $1,500–$35,000 | USDA ERS / AllynNav |
| Autosteer, mid-size farms | 52% (2023) | $1,500–$35,000 | USDA ERS / AllynNav |
| Yield monitors & soil maps, large-scale farms | 68% (2023) | Varies by monitor brand; not broken out in cited sources | USDA ERS |
| Motor-driven assisted steering | Subset of autosteer figure above | $18,000–$35,000 | AllynNav |
| Automated guidance, planted acreage (6 major crops) | 50%+ by 2019 | Not applicable (multi-year trend) | USDA ERS |
This table is the structured answer to “farm equipment market values” and “precision agriculture equipment technology” in one place: what’s adopted, at what rate, and at what installed price — sourced to USDA and AllynNav rather than estimated.
How to Check These Numbers Yourself, Going Forward
Every figure in this article has a refresh path, because adoption percentages and equipment prices both move year to year:
- Adoption rates by farm size: USDA ERS’s chart-of-note series (linked above) is updated as new Agricultural Resource Management Survey (ARMS) data becomes available — check the same URL for the current release rather than assuming the 2023 figures cited here still hold.
- Equipment and machinery prices: NASS releases updated farm machinery price indices on a quarterly basis. Their Prices Paid by Farmers reports, published directly through NASS, carry the current tractor and equipment cost data rather than the 2021–2023 run-up cited in this piece.
- Market-size forecasts: Precedence Research’s page for the autonomous farm equipment market is periodically revised; check it directly for a figure newer than the $25.78 billion 2024 US estimate used here, and confirm what definition of “autonomous” the updated figure is using before comparing it to this article’s number.
- Precision irrigation equipment specifically: no distinct national adoption or cost figure was found in the sources checked for this article. The Census of Agriculture’s Irrigation and Water Management Survey and your state Extension office are the two most direct sources for that data as it becomes available.
Get Farmonaut’s satellite crop-health and soil-moisture data on the go — download the app via  or
or  , or jump straight into the browser tool with
  .
.
FAQ
Q: What percentage of US farms use autonomous or autosteer equipment?
A: Per USDA’s Economic Research Service, 70% of large-scale US crop farms and 52% of mid-size crop farms used autosteering guidance systems as of the 2023 survey round. These are supervised autosteer systems with an operator present, not cab-empty autonomous machines.
Q: How much does a GPS steering system for a tractor cost?
A: Complete systems installed run $1,500 to $35,000 depending on accuracy tier, per AllynNav Precision Agriculture Solutions. Motor-driven assisted steering specifically runs $18,000 to $35,000 installed.
Q: How long until a precision guidance system pays for itself?
A: AllynNav reports a 1 to 2 year payback period at an estimated $15/acre in annual savings, though the exact timeline depends heavily on acreage covered — use the calculator above with your own numbers.
Q: How big is the autonomous farm equipment market?
A: Precedence Research sized the US autonomous farm equipment market at $25.78 billion for 2024. Check their page directly for any updated forecast, and confirm what the figure counts as “autonomous” before comparing it to other market-size estimates.
Q: Is there separate adoption data for precision irrigation equipment?
A: Not in the USDA ERS or AllynNav sources used for this article — irrigation automation isn’t broken out from broader precision-agriculture adoption figures in those releases. The Census of Agriculture’s Irrigation and Water Management Survey is the most direct source for that specific category.
Q: How does Farmonaut fit into precision agriculture equipment?
A: Farmonaut provides satellite-based crop health and soil-moisture monitoring that feeds the same sensing layer yield monitors and soil maps serve — useful for farms without on-ground monitoring hardware, or as a second data source alongside it.

 Patrick America
 Red Dog Management
 Liquify Digital
 Ascentya
 CU Foods
 BeyondTech Global
 Rouge VC
 AgroGreen Dynamics
 AgroRisk
 Oath Inc
 Reddane Farming
 Esri North East Africa
 Cresol
 MDCV UK
 Zerella Group
 Etech Consulting Madagascar
 Vestlandsforsking
 Delicio
 WB Dev
 Sama Premium
 Prochecker
 Tres Valles
