

Agriculture Inputs Guide: Seeds, Fertilizer Costs & Sustainable Farming
Reviewed January 2026 against USDA Economic Research Service, USDA NASS, and Eurostat.
Try it: Estimated total fertilizer cost: $0 →
Agricultural inputs are the seeds, fertilizers, pesticides, water, and machinery a farm buys to produce a crop — and for corn and soybean growers in the United States, fertilizer alone is projected to cost $166 per acre and $57 per acre respectively in 2026, according to USDA Economic Research Service forecasts. Whether you farm 40 acres or 4,000, the questions are the same: what counts as an input, what does it cost right now, and which of those costs can be cut without cutting yield. This guide answers all three, using USDA, Eurostat, and market-research figures rather than generic advice.
What Are Agricultural Inputs?
Agricultural inputs fall into five categories that every farm budget tracks separately:
- Seeds and planting material — the genetic starting point for yield potential
- Fertilizers — nitrogen, phosphorus, and potassium products that replace what the crop removes from soil
- Crop protection products — herbicides, fungicides, and insecticides
- Water and irrigation infrastructure — increasingly metered and priced by volume in water-stressed regions
- Machinery, fuel, and labor — the operational inputs that turn the other four into a harvest
Fertilizer is usually the largest single line item after land and machinery. As of mid-January 2026, urea was quoted at $450 per tonne on a Gulf/NOLA spot basis, and anhydrous ammonia (NH3) was priced at $865 per tonne at an Iowa distributor point, both per USDA’s charts-of-note series. Those two prices move independently — urea tracks global gas-based nitrogen supply, while ammonia reflects North American pipeline and rail logistics — so a farm budgeting nitrogen needs to check both, not assume they move together.
Where to Check Current Input Prices
Spot prices for urea, anhydrous ammonia, and diammonium phosphate change weekly. USDA’s Quick Stats database (nass.usda.gov/Quickstats) publishes updated Gulf and regional spot prices most Fridays — that is the fastest way to get a number newer than the one printed here.
Sustainable Agriculture in the US: The Adoption Numbers
Certified organic production is the most consistently measured slice of sustainable agriculture in the United States, because USDA tracks it as a formal certification rather than a self-reported practice. As of 2021, the USDA National Agricultural Statistics Service counted 17,445 certified organic farm operations across the country, covering 3.6 million acres of certified organic cropland, per USDA ERS. That acreage is a small fraction of total US cropland, but the dollar value it generates is not: US organic food sales reached $70.1 billion in 2025 (USDA ERS), with organic fresh produce alone accounting for $21.5 billion of sales in 2021.
For comparison, the European Union reports organic adoption as a share of farmed land rather than a count of certified operations. Eurostat’s 2023 baseline puts 10.8% of EU agricultural land under organic farming — a structurally different starting point from the US, where organic remains concentrated in specific crops (produce, dairy) rather than spread across row-crop acreage generally.
Practices That Don’t Require Organic Certification
Certification is one path to sustainable production, but not the only one. Farmers pursuing lower input costs and better soil health without full certification typically combine:
- Crop rotation — breaking pest and disease cycles by alternating crop families
- Cover cropping — reducing bare-soil erosion and building organic matter between cash crops
- Integrated pest management (IPM) — scouting-driven pesticide application instead of calendar-based spraying
- Reduced or no-till planting — cutting fuel and labor costs while preserving soil structure
On the data gap: USDA maintains conservation program enrollment figures (e.g., EQIP, CSP) but does not publish a single consolidated “adoption rate” for cover crops or rotation across all US farms. If you need a number specific to your county, USDA NASS’s Census of Agriculture (conducted every five years, with the next full release following the 2027 census) is the authoritative source — check nass.usda.gov for release timing.
For farms transitioning toward lower-input systems, our guide to organic farming methods, including vertical and no-till approaches, walks through the practical first steps.
The Organic Input Market: Where It’s Growing
Biological fertilizers and biopesticides — inputs derived from microorganisms and natural compounds rather than synthesized minerals — are the fastest-growing input category by percentage, even though they remain a smaller absolute market than conventional fertilizer. Market Research Industry projects the biological fertilizer and pesticide market will grow at a 10.3% compound annual growth rate between 2026 and 2034. That growth is driven by input cost volatility (conventional nitrogen prices swinging with natural gas markets) and by buyer demand for lower-residue produce.
We cover the specific bio-input products entering the market and how they’re priced against conventional alternatives in our planting-trends breakdown of agriculture inputs and bio-inputs.
Sourcing Quality Seeds and Fertilizer: What to Verify
Regardless of market, the fundamentals of input quality control are the same three checks:
| Input | What to verify before purchase | Where to check (US) |
|---|---|---|
| Seed | Germination rate, purity percentage, variety certification tag | State seed certification agency; land-grant university extension office |
| Fertilizer | Guaranteed nutrient analysis (N-P-K) matches the label; tonnage price against current spot | USDA Quick Stats; state department of agriculture fertilizer tonnage reports |
| Crop protection products | EPA registration number is active; product is not past its labeled shelf life | EPA’s National Pesticide Information Retrieval System |
These checks take minutes and prevent the most common input losses: off-spec fertilizer blends and seed lots with germination rates below the tag’s stated percentage.
Crop and Farm Productivity Solutions: What Precision Monitoring Adds
Once inputs are purchased at a fair price and verified for quality, the next lever on productivity is how precisely they’re applied — and that’s where satellite-based monitoring changes the input-cost equation. Farmonaut’s platform uses satellite imagery to track crop health, soil moisture, and vegetation indices across a field, so fertilizer and water go where the crop data shows they’re needed rather than being applied uniformly across a field.
Explore the platform:



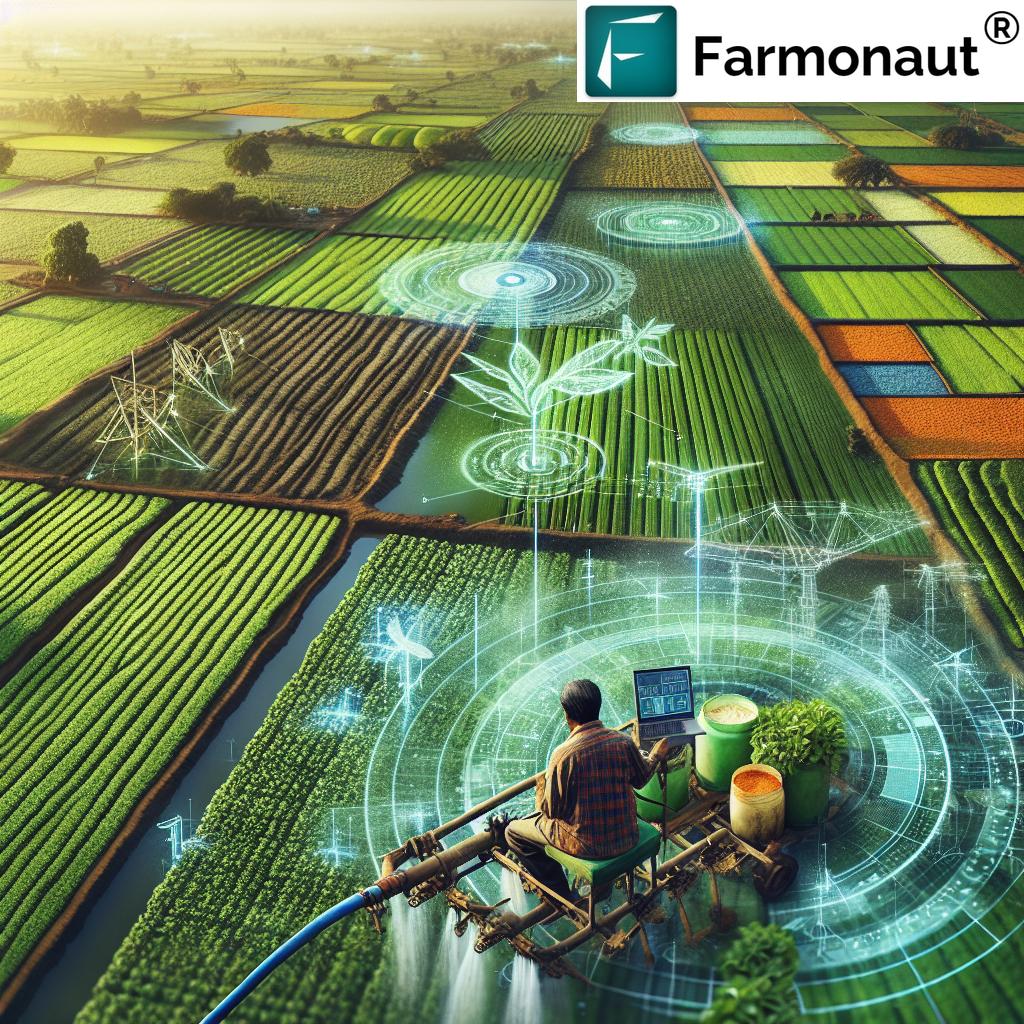
The platform combines four capabilities relevant to input management specifically:
- Satellite-based crop health monitoring, to catch stress before it’s visible on the ground
- AI-driven advisory output, translating vegetation-index data into an application recommendation
- Blockchain-based traceability, documenting which inputs were applied where and when
- Resource management tools, for tracking machinery and labor alongside the input record

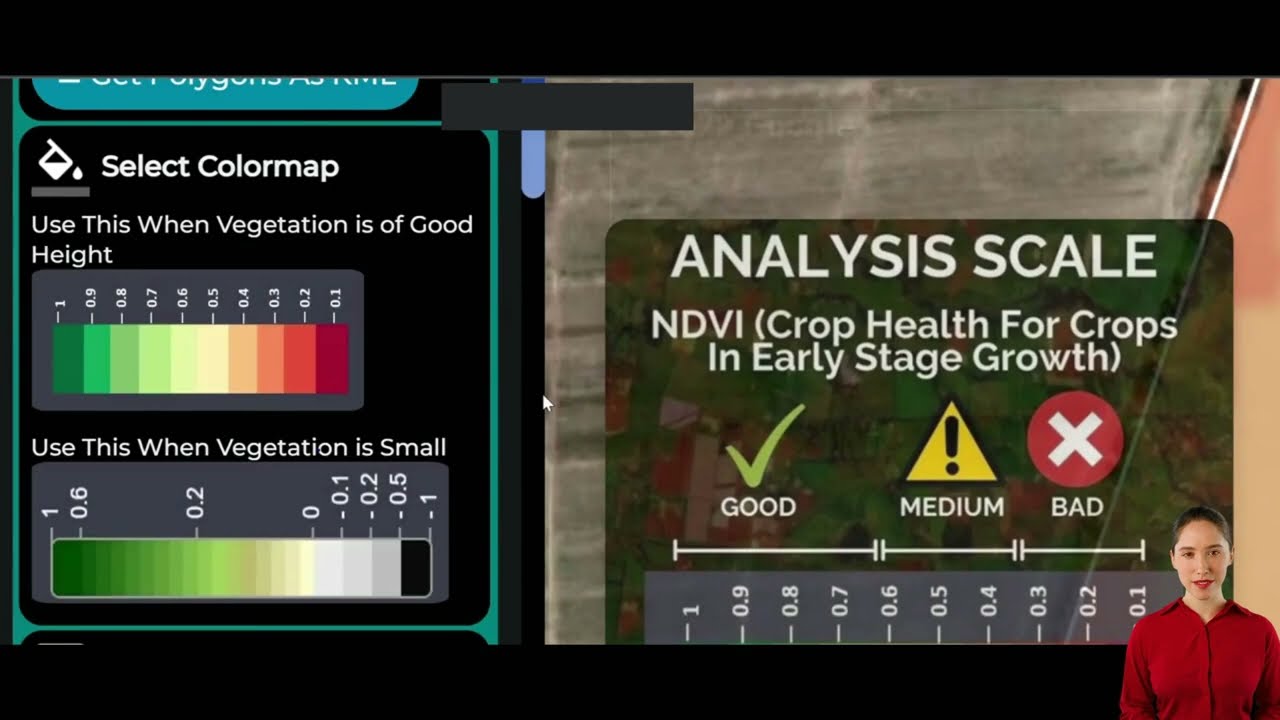
The underlying method here is durable even as the specific price numbers above age out: pull a current vegetation-index map before each fertilizer application window, compare it against the previous pass, and apply variably rather than flat-rate. That workflow doesn’t depend on this year’s urea price — it just needs current field data, which the platform refreshes on every satellite pass. For teams building their own monitoring pipeline, the underlying satellite and weather data are available directly through the Farmonaut API and documented in the API developer docs.
Irrigation as an Input: Efficiency Data
Water is priced and regulated differently across the US and EU, but the input-efficiency question is the same everywhere: how much yield per unit of water applied. Farmonaut’s soil-moisture layer, drawn from satellite passes rather than point sensors, lets a farm set irrigation schedules based on field-wide moisture data instead of a single probe reading, and flags zones running dry before visible stress appears.
Machinery and Supply Chain as Inputs
Fleet and machinery management is often left out of “input” discussions, but fuel, maintenance, and equipment depreciation compete for the same budget line as seed and fertilizer. Farmonaut’s resource management tools track machinery usage against field records, and the blockchain-based traceability layer documents the chain from input purchase to field application to harvest — useful for farms selling into markets that require input-sourcing documentation.


AI and Predictive Analytics for Input Timing
Predictive analytics applied to input timing — deciding when, not just how much, to apply nitrogen or crop protection products — is one of the more measurable returns from precision agriculture. Our deeper look at the underlying science is in how big data and biophysics are transforming crop yield optimization, which covers the biophysical models behind the yield predictions rather than just the output dashboard.
Fertilizer Cost Calculator
Use the figures above as a starting point, then swap in your own acreage and current spot price to see your total nitrogen budget.
Estimated total fertilizer cost: $0
Assumptions: based on USDA ERS 2026 forecast fertilizer costs per acre for corn and soybeans. Excludes seed, crop protection, labor, and fuel costs. The adjustment field lets you correct for your region's current spot price against the national forecast — check USDA Quick Stats for this week's number.
Input Quality Control: A Practical Checklist
This checklist doesn't expire with the price data above — it's the verification method to reuse every purchasing cycle:
- Request the guaranteed analysis tag on every seed and fertilizer lot before payment, not after delivery
- Cross-check the fertilizer's nutrient percentage against the invoiced tonnage price using USDA Quick Stats as the market baseline
- Confirm crop protection products carry an active EPA registration number
- Log input applications against field-level satellite or scouting data, so a yield shortfall can be traced to an input problem rather than guessed at
- Revisit organic or biological-input alternatives annually — a market growing at a 10.3% CAGR (2026–2034, per Market Research Industry) changes pricing and product availability faster than conventional input categories
FAQ
Q: What are agricultural inputs?
A: Seeds, fertilizers, crop protection products (herbicides, fungicides, insecticides), irrigation water, and machinery/fuel — the purchased resources a farm converts into a harvest.
Q: How much does fertilizer cost per acre in the US?
A: USDA ERS forecasts $166 per acre for corn and $57 per acre for soybeans in 2026. Spot prices behind those forecasts were $450/tonne for urea (Gulf/NOLA) and $865/tonne for anhydrous ammonia (Iowa) as of mid-January 2026 — check USDA Quick Stats for the current week's price.
Q: How much organic farmland is there in the US versus the EU?
A: The US had 3.6 million certified organic acres across 17,445 operations in 2021 (USDA NASS/ERS). The EU reported 10.8% of its agricultural land under organic farming in 2023 (Eurostat) — a share-of-land metric rather than a raw acreage count, so the two aren't directly comparable.
Q: How does Farmonaut help manage agricultural inputs?
A: Through satellite-based crop health and soil moisture monitoring, AI-driven advisory recommendations, blockchain traceability for input records, and machinery/resource management tools — available via web, Android, and iOS.
Q: Is the organic input market growing?
A: Biological fertilizers and biopesticides are projected to grow at a 10.3% compound annual growth rate from 2026 to 2034, per Market Research Industry — faster than conventional fertilizer, though still a smaller absolute market.
For API access to the satellite and weather data referenced throughout this guide:
Discussion
Questions, corrections or field experience? Share them below. First-time comments are reviewed before they appear, and your email is never published.
No comments yet. Be the first to add a question or your experience.

 Insignito
 Croptimum
 Dalmia Bharat Sugar
 DnCubed
 Pistachio ST
 Field Capacity
 Indosistim Teknologi
 Liquify Digital
 CU Foods
 BeyondTech Global
 Rouge VC
 AgroGreen Dynamics
 AgroRisk
 Oath Inc
 Reddane Farming
 Esri North East Africa
 Cresol
 MDCV UK
 Etech Consulting Madagascar

 Licence holder · Niger · Gold










