

Farmland Fund Returns: The Real Numbers, and How to Check Them Yourself
Reviewed August 2026 against USDA Economic Research Service land-value data, the NCREIF Farmland Index and fund managers’ own disclosures.
A farmland fund is a pooled vehicle that owns agricultural land and earns money two ways: rent from the farmers who work it, and change in the value of the land itself. Over calendar 2025 the NCREIF Farmland Index — the benchmark for institutionally owned U.S. farmland — returned 0.20% total, made up of a 3.05% income return and a −2.80% capital return, according to the Q4 2025 index release summarised by AgIS Capital. That headline hides the only number that matters when you pick a fund: annual cropland returned +3.52% while permanent cropland (almonds, pistachios, wine grapes) returned −5.43%. Choosing between those two crop types mattered nine percentage points more than choosing between managers.
Four Ways to Buy a Farmland Fund
“Farmland fund” covers four legally distinct structures with very different minimums, liquidity and fee drag. Confusing them is the most common reason retail investors end up disappointed: the returns quoted in institutional research come from the first category, which most individuals cannot access.
| Structure | Who can buy | Liquidity | Named examples | Where returns are published |
|---|---|---|---|---|
| Open-end institutional fund | Pensions, endowments, insurers | Quarterly queue, often years | Nuveen Global Farmland; ASR Dutch Farmland Fund | Manager factsheets; NCREIF for peers |
| Non-traded / private REIT | Accredited & institutional | Periodic repurchase, capped | Nuveen’s U.S. farmland REIT (launched Sept 2025) | SEC filings, sponsor NAV notices |
| Listed farmland REIT | Anyone with a brokerage account | Daily, at market price | Gladstone Land (NASDAQ: LAND) | Quarterly 10-Q / annual 10-K on EDGAR |
| Crowdfunded parcel offerings | Accredited, per-deal | None until sale | Reg D platform syndications | Form D and platform disclosures only |
The practical consequence: a listed REIT gives you a real, marked-to-market price every day and audited filings, but its share price moves with interest rates as much as with soil. An open-end institutional fund gives you appraisal-based values that look smooth — because they are appraised, not traded — which flatters volatility statistics.

What Farmland Funds Actually Returned
The NCREIF Farmland Property Index is the reference series. It began in Q4 1990 at a base of 100, tracks unleveraged, wholly or jointly owned income-producing farmland held by tax-exempt institutions, and is republished every quarter as members submit fresh valuations. If a fund quotes a benchmark, this is almost certainly it.
For calendar 2025 the sub-indices diverged sharply. Annual cropland — row crops re-planted each season — beat permanent cropland for the sixth consecutive year. Within permanent crops the split was equally wide: the Pistachio Index returned 3.55% after three negative years, while the Almond Index returned −4.43%, its sixth consecutive negative year.
Why permanent cropland went backwards
Income held up; valuations did not. The Permanent Cropland Index earned a 3.24% income return in 2025 but took a −8.48% capital write-down. The directly operated permanent cropland sub-index — orchards run by the owner rather than leased out, so the owner absorbs the farming margin — did worse still at −7.01% total, with a −9.55% capital return and 2.70% income. This is the single clearest argument for reading a fund’s crop mix before its performance chart.
The Land Underneath: USDA Values and Rents
Every farmland fund’s capital return ultimately tracks the land market that USDA’s Economic Research Service measures. For 2025 the U.S. average farm real estate value was $4,350 per acre, cropland $5,830 per acre and pastureland $1,920 per acre. Adjusted for inflation, farmland rose 1.9%, cropland 2.2% and pastureland 2.4% against 2024 — and over 2019–2024 the real compound annual growth rate was 2.0% for farmland overall and 2.5% for cropland. That page was last updated 22 May 2026; NASS publishes the underlying survey each August.
Regional dispersion dwarfs the national average. The Corn Belt averaged $8,250 per acre against $1,660 per acre in the Mountain region — a five-fold gap that explains why two funds with identical strategies can post completely different capital returns.
Rent is the part that pays you — and it is falling in the Corn Belt
Income return is rent, and rent follows farm profitability with a lag. USDA reported Illinois average cash rent falling from $269 per acre in 2024 to $264 per acre in 2025 — the first year-on-year decline since 2020, when it dropped to $222. Analysis published by University of Illinois farmdoc daily in September 2025 reported an ISPFMRA mid-year survey expecting further cuts for the 2026 crop year: −$17 per acre on excellent land (−4.3%), −$21 on good land (−6.2%), −$17 on average land (−6.2%) and −$16 on fair land (−7.1%). The same analysis noted crop budgets projecting negative operator returns into 2026, with break-even needing rent cuts of more than $30 per acre.
County-level rents come from the NASS Cash Rents survey, which contacts about 280,000 farms and ranches in every state except Alaska. U.S. and state estimates land in Quick Stats in the first week of August; county estimates follow in late August. Land-value charts by state and year are posted at NASS Charts and Maps. Those two release windows are your refresh path for every rent and value figure on this page.

Global Farmland Funds and Nuveen Global Farmland
A global farmland fund holds land across hemispheres so that a drought in one growing season is offset by a harvest somewhere else. The largest manager in the category is Nuveen Natural Capital. Its announcement with iCapital, dated 25 July 2023, described the Nuveen Global Farmland strategy and put the platform at $12.4 billion in assets under management. The stated asset mix: wine grapes in Napa, Monterey, Sonoma and Madera counties in California; U.S. row crops including corn, soybeans, rice and cotton; and horticulture including almonds, raisin grapes and pistachios.
By September 2025, reporting on Nuveen’s REIT filing put Nuveen Natural Capital at $13.1 billion across roughly 3 million acres, alongside the launch of a non-traded U.S. farmland REIT targeting $3 billion, weighted toward California’s Central Valley plus the Corn Belt, Southeast, Delta, Mountain West and Pacific Northwest.
Note what those figures do and do not tell you. AUM and acreage are scale, not performance. Nuveen does not publish a public unit price for the Global Farmland strategy, so for prospective investors the honest position is this: the fund’s own net return series is available only in the manager’s factsheet and offering documents, supplied under NDA to qualified investors. If you cannot obtain that document, you cannot evaluate the fund — and you should treat the NCREIF sub-index matching its crop mix as the closest public proxy. Ask for AUM as of a stated quarter-end, because these numbers move.
What share of NAV sits in permanent crops, and in which counties? Given the 2025 spread between annual cropland (+3.52%) and permanent cropland (−5.43%), that single answer explains most of the return you are being sold.

ASR Dutch Farmland Fund: The European Model
Europe’s largest private farmland vehicle works differently. The ASR Dutch Farmland Fund holds about 39,000 hectares of Dutch agricultural land with a fund size of roughly €2.4 billion, spread over 2,700 lease contracts whose average duration exceeds 20 years (manager figures referencing the Q1 2026 factsheet). The portfolio traces back to land purchases beginning in 1892 and was opened to external institutional investors from 1 October 2020.
The structural point for a U.S. or U.K. reader: the Dutch model separates land ownership from farming entirely. The fund is a landlord under long Dutch lease law, so income is contractual and durable, while capital return depends on a land market shaped by nitrogen regulation and spatial planning rather than by commodity prices. That is genuine diversification against a Corn Belt portfolio — and it also means the fund reports in euros, so a dollar-based investor carries unhedged FX unless the share class says otherwise.
Named Vehicles Compared
| Vehicle | Size (as reported) | Land base | Geography | As-of date |
|---|---|---|---|---|
| Nuveen Natural Capital (Global Farmland platform) | $13.1bn AUM | ~3,000,000 acres | U.S. plus international | Sept 2025 reporting |
| ASR Dutch Farmland Fund | €2.4bn fund size | ~39,000 hectares (~96,000 acres) | Netherlands only | Q1 2026 factsheet |
| Gladstone Land (NASDAQ: LAND) | $0.0467/share monthly distribution | 100,323 acres, 148 farms, 95.7% occupied | 15 U.S. states | 30 Sept 2025 (Q3 results) |
| NCREIF Farmland Index (benchmark, not investable) | 0.20% total return | Institutional, unleveraged | United States | Calendar 2025 |
Gladstone Land is the one line you can verify without a manager’s permission. Its Q3 2025 results, released 5 November 2025, disclosed 148 farms across 100,323 acres in 15 states at 95.7% occupancy, a monthly distribution of $0.0467 per share ($0.5604 annualised), and — importantly — a $5.4 million reduction in fixed base cash rents from lease modifications and vacancy. That is what farmland income stress looks like when a company has to report it.
Blended-Return Calculator
Set your own crop mix and fee load against the two 2025 sub-index returns to see what the blend actually produces.
Run your own numbers
Assumes the entered rates repeat every year and are unleveraged and pre-tax. Excludes acquisition and disposal costs, performance fees or carried interest, currency movement, subscription queues and redemption gates. Defaults are the NCREIF calendar-2025 sub-index total returns, which were a single year, not a long-run expectation — replace them with your own assumption.
"Farmland Fund With the Best Returns": A Checklist That Does Not Expire
No fund holds the top spot for long, so the useful question is not which fund won but which questions separate a real return from a marketed one. Work through these seven in order; they survive every change in the numbers above.
- Is the return appraisal-based or transaction-based? Open-end funds mark to appraisal, which suppresses reported volatility. Compare like with like, or compare both to NCREIF.
- Net or gross of fees? Institutional farmland fees commonly sit in the 0.75%–1.25% of NAV range plus performance participation. On a 3% income return, one point of fee removes a third of your cash yield.
- What is the income/capital split? Income is contractual; capital is an opinion until the land sells. A fund whose track record is mostly capital appreciation is telling you about the land market, not its own skill.
- What is the crop mix by NAV? Annual versus permanent explained a 9-point gap in 2025 and annual cropland has outperformed for six consecutive years.
- Is there leverage, and at what rate and maturity? NCREIF is unleveraged. Any fund beating it materially is usually borrowing, which is not skill.
- What are the water rights? In the U.S. West, water is a separate, priced asset — Gladstone Land reports acre-feet of water holdings alongside acreage for exactly this reason.
- How do you get out? Redemption queues, gates and lock-ups decide your realised return more often than crop yield does.
How to refresh every number on this page yourself
- Land values and rents: NASS Quick Stats, first week of August for U.S. and state estimates; late August for county cash rents.
- Benchmark returns: the NCREIF Farmland Property Index, republished quarterly after member valuations close.
- Farm income context: the ERS Farm Income and Wealth Statistics product, forecast in early February and revised in late August/early September and again in late November — the next release listed on that page was 3 September 2026.
- Listed vehicles: 10-K and 10-Q filings on SEC EDGAR, plus the sponsor's investor-relations page.
- Jump to the calculator

Verifying Land Performance From Orbit
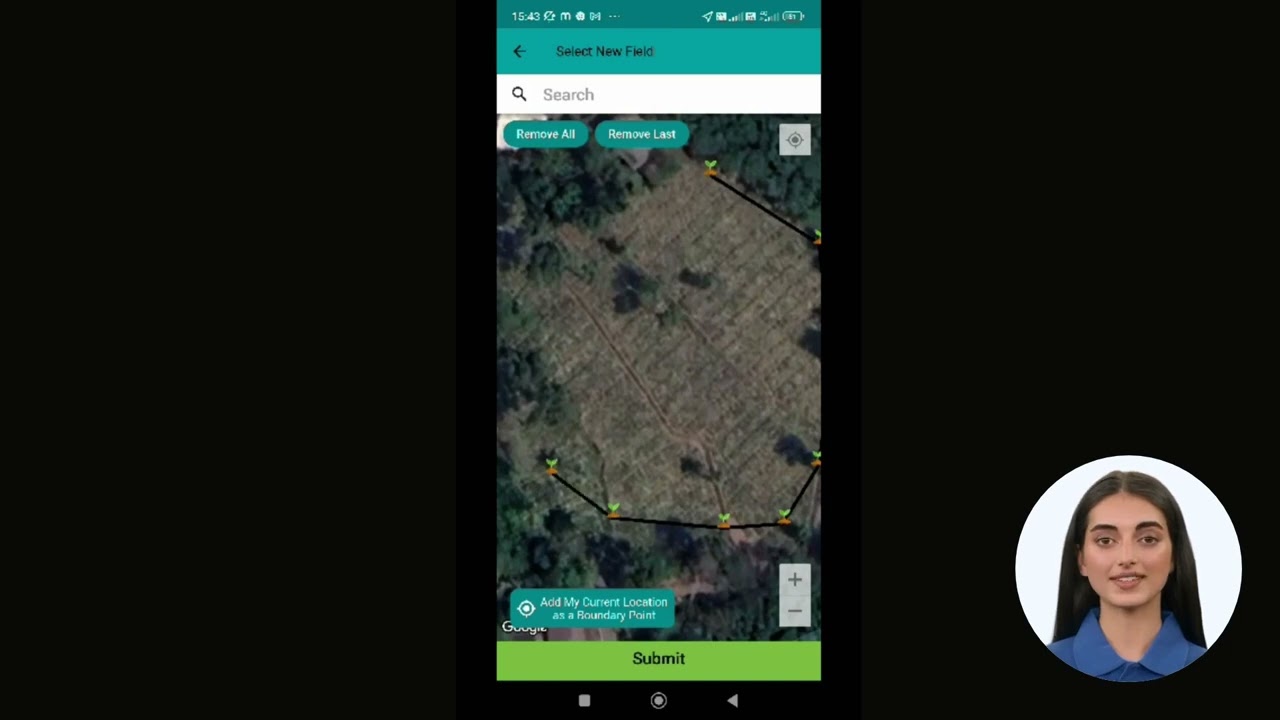
Appraisals arrive annually; satellites pass every few days. Between valuation dates, the only independent read on whether a fund's acres are actually being farmed well comes from remote sensing. We at Farmonaut build that layer for asset managers and their tenants.
- Vegetation and soil-moisture monitoring across every parcel in a portfolio, so a fallow or failing field shows up before the tenant's year-end accounts do.
- Water stewardship reporting — the same discipline set out in our guide to sustainable agriculture water management, which matters most in the irrigated Western acreage that dominates permanent-crop portfolios.
- Emissions and resource accounting through carbon footprinting, for funds reporting under investor sustainability mandates.
- Portfolio-wide field administration via our large-scale farm management platform, covering thousands of parcels under one login.
- Supply-chain provenance with blockchain traceability tools, and machinery oversight through fleet management.
- Lending and cover verification using satellite-based loan and insurance checks for tenant creditworthiness.
Fund analysts who want the raw signal rather than a dashboard can pull it directly through our satellite API and the accompanying developer documentation, feeding parcel-level indices straight into an existing valuation model.




Subscription options
Monitoring plans scale from a single farm to institutional portfolios.


Frequently Asked Questions
Which farmland fund has the best returns?
No fund holds that title durably, and any page claiming one is quoting a single window. For calendar 2025 the honest benchmark answer is that annual-cropland strategies (+3.52% on the NCREIF sub-index) beat permanent-crop strategies (−5.43%), and that the all-farmland benchmark returned 0.20% against −1.03% the prior year. Compare any candidate fund to the sub-index matching its crop mix, net of fees, over at least a full ten-year cycle.
Can a retail investor access the Nuveen Global Farmland fund?
Not directly. The strategy was made available to wealth advisers through the iCapital feeder platform in the July 2023 announcement, which routes qualified-purchaser and accredited-investor capital rather than ordinary brokerage accounts. Nuveen's non-traded U.S. farmland REIT, launched in September 2025 with a $3 billion target, is likewise aimed at institutional capital. A listed REIT such as Gladstone Land remains the only farmland vehicle a U.S. retail investor can buy on an exchange.
Is farmland actually an inflation hedge?
Over long periods the land component has grown ahead of inflation: USDA ERS records a 2.0% real compound annual growth rate for farmland and 2.5% for cropland over 2019–2024. Over single years it can fail — the index posted −1.03% in 2024 and 0.20% in 2025. Treat farmland as a long-horizon real asset, not a year-to-year inflation trade.
Why is a global farmland fund riskier than it looks?
Geographic diversification does not diversify away crop-type risk. A fund holding Californian almonds and Dutch arable land is exposed to one water market and one nitrogen-regulation regime; both can move against it while the weather cooperates everywhere. Ask for the NAV split by country and by crop, not just by continent, and check the currency of the share class you are buying.
What minimum acreage makes direct ownership sensible instead?
There is no published threshold, and the answer depends on your own numbers rather than an industry rule. Work it out from the USDA figures: at the 2025 national cropland average of $5,830 per acre, a single quarter-section of 160 acres costs about $933,000 before improvements — comparable to an institutional fund minimum, but with none of the diversification and all of the management burden. Run your target county's value and rent from Quick Stats before deciding.
The Bottom Line
Farmland is a slow, income-led asset that spent 2025 earning rent while giving back value: 3.05% income against a −2.80% capital return on the benchmark. Scale — Nuveen's $13.1 billion and 3 million acres, ASR's €2.4 billion and 39,000 hectares — tells you who the serious managers are, but it does not tell you what you will earn. Crop mix, fee load, leverage, water rights and exit terms do. Take the seven questions above to any fund, refresh the USDA and NCREIF figures on their published release dates, and you will be judging farmland funds on the same evidence the institutions use.
Explore our full range of satellite tools for land and portfolio oversight here.

 Yaduka Agrotech
 Kalustyan
 Tucor
Tucor Geno
Geno Hayleys Agriculture
 Linx Agritech
 Adinet
 Save Your Soils
 Grandstream Algérie
 XOS Realty
 Geospatial Lab Africa
 Agro La Gándara
 HIPSAC
 ZOL Zimbabwe
 Juligerm
 MISE Maroc
