

Reviewed August 2026 against Hawaii Department of Agriculture crop statistics, the Association of Equipment Manufacturers’ precision-agriculture benefits report, and IndexBox US trade data.
Try it: Precision-Ag Input Savings Calculator →
Agriculture Monitoring: Wireless IoT Sensors vs Satellites
Agriculture monitoring means tracking soil, crop, and weather conditions with satellite imagery, wireless ground sensors, or drones instead of a manual field walk, then feeding that data into software that recommends what to do next. The IoT layer of this market alone was estimated at $32.08 billion in 2026, growing at an 8.7% compound annual rate through 2033, according to Coherent Market Insights. Below is a breakdown of what satellites, wireless IoT sensors, and drones each measure, what US farms have gained from adopting them, and where Farmonaut’s own platform — including a field-tested banana and citrus deployment in the Philippines — fits into that picture.
What Agriculture Monitoring Actually Covers
“Agriculture monitoring” is an umbrella term for three distinct hardware approaches, and mixing them up is the main reason buyers overpay or under-deploy:
| Method | What It Measures | Hardware Needed | Typical Refresh |
|---|---|---|---|
| Satellite (Farmonaut) | Crop vigor (NDVI), soil-moisture proxy, field boundaries | None — browser or app only | Every 1-5 days, cloud-dependent |
| Wireless IoT ground sensors | Soil moisture, soil temperature, EC/salinity, sometimes N-P-K | In-field probes plus a LoRaWAN or cellular gateway | Continuous, often hourly |
| Drones | High-resolution canopy imagery; some models apply inputs | Aircraft plus an FAA Part 107 or Part 137 pilot | On-demand flights |
Wireless Agriculture Monitoring: Ground Sensors vs Satellite Coverage
Wireless agriculture monitoring specifically refers to the ground-sensor branch of the table above: battery-powered probes buried or mounted in a field that transmit readings over LoRaWAN, NB-IoT, or cellular networks to a dashboard. The trade-off against satellite coverage is straightforward. A wireless sensor network gives you continuous, point-in-place data — often hourly — but you have to buy, install, and maintain the hardware, and each probe only speaks for the few square meters around it. Satellite monitoring like Farmonaut’s covers an entire field boundary the moment you draw it on a map, with no hardware to install, but its refresh rate is capped at roughly one to five days by satellite revisit schedules and cloud cover.
IoT-Based Smart Soil Monitoring for Agricultural Production
The soil-sensor segment of this market — moisture probes, temperature probes, and electrical-conductivity sensors that feed irrigation and fertility decisions — was sized at $8.14 billion for 2026 by Research and Markets‘ IoT-in-precision-agriculture report. The payoff shows up in input use: US farms that adopted precision-agriculture technology cut fertilizer application by 8% and herbicide application by 9%, per the Association of Equipment Manufacturers’ 2025 benefits report. On irrigation specifically, a 2024 peer-reviewed review in the journal Agriculture found sensor-based scheduling cut water use 20% to 60% against conventional, calendar-based scheduling.
Banana Field Monitoring: Hawaii Acreage, US Imports, and the Philippines Pilot
Bananas are one of the clearest test cases for monitoring technology because the crop is disease-prone and irrigation-sensitive, and because most of what US buyers eat is imported, which makes production data doubly relevant to anyone sourcing, consulting on, or investing in the category.
Domestically, Hawaii is the US state that tracks and publishes banana statistics annually. For the 2024 crop year:
| Metric | 2024 Value | Y/Y Change |
|---|---|---|
| Acreage planted | 339 acres | +7% |
| Yield per acre | 13,900 lb/acre | -7% (Banana Bunchy Top Virus) |
| Average price received | $1.42/lb | +$0.09/lb |
| Total crop value | $6.7 million | Record high |
Source: Hawaii Department of Agriculture, Statistics of Hawaii Agriculture, published October 2025 for the 2024 crop year; the department releases this report each fall, so check that link directly for the 2025 crop-year figures once they post.
That yield decline against a virus outbreak is exactly the scenario where crop-health monitoring earns its keep — multispectral imagery flags stress before it is visible to a walking scout, which is the case Farmonaut makes for satellite monitoring generally.
Nationally, most bananas eaten in the US are imported. IndexBox put total 2024 US banana import value at $3.23 billion (up 3% year over year) on a volume of 5.24 million metric tons, at an average price of $518 per ton.
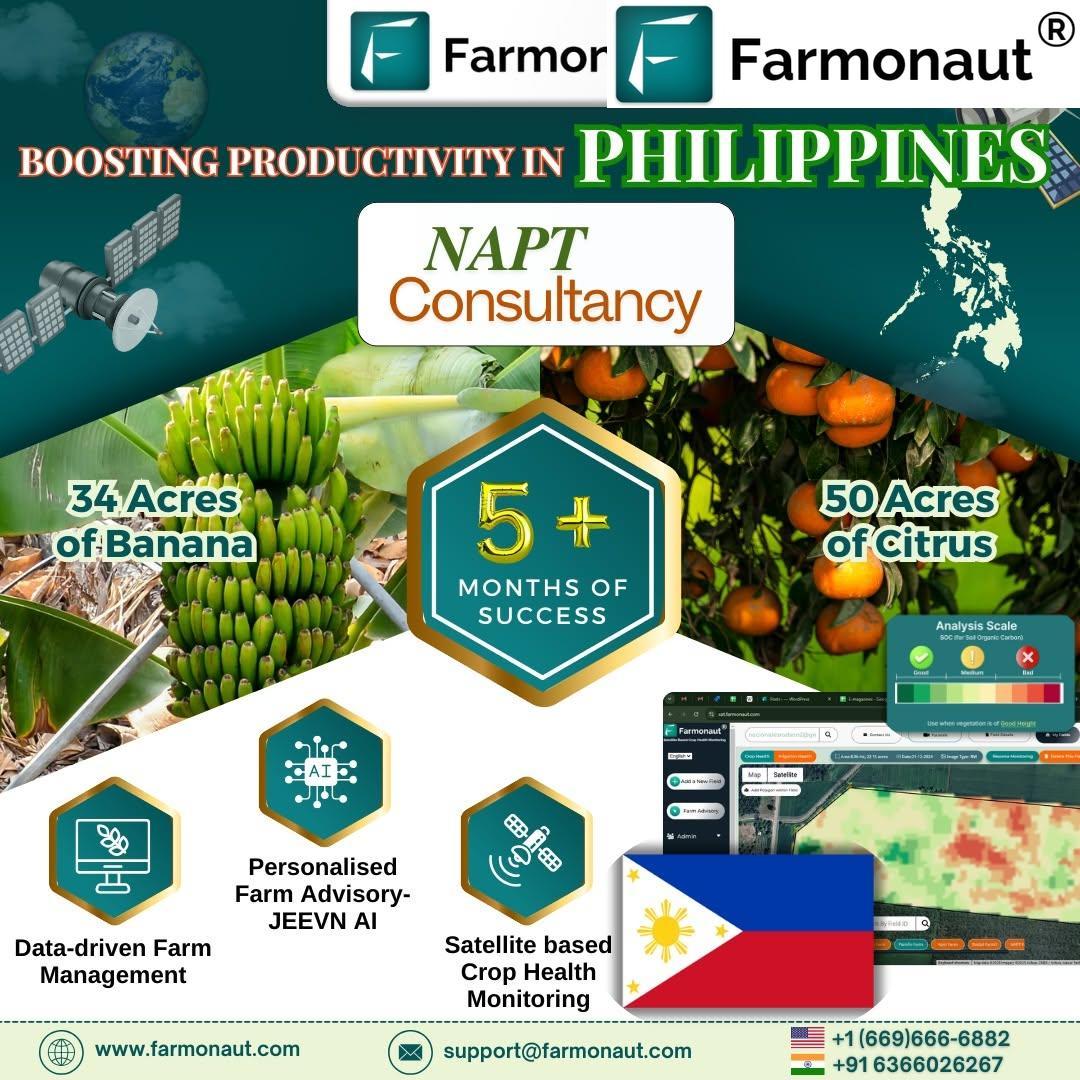
Farmonaut’s own field record with this crop comes from a precision-farming deployment covering 84 acres of banana and citrus cultivation, monitored with the same satellite crop-health and yield-prediction tools described above. For the structural issues shaping that growing region — labor, logistics, and market access — see our separate analysis of the Philippines’ top agriculture challenges and solutions.
If you are researching production statistics for a banana-growing region outside the US, this article’s tables are scoped to Hawaii and the US import market, which is what US buyers and consultants actually need. For any other region or country, the right first stop is that country’s national agriculture ministry or statistical office, cross-checked against the FAO’s production and trade databases for a comparable methodology — do not rely on a single third-party blog figure for a region-specific number.
Drone Spraying and Agricultural Robotics in Banana Production
Drones are the fastest-growing category of agricultural robotics in the US. In the 2025 season, US farmland treated by agricultural spray drones reached 16.4 million acres, up 58.7% year over year, while the number of FAA Part 137-certificated drone application operators reached 1,710, up 58.3% year over year — both figures from the American Spray Drone Coalition’s industry survey, reported by Farm Progress.
That survey does not break out acreage by crop, and Hawaii’s 339 banana acres are too small a share of US farmland to appear as a separate line item in it — so a banana-specific drone-spray figure for any country, including the Philippines, is not published in this dataset. The reliable method for a grower or consultant to get a real number for their own operation or region: check your national aviation regulator’s certificated-operator registry (in the US, the FAA’s Part 137 list) and your national agriculture department’s mechanization or extension office for the current season’s adoption survey, then apply the same three data points used above — treated acreage, certificated operator count, and year-over-year growth — as your comparison framework.
AI-Driven Recommendations: Jeevn AI Advisory
Monitoring data is only useful if it changes a decision. Farmonaut’s Jeevn AI advisory layer turns satellite and field data into agronomic recommendations — irrigation timing, fertilizer timing, and pest-risk alerts — rather than leaving a grower to interpret a raw imagery layer. For a step-by-step look at where AI fits into a farm’s existing workflow, see how to integrate AI into your farm management.
Precision Monitoring’s Measurable Payoff
The most defensible numbers on precision-agriculture’s payoff come from the equipment industry’s own adoption survey and one peer-reviewed water-use review — not from marketing case studies:
| Input | Reported Change | Source |
|---|---|---|
| Fertilizer use | -8% | AEM, 2025 report |
| Herbicide use | -9% | AEM, 2025 report |
| Fuel consumption | -147 million gallons (fleet-wide, US) | AEM, 2025 report |
| Irrigation water use | -20% to -60% vs. conventional scheduling | MDPI, journal Agriculture, 2024 |
Run your own acreage and cost figures through these rates below rather than taking a generic dollar figure on faith.
Precision-Ag Input Savings Calculator
Sustainable Agriculture Practices
The input reductions above are also environmental outcomes: less fertilizer and herbicide applied per acre means less runoff risk, and 147 million gallons of fuel saved fleet-wide means a direct emissions cut. Farmonaut’s monitoring approach follows the same logic in the field — targeted nutrient and pest interventions instead of blanket treatment. For the broader picture of how farming practices affect ecosystems, see how agriculture affects the environment.
Get Started with Farmonaut
- For growers and consultants: Explore the web platform.

- For developers: Integrate satellite and weather data directly. Explore our API and the API developer docs.
- For mobile users:


Earn With Farmonaut: Join our Affiliate Program
Farmonaut’s affiliate program pays a 20% recurring commission when you share a promo code that gives farmers a 10% discount.
FAQs
- Q: Is farmonaut.com Farmonaut’s official website?
A: Yes. farmonaut.com is the official web platform of Farmonaut Technologies, offering satellite crop monitoring, the Jeevn AI advisory system, and the developer API referenced above. - Q: What’s the difference between wireless IoT soil monitoring and satellite agriculture monitoring?
A: Wireless IoT sensors are physical probes in the ground that report continuous, point-level soil data (often hourly); satellite monitoring covers an entire field boundary with no hardware, refreshed every 1-5 days depending on cloud cover and satellite revisit. Many operations use both — sensors for irrigation timing, satellite for whole-field scouting. - Q: Does drone-spray data break out figures for a specific crop, like bananas, or a specific country?
A: Not in the American Spray Drone Coalition’s 2025 survey — it reports 16.4 million total US acres treated and 1,710 certificated Part 137 operators, without a crop-level or country-level breakdown. For a number specific to your crop or region, check your own national aviation regulator’s certificated-operator registry. - Q: Where can I find banana production statistics for a growing region outside the US?
A: Start with that country’s national agriculture ministry or statistics office, and cross-check against the FAO’s production and trade database for a consistent methodology. This article’s figures are scoped to Hawaii’s published crop statistics and US import data, which is what a US-based reader can act on directly. - Q: Is Farmonaut’s technology limited to banana and citrus farming?
A: No. The 84-acre Philippines deployment covers banana and citrus specifically, but the underlying satellite monitoring, Jeevn AI advisory, and API are crop-agnostic and used across other row and orchard crops.

 Clubhouse OS
 John Deere
 Progenseed
 SkyHarvest
 Polaris Digitech
 Teledarbas
 Wild Oak Farm
 SFX
SFX BACF Africa
 Doodlakine
 Exurbia Geospatial
 FieldZero
 Indico Company
 Kubota
