

Reviewed August 2026 against the USDA Economic Research Service’s Agricultural Resource Management Survey, the U.S. Government Accountability Office’s report on precision agriculture (GAO-24-105962), and the UK Health and Safety Executive’s aerial-spraying guidance.
Try it: Run your own numbers →
Crop Monitoring Technology: What Drones Actually Deliver
Crop monitoring technology means three things working together: a sensor — drone or satellite — that captures field imagery, software that turns that imagery into maps of stress, moisture, or yield, and a way to act on it, whether that’s a spray pass, an irrigation change, or a scouting trip. Drones do one part of that chain very well: close-range, on-demand imagery at plant-level detail. They are not, on the USDA’s own figures, the majority tool U.S. farmers use for crop monitoring, and knowing where they fit next to satellites, ground sensors, and GPS-guided machinery is the difference between a drone that earns its cost and one that sits in a shed.
This article works through the actual USDA adoption numbers for aerial imagery, the US and UK rules for flying a drone over a working field, a coverage calculator you can run with your own acreage, and a comparison of where drones, satellites, IoT sensors, and GPS machinery each earn their place. It also covers smart farming techniques beyond drones and how remote sensing ties the pieces together.

How Much of U.S. Agriculture Actually Uses Crop Monitoring Technology
Precision agriculture as a whole category — not drones specifically — reached 27% of U.S. farms and ranches in 2023, according to USDA data cited in the Government Accountability Office’s January 2024 report on precision agriculture (GAO-24-105962). That 27% covers every technique the survey tracks — GPS guidance, yield mapping, soil mapping, variable-rate application, and aerial imagery among them — so smart crop monitoring, the narrower thing most people picture, is a subset of that number, not the whole of it.
Adoption Climbs Sharply With Farm Size
USDA’s Economic Research Service reports, in America’s Farms and Ranches at a Glance (December 2024, using 2023 ARMS data), that guidance autosteering systems were in use on 70% of large-scale crop farms and 52% of midsize farms, with yield monitors, yield maps, and soil maps combined reaching 68% of large-scale farms. Small family farms post the lowest adoption in every category the survey tracks; ERS does not publish an exact figure for that tier, so if you farm at that scale, the ERS chart of note on farm-size adoption is the place to check your segment directly as USDA refreshes it with each ARMS cycle.
Drone Crop Monitoring vs. Satellite Remote Sensing: What Each One Sees
A drone-assisted crop monitoring flight resolves individual plants and canopy gaps because the sensor sits tens of meters above the crop rather than hundreds of kilometers up — that’s the honest case for crop monitoring drones over satellite tiles. The trade-off is coverage: one operator can only fly and process so many acres in a day, which is why most operational setups, including Farmonaut’s, pair drone-level detail with satellite revisit data rather than leaning on either sensor alone. For the band-by-band technical comparison of what each sensor can and cannot detect, see our piece on agricultural remote sensing.
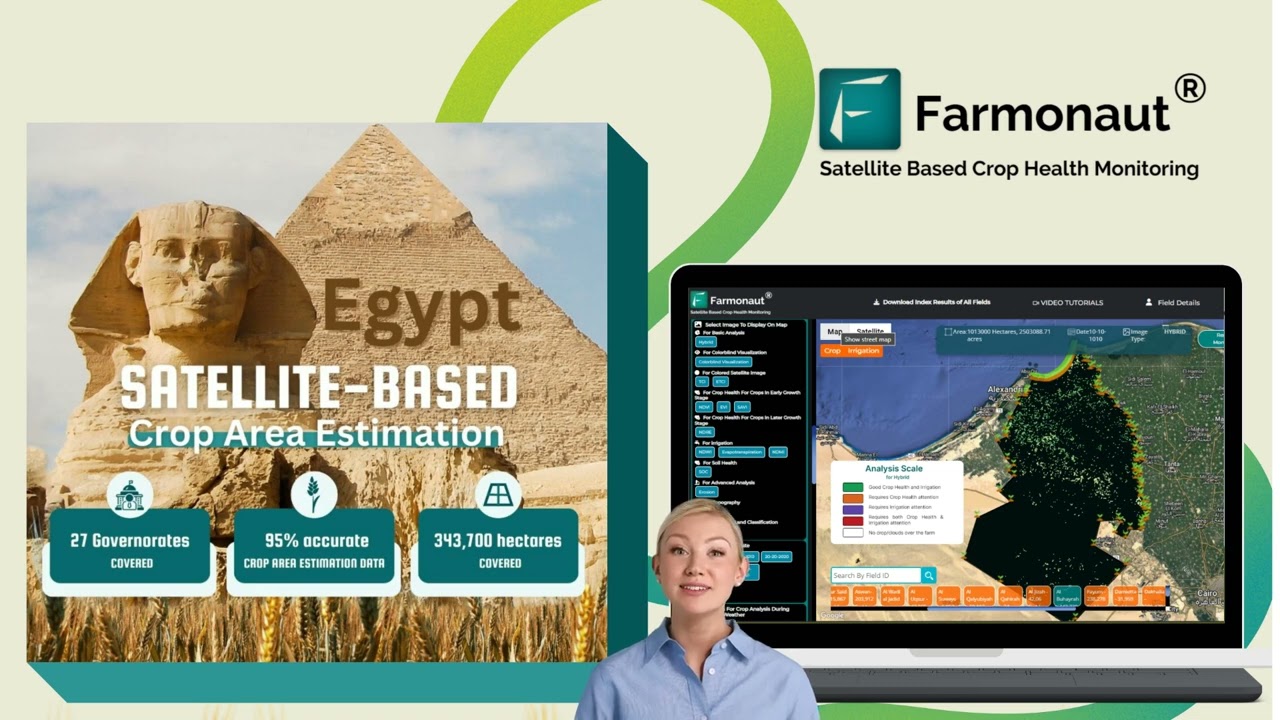
Watch drone-assisted crop monitoring in a working field:
Aerial-Imagery Adoption by Crop: The USDA Numbers
ARMS asks farmers directly whether they used aerial imagery — drone or manned aircraft — on their acres, and reports it by crop and survey year, since each crop is polled on a rotating schedule rather than annually. The figures published by USDA ERS’s aerial-imagery chart: soybeans 9.8% of planted acres (2018), corn 7.0% (2016), sorghum 4.6% (2019), winter wheat 3.5% (2017), and cotton 2.8% (2019). For comparison, corn growers’ adoption of yield maps reached 43.7% and soil maps 21.5% in that same 2016 survey — aerial imagery, drone included, is still the least-used precision layer USDA tracks.
| Crop | Aerial-imagery adoption | Survey year |
|---|---|---|
| Soybeans | 9.8% of planted acres | 2018 |
| Corn | 7.0% of planted acres | 2016 |
| Sorghum | 4.6% of planted acres | 2019 |
| Winter wheat | 3.5% of planted acres | 2017 |
| Cotton | 2.8% of planted acres | 2019 |
Precision Farming Drones and the Software Stack Behind Them
Farming drone software matters as much as the airframe: the imagery is only worth flying if it turns into a field map your irrigation, spraying, or scouting decisions can actually use. A capable stack pairs a drone or satellite imagery source with crop-health analytics, weather data, and record-keeping that exports to whatever farm management system you already run. This is the same layer that supports broader autonomous farming equipment as it spreads across US and UK operations.

Farm Drone Solutions Compared
| Technology | Primary use | Data collection method | Relative cost | Setup effort |
|---|---|---|---|---|
| Drones (Farmonaut-compatible) | Plant-level scouting, spot soil/moisture checks, yield-loss mapping | Multispectral aerial imaging | $$ – $$$ | Medium |
| Satellite imagery | Season-long trend tracking, whole-field and multi-field monitoring | Orbital multispectral sensors | $ – $$ | Low |
| IoT ground sensors | Soil moisture, temperature, localized weather | Fixed in-field sensors | $ – $$$ | Medium |
| GPS-guided machinery | Precision planting, variable-rate input application | GPS plus on-board sensors | $$$ – $$$$ | High |
Watch how data analytics turns raw imagery into a usable field record:

Calculate Your Own Drone Scouting Coverage
Coverage rate and battery life differ by drone model and payload, so run your own numbers instead of a generic estimate — pull the coverage-rate figure from your drone’s spec sheet or your operator’s flight log.
Run your own numbers
Assumes one drone, one operator, and a constant coverage rate. It excludes weather downtime, image-processing time after each flight, and FAA/CAA airspace restrictions on where or when you can fly.
Drones in Agriculture: US FAA Rules and UK CAA/HSE Rules
Flying a drone in agriculture for imagery is one regulatory question in the US and the UK; spraying from one is a further, separate question in both.
United States: FAA Part 107 and Part 137
Operating a drone commercially over a field — mapping, scouting, or crop counting — requires an FAA Part 107 Remote Pilot Certificate. Dispensing anything from the aircraft, including pesticide or fertilizer, brings Part 137 agricultural-aircraft-operations rules into play alongside FAA exemptions written specifically for unmanned aircraft. Because the exemption process and equipment thresholds for agricultural UAS have been revised more than once, check the FAA’s UAS operations pages directly before planning a spray mission rather than relying on a secondhand summary.
United Kingdom: CAA Authorisation Plus an HSE Permit
In the UK, flying an agricultural drone for imagery needs a Civil Aviation Authority operational authorisation, the same baseline required for any commercial drone flight. Spraying from a drone needs that CAA authorisation plus a separate Aerial Spraying Permit from the Health and Safety Executive for every application, under HSE’s aerial-spraying guidance. HSE processes a completed Application Plan in 10 days where no conservation consultation is needed, and in at least a month where one is. As reviewed in August 2026, HSE’s own page states there are no commercial authorisations yet in force for applying pesticide by drone in the UK — only Extrapolated Trials Permits for experimental work — and operators still need PA1 and PA6 certification, with spray equipment inspected before its fifth year in service and every three years after that. HSE’s page is the primary register to check for whether that status has changed.
Watch how connected field sensors support this kind of compliance record-keeping:
For the broader picture of how UK arable and livestock operations are adapting their equipment and compliance stack, see our overview of UK agriculture technology trends.
A Checklist Before You Buy Into Drone Crop Monitoring
- Pull the current ARMS numbers for your crop. ERS updates its aerial-imagery and precision-ag charts on a rolling basis — check your crop’s specific figure before assuming it matches corn’s 7.0% or soybeans’ 9.8%.
- Confirm your operator’s certification. In the US, ask for a Part 107 Remote Pilot Certificate and, for spraying, Part 137 exemption paperwork; in the UK, ask for the CAA operational authorisation and, for spraying, the HSE Aerial Spraying Permit for that specific application.
- Run your acreage through the coverage calculator above before buying, not after — a drone covering 45 acres/hour cannot scout 3,000 acres on a 3-hour flying day.
- Decide what satellite data already covers. If season-long trend detection is the actual goal, a lower-cost satellite layer plus autonomous equipment may answer it without a drone purchase at all.
- Check the software, not just the airframe. Farming drone software should export to whatever farm management platform you already run — confirm the imagery format is portable before you buy.
Getting Started with Farmonaut
Farmonaut combines satellite monitoring, drone-compatible imagery layers, and farm management tools in one subscription, alongside the wider set of sustainable farming techniques covered elsewhere on this site. Four ways to start:
- Open the web app and load your first field boundary.
- Install the mobile app for field-level alerts.
- Request a demo of satellite-plus-drone-layer overlays for your own acreage.
- If you build software, connect directly through the API below.



For developers integrating Farmonaut’s satellite and weather data into their own systems, we offer a comprehensive API. See the API Developer Docs for setup details.
Frequently Asked Questions
Q: Is drone crop monitoring worth it for a small farm?
A: Run the numbers from the calculator above against your acreage first. USDA’s ERS data show adoption of every precision technology, drones included, rising sharply with farm size — large-scale crop farms reached 70% guidance-autosteer adoption in 2023 versus 52% on midsize farms — so the economics genuinely favor bigger operations, though satellite-only monitoring can close much of the gap at lower cost on smaller acreage.
Q: Can I legally spray my own field with a drone?
A: In the US, you need an FAA Part 107 certificate plus Part 137 agricultural-operations compliance; in the UK, you need a CAA operational authorisation plus an HSE Aerial Spraying Permit, and HSE’s own guidance states no commercial pesticide-by-drone authorisations are yet in force there. Check both regulators’ current pages before you fly.
Q: How current is drone/aerial-imagery adoption data?
A: USDA’s ARMS survey polls each major crop on a rotating cycle rather than every year — the figures cited here run from 2016 to 2019 by crop, with the farm-size breakdown from 2023. Check ERS’s aerial-imagery chart for whichever crop and year is most recent when you read this.
Discussion
Questions, corrections or field experience? Share them below. First-time comments are reviewed before they appear, and your email is never published.
No comments yet. Be the first to add a question or your experience.

 Concept Global
 Kubota
 FFBS
FFBS Jontra
 Kalustyan
 Tucor
Tucor Geno
Geno Hayleys Agriculture
 Linx Agritech
 Adinet
 Save Your Soils
 Grandstream Algérie
 XOS Realty
 Geospatial Lab Africa
 Agro La Gándara
 HIPSAC
 ZOL Zimbabwe
 Licence holder · Niger · Gold










