

Deer & Venison Farming Australia: Agritech for Real Herds
Reviewed August 2026 against Farm Transparency Project, USDA NASS, and Deer Industry New Zealand data.
Try it: Run your own numbers →
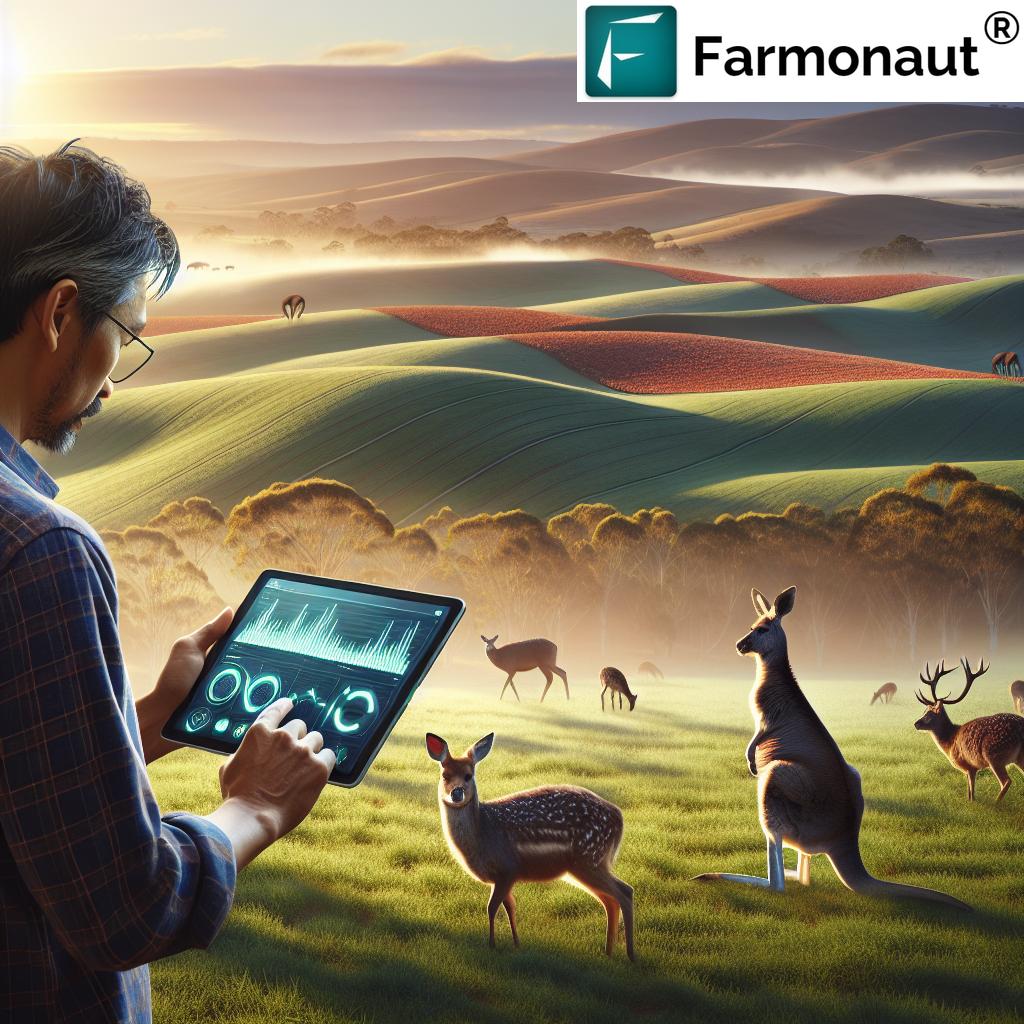
Australia’s farmed deer herd stood at roughly 45,000 head across about 1,400 deer farms, per the most recent figures compiled by the Farm Transparency Project (Farm Transparency Project). That is a small, specialist industry compared with cattle or sheep — but it is a real one, with genuine venison farming Australia operators running red deer and fallow deer herds from the Southern Tablelands of New South Wales through Victoria and into Tasmania. This article sets out what a deer farmer or prospective deer farmer actually needs: verified herd and market numbers, how Australian venison farming compares with the United States and New Zealand, and which agritech tools — satellite pasture monitoring, virtual fencing, RFID tracking — are worth the money on a herd this size.
Deer Farming in Australia: The Numbers That Matter
Deer farming in Australia began in the 1970s, built mainly on venison and, on some properties, velvet antler destined for traditional Asian medicine markets. Red deer and fallow deer remain the dominant species. Unlike cattle, sheep, or grain, there is no single government agency that publishes an annual, isolated venison production or export figure for Australia — Meat & Livestock Australia and the Department of Agriculture, Fisheries and Forestry report red meat in aggregate, and venison volumes are folded into broader categories rather than broken out. That is a genuine gap in public reporting, not an oversight on our part, and it is worth knowing before you trust any site that quotes a precise Australian venison export value without a source.
What is verified: the Farm Transparency Project’s most recent compilation puts the Australian farmed deer herd at approximately 45,000 head across some 1,400 farms (2018 data, the latest publicly available figure of its kind). No state-by-state breakdown — including for New South Wales, where a meaningful share of Australian deer farms operate — has been published at a comparable level of verification. If you are scoping a deer farm NSW venture or comparing regional herd sizes, the honest starting point is that this data is not centrally tracked; MLA members and state departments of primary industries are the places to ask for the closest thing to a regional estimate.
That US figure deserves unpacking, because it is easy to misread. The USDA’s 2022 Census of Agriculture recorded 1,352,932 captive farmed deer in California alone (USDA NASS, 2022 Census of Agriculture) — a number that includes deer farmed for hunting-preserve stock and non-venison purposes as well as meat production, and is not directly comparable to Australia’s meat-focused herd. Still, it establishes that deer farming in the US operates at a completely different scale in at least one state, which matters if you are benchmarking a “deer farming” search against US results. Canada’s farmed cervid population — deer and elk combined — was 29,655 head in 2023 (Agriculture and Agri-Food Canada), a scale much closer to Australia’s than California’s is.
Venison Farming Australia vs. the United States and New Zealand
For anyone researching venison farming Australia as a business, the most useful comparison isn’t herd size — it’s what the meat sells for and where it goes. In the United States, retail venison pricing tracked by The Pricer in 2026 shows roasts and stew cuts running $15–30 per pound, with premium cuts — loin, backstrap, chops — commanding $25–45 per pound (The Pricer, 2026). That US retail range is a useful reference point for Australian producers selling direct-to-consumer or into specialty butchers, even though it is not an Australian price and should not be quoted as one.
New Zealand is the benchmark for what a small-herd deer industry can achieve at export scale. Deer Industry New Zealand reported 14,762 tonnes of venison exported in 2021, with the United States as the largest single destination at 3,600 tonnes (Deer Industry New Zealand). The Ministry for Primary Industries and Deer NZ projected total New Zealand venison export value at around $200 million for 2024. Australia has never published a comparable aggregate figure — which is itself the point: NZ built an export identity around venison specifically, while Australian venison remains bundled inside general red-meat statistics. A producer asking “is there a real export market for venison” should look at what NZ proved is possible, not assume Australia already has an equivalent pipeline.
Deer Farms, Deer Farmers, and What “Deer Factory” Searches Are Really Asking
Search terms like “deer factory” typically point toward intensive, high-density deer farming operations rather than any specific branded facility — there is no single entity called a “deer factory” in Australian or US agriculture records. If you’re researching that term, what you actually want is data on farming density and intensity: Australia’s roughly 45,000 head across 1,400 farms averages out to about 32 deer per farm, which is a paddock-and-pasture operation, not an intensive feedlot model. That average masks real variation — some properties run several hundred head, others a few dozen — but there is no published Australian breakdown finer than the national total, so treat any per-farm average as an estimate, not a verified figure.
For readers specifically asking about deer farms Australia-wide versus a deer farm NSW operation: the national figures above (45,000 head, 1,400 farms) are the only verified numbers available; state-level figures for NSW are not separately published. If you operate or are scoping a farm in NSW, the practical move is to contact the NSW Department of Primary Industries and Regional Development directly for the closest available regional estimate, since no third-party source currently publishes one.
Agritech Innovations for Deer Farming
Deer farming sits at an odd point in agritech adoption — it’s livestock, so cattle-industry tools mostly transfer, but deer are flightier and harder to handle than cattle, which makes remote monitoring more valuable per animal, not less. Three categories of technology matter most on an Australian or US deer operation: satellite pasture monitoring, herd-tracking hardware, and traceability software.
1. Satellite Pasture and Paddock Monitoring
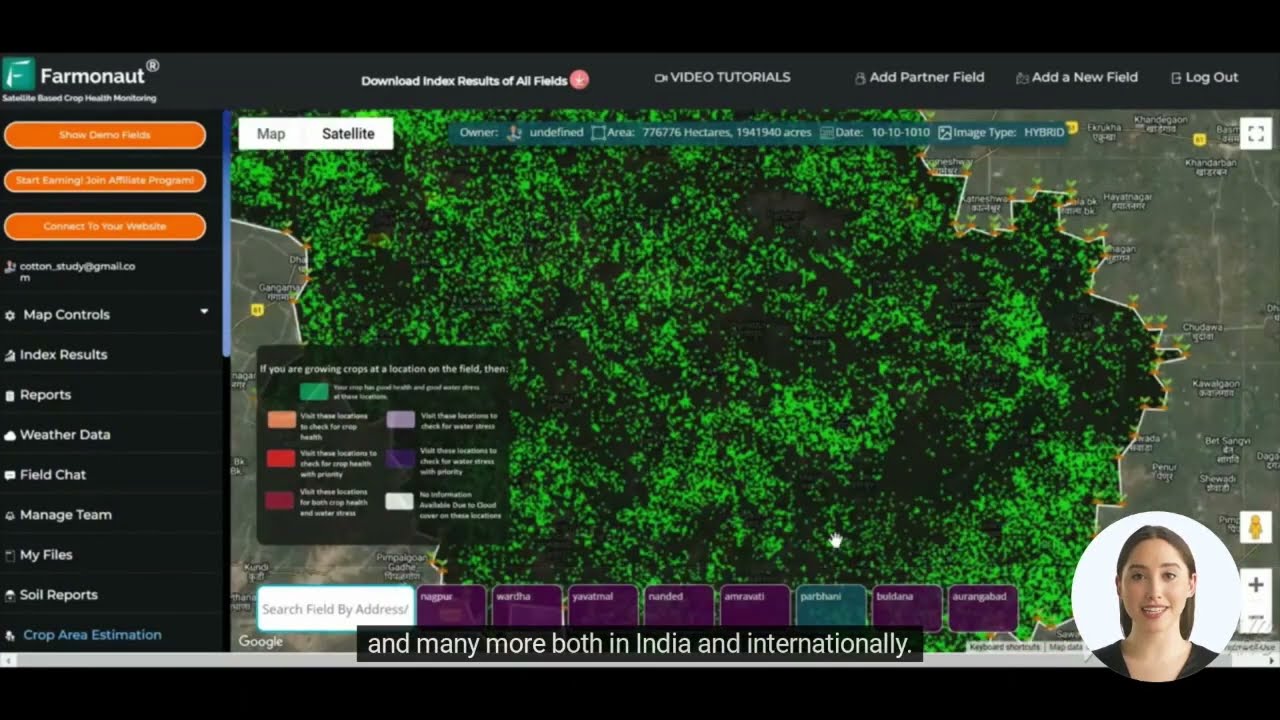
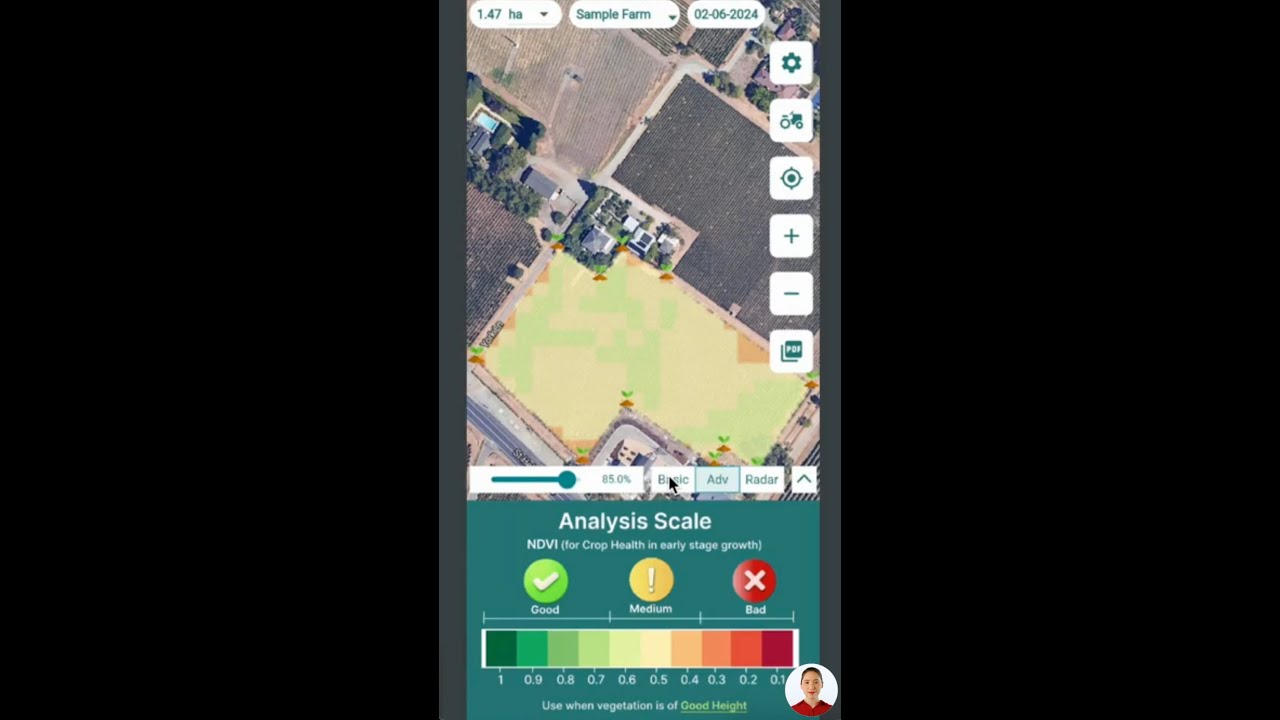
Precision agriculture technology built on satellite imagery gives deer farmers the same core capability crop growers use, applied to grazing land instead of row crops. Farmonaut’s platform provides:
- Vegetation health (NDVI) analysis to time paddock rotation before pasture is overgrazed
- Soil moisture monitoring to schedule irrigation on improved pasture
- AI-driven advisory output (Farmonaut’s Jeevn AI) for rotation and fertilization timing
- Multi-paddock tracking from a single dashboard, useful across a farm running several hundred hectares of grazing land
On a herd of a few dozen to a few hundred deer, the case for satellite monitoring is pasture efficiency, not animal tracking — deer strip pasture faster than cattle in a small paddock, and knowing NDVI trends before visible overgrazing lets you rotate a week earlier.
2. GPS Collars, Virtual Fencing, and RFID
Adoption data here comes from cattle and general livestock studies, since no published study isolates deer-specific adoption rates — a genuine gap worth naming rather than papering over. GPS tracking collar adoption across cattle and general livestock herds reached 12% by 2026, according to Indexbox market research (Indexbox, 2026). Automated animal health monitoring — sensors and software that flag illness or injury without a physical check — was in use on 37.2% of US livestock farms as of a 2023 peer-reviewed review (NCBI/PMC, Precision Livestock Technology Review, 2023). Deer are more flight-prone than cattle and harder to muster by hand, so GPS collars and virtual fencing tend to pay back faster per head than on a comparable cattle operation, even without deer-specific adoption data to point to.
RFID ear tags remain the baseline traceability technology on most farms and pair directly with blockchain-based supply chain tools (below) — an RFID tag is the physical anchor for whatever digital record follows the animal to processing.
3. Blockchain-Based Traceability
Consumers buying venison at a premium — recall the US retail range of $15–45 per pound depending on cut — increasingly expect provenance data, not just a label. Blockchain traceability systems record an animal’s movement and handling from farm to processor to retailer in a form that can’t be quietly edited after the fact. For Australian and US venison producers competing against beef and lamb on price per pound, verifiable provenance is one of the few levers that supports a premium price without simply asking the customer to trust the label.

Deer Farming Technology Adoption: Comparison Table
| Metric | Figure | Source & Date |
|---|---|---|
| Australian farmed deer herd | ~45,000 head | Farm Transparency Project, 2018 |
| Australian deer farms | ~1,400 | Farm Transparency Project, 2018 |
| California (US) captive farmed deer | 1,352,932 | USDA NASS 2022 Census |
| Canada farmed cervids (deer & elk) | 29,655 | Agriculture and Agri-Food Canada, 2023 |
| NZ venison export volume | 14,762 tonnes | Deer NZ / Figure.NZ, 2021 |
| NZ venison to United States | 3,600 tonnes | Deer NZ, 2021 |
| US retail venison (roasts/stew) | $15–30/lb | The Pricer, 2026 |
| US retail venison (premium cuts) | $25–45/lb | The Pricer, 2026 |
| US animal health monitoring adoption | 37.2% of livestock farms | NCBI/PMC, 2023 |
| GPS collar adoption (cattle/livestock) | 12% | Indexbox, 2026 |
| European precision feeding (dairy) | 41.6% | Choices Magazine, 2024 |
| Australian venison export value (aggregate) | Not separately published | MLA / DAFF do not isolate venison from red meat totals |
Pasture Management, Genetics, and Sustainable Practice
Because deer overgraze faster than cattle on a like-for-like paddock, pasture research for Australian herds concentrates on rotational grazing intervals and drought-resilient species suited to the same country cattle and sheep run on. Sustainable soil management practices — maintaining ground cover, avoiding compaction on repeatedly grazed paddocks, and managing organic matter — carry over directly from cattle-country guidance, since deer paddocks in Australia are typically converted or shared grazing land rather than purpose-built deer country.
No-till farming principles apply to any fodder cropping done alongside a deer enterprise — many Australian deer farms grow supplementary fodder crops on the same property, and reduced tillage protects the soil structure that pasture regrowth depends on after a herd moves through.
Genetic improvement — selective breeding for growth rate and meat quality, and genomic selection to accelerate those gains — is the other lever producers use to close the gap between Australia’s small herd and larger-scale operations overseas. There is no published Australian genetic-gain dataset comparable to the herd and export figures above; producers pursuing this should work through breed societies and university agricultural extension programs rather than expect a national statistic.
Workforce, Training, and Where New Entrants Come From
A “deer farmer” or “deer farmers” search often comes from someone assessing whether to enter the industry, not an existing operator. The honest picture: deer farming in Australia and the US is a specialist skill set layered on general livestock handling — mustering, yard design, and animal welfare practices differ enough from cattle that dedicated training matters. Deer farming career and training pathways in comparable markets like the UK show how a small-herd industry builds a skilled workforce through agricultural college modules, mentorship pairing, and field days rather than large-scale formal degree programs — a model that applies equally to Australian and US entrants sizing up the trade.

Calculator: Pasture Rotation Days for a Deer Herd
Deer strip pasture faster than cattle per head of comparable liveweight, so rotation timing is the single decision this article’s tools are built around. Enter your herd size and paddock area to estimate how many grazing days a paddock will support before rotation, using a deer-specific intake benchmark you can adjust for your own pasture quality.
Run your own numbers
Assumptions: uses a flat dry-matter intake figure you supply per deer, applies a single utilisation rate to represent the portion of standing pasture safely grazed before residual cover drops too low, and does not account for regrowth during the grazing period, pasture species, season, or weather. It excludes supplementary feeding and is a starting estimate only — adjust the intake and yield figures to match your own paddock assessment.
Investment, Markets, and Export Development
Vertical integration — processing facilities, specialty venison cuts, deer-based pet food and nutraceuticals — is where most of the value-add opportunity in Australian deer farming sits, precisely because raw venison competes on price per pound against beef and lamb without much differentiation. Technology investment follows a similar logic to the cattle industry: precision livestock farming tools built for cattle mostly need only handling and yard-design adaptation, not a rebuild, to work for deer.
Export market development is the area where New Zealand’s 14,762-tonne, roughly $200 million venison trade (Deer NZ, 2021–2024 figures) sets a credible bar rather than a hypothetical one. An Australian producer or investor sizing up export ambitions has a real comparison to work from — NZ figures are public and dated, unlike any aggregate Australian export figure, which as noted above simply is not published as a standalone number by MLA or DAFF.
Farmonaut’s Tools for Deer Farm Operations
Farmonaut provides precision agriculture solutions that apply directly to deer farm pasture and paddock management:
- Satellite-Based Pasture Monitoring: NDVI and vegetation-health imagery to time rotation before overgrazing.
- Jeevn AI Advisory: Personalized guidance on rotation timing, fertilization, and paddock sequencing.
- Blockchain Traceability: Farm-to-consumer product tracking to support premium positioning against beef and lamb.
- Resource Management Tools: Water and fodder allocation tracking across multiple paddocks or properties.
Explore the web app directly, or integrate the API into your own farm management system. Broader context on where these tools fit across agriculture generally is covered in Farmonaut’s agritech innovations overview and its rundown of new technology in agriculture.
Where This Data Gets Stale — and How to Refresh It
Treat every figure in this article as dated evidence, not a permanent fact, and use these paths to check for something newer:
- The Farm Transparency Project updates its Australian farmed-animal database periodically; check farmtransparency.org/kb/food/deer directly for a more current herd or farm count than the 2018 figures used here.
- USDA NASS runs a full Census of Agriculture every five years, with the next full census due in 2027; between censuses, the Quick Stats database at quickstats.nass.usda.gov carries interim figures for “farmed deer” by state.
- The Pricer updates US retail venison pricing monthly; check thepricer.org/venison-cost-per-pound for the current range rather than assuming the $15–45/lb figures cited here still hold.
- No source currently isolates Australian venison production tonnage or export value from aggregate red-meat statistics; if that changes, it would most likely appear through Meat & Livestock Australia’s public reporting.
FAQ Section
Q1: How many deer are farmed in Australia?
A1: Approximately 45,000 head across roughly 1,400 farms, per the Farm Transparency Project’s 2018 compilation — the most recent publicly available figure. No more recent national count has been published; check the source directly for updates.
Q2: What is venison worth per pound in comparable markets?
A2: In the US, retail venison ran $15–30 per pound for roasts and stew cuts and $25–45 per pound for premium cuts like loin and backstrap, per The Pricer’s 2026 pricing data. Australia does not have a comparable published national retail benchmark.
Q3: Does Australia export venison at the scale New Zealand does?
A3: Not by any published measure. New Zealand exported 14,762 tonnes of venison in 2021, worth a projected $200 million by 2024 (Deer NZ, MPI). Australian venison export volume and value are not separately reported by MLA or DAFF — they are folded into aggregate red-meat statistics.
Q4: What agritech actually helps a deer farm, versus a generic cattle farm?
A4: Satellite pasture monitoring (NDVI, soil moisture) transfers directly. GPS collars and virtual fencing matter more per head on deer than cattle, because deer are more flight-prone and harder to muster by hand — though adoption data (12% GPS collar adoption, Indexbox 2026; 37.2% automated health monitoring, NCBI/PMC 2023) is drawn from general livestock studies, not deer-specific research, which does not yet exist in published form.
Q5: Are deer farms in Australia mostly small operations?
A5: The national average works out to about 32 deer per farm (45,000 head / 1,400 farms), which points to pasture-based operations rather than intensive feedlots — though no state-level breakdown, including for NSW, is publicly available to confirm regional variation.
Access Farmonaut’s Precision Agriculture Solutions
To explore how Farmonaut’s precision agriculture technology can support your deer farming operation, check out their platforms:



For developers integrating Farmonaut’s agricultural data tools into their own systems, see the API Developer Documentation.

Farmonaut Subscriptions
Discussion
Questions, corrections or field experience? Share them below. First-time comments are reviewed before they appear, and your email is never published.
No comments yet. Be the first to add a question or your experience.

 Inclusive Growth Chain
 AdBio
 MISE Maroc
 Drift-Sense
 NWNS
 Red August Group
 Farm Inc
 WeMe Global
 Agrotoken
 Blue BearX
 Insignito
 Croptimum
 DnCubed
 Field Capacity
 Indosistim Teknologi
 Liquify Digital
 CU Foods
 BeyondTech Global

 Licence holder · Niger · Gold
 Licence holder · Nigeria · Gold + lithium










