

Reviewed August 2026 against USDA NASS, CEH and Sciencebasedtargets.
Try it: Farm-or-Plantation Classification Test →
Plantation vs Farm: The 4 Tests That Tell Them Apart
Every plantation is a farm; most farms are not plantations. “Farm” is the legal and statistical category — in the United States, the USDA Census of Agriculture counts “any place, urban or rural, that produced and sold, or normally would have sold, $1,000 or more of agricultural products during the census year.” “Plantation” is a descriptive sub-type: a large, single-crop estate growing a long-lived commercial crop for distant markets. There is no acreage threshold in US law that flips a farm into a plantation, which is exactly why the question keeps getting asked — so below, four tests you can actually measure, benchmarked against real USDA numbers.
Farm — any operation clearing $1,000 in agricultural sales; 1.88 million of them in the US in 2024, averaging 466 acres.
Plantation — a farm where one perennial crop occupies most of a large acreage on a multi-year cycle, sold into commodity or export channels.
Is a plantation a farm? Yes, in every statistical system that matters. Louisiana sugarcane estates and Hawaii coffee estates are both counted as farms by USDA.
Table of Contents
- The four tests that separate a plantation from a farm
- Is a plantation a farm? The statistical answer
- How US farm scale actually distributes
- Run your own acreage through the four tests
- What American “plantations” look like in USDA data
- Plantation forestry: the same word, a different accounting system
- ESG tree planting strategy: why farm vs plantation now costs money
- Vermicomposting vs vermiculture: the same confusion, smaller scale
- Settling the classification with satellite evidence
- Farmonaut app and API access
- Frequently asked questions
- Try it: Farm-or-Plantation Classification Test
The Four Tests That Separate a Plantation From a Farm
Dictionaries describe plantations vaguely. Auditors, lenders and certification bodies do not — they look at four measurable attributes. An operation passing three or four reads as a plantation to almost any assessor; one or two, and it reads as a farm.
| Test | Farm reading | Plantation reading | Benchmark you can check |
|---|---|---|---|
| 1. Absolute scale | At or near the regional average | Several multiples of it — commonly 5× or more | US average 466 acres (2024); Louisiana 329; Hawaii 162 |
| 2. Monoculture share | Rotations, mixed enterprises, livestock alongside crops | One crop over ~70%+ of planted area, year after year | Compute largest-crop acres ÷ total planted acres |
| 3. Crop lifespan | Annuals replanted each season | Perennials or ratoon crops held 3–30+ years | Sugarcane ratoons ~3–5 yrs; coffee 20–30; planted pine 20–35 |
| 4. Market distance | Local, regional, or domestic processors | Export or global commodity chains with traceability duties | EU Regulation 2023/1115 covers 7 such commodity chains |
Notice what is not on that list: ownership structure, labour arrangements, or history. Those matter enormously to how the word “plantation” is heard in American English, and they are why USDA never adopted it as a statistical category. But they are not what makes a growing operation function as a plantation agronomically or commercially.

Is a Plantation a Farm? The Statistical Answer
Yes — and the numbers show why the distinction is about concentration rather than category. According to USDA Economic Research Service, the United States had 1.88 million farms on 876 million acres in 2024, averaging 466 acres. Farm numbers peaked at 6.8 million in 1935 and fell 8% between the 2017 Census and 2024 (2.04 million to 1.88 million), while farmland fell 3% (900 million to 876 million acres).
The striking part is that average size barely moved: 466 acres in 2024 against about 440 acres in the early 1970s. Consolidation did not happen by every farm getting bigger. It happened by production concentrating into a thin band of very large operations — the plantation-scale tier, whatever you call it.
USDA ERS data for 2024 splits it cleanly by gross cash farm income (GCFI):
- Small family farms (GCFI under $350,000): 86% of all farms, 40% of farmland, 17% of production value.
- Midsize family farms ($350,000–$999,999): 6% of farms, 18% of farmland, 18% of production value.
- Large-scale family farms ($1 million or more): 5% of farms, 33% of farmland, 50% of production value.
- Nonfamily farms: 3% of farms, 14% of production value — down from 17% in 2023.
Family farms of all sizes were 97% of farms, 91% of farmland and 85% of production value. So when someone asks whether a plantation counts as a farm, the honest reply is: it counts, and it sits in the 5% that produces half of everything.
How US Farm Scale Actually Distributes
The gap between how many farms exist and how much they produce is the single most useful chart for understanding the farm/plantation question.

Run Your Own Acreage Through the Four Tests
Enter your own block and the tool scores it against the four tests above, using the USDA size benchmarks already cited.
Farm-or-Plantation Classification Test
Assumptions: thresholds are 5× the regional average acreage, 70% single-crop share, a 3-year-plus standing cycle and 50% export/commodity share — drawn from the USDA and EU figures cited above, not from any statute. It excludes ownership structure, labour arrangements, tenure history, irrigation, and processing integration, all of which can change how an operation is classified by a specific certifier or lender.
What American "Plantations" Look Like in USDA Data
The United States does grow classic plantation crops, and USDA publishes the numbers each season. These are the concrete comparisons the word "plantation" usually lacks.
| Operation type | Area | Output | Counted as a farm? |
|---|---|---|---|
| Louisiana sugarcane (2025) | 529,000 planted acres, statewide | 16,872,000 tons at 31.9 tons/acre | Yes — inside Louisiana's 24,300 operations on 8.0 million acres (avg 329 acres) |
| Hawaii coffee (2025 crop) | 6,500 planted acres, statewide | 9,100 tons, valued at $46,426,000 | Yes — inside Hawaii's 6,500 operations on 1,050,000 acres (avg 162 acres) |
| Hawaii macadamia (2025 crop) | 16,300 planted acres | 15,300 tons (1,880 lb/acre), $31,824,000 | Yes |
| Southern pine plantation | 32 million acres by 2000, up from under 2 million in the 1950s | Over 400 cu ft/acre/year in 1990s stands, vs under 90 in 1950s–60s stands | Generally no — timberland is inventoried by the Forest Service, not the Census of Agriculture |
Two things stand out. First, Hawaii's average operation is 162 acres — smaller than the national average, in the state most associated with the plantation era. Scale alone is a weak test without a regional benchmark, which is why the calculator above makes you choose one. Second, sugarcane at 31.9 tons per acre across 529,000 acres is the clearest live example of plantation logic in US agriculture: one perennial crop, ratooned for several harvests, feeding a handful of mills.

Plantation Forestry: The Same Word, a Different Accounting System
Half the confusion in "farm vs plantation" comes from forestry borrowing the word. A planted pine stand in Georgia and a coffee estate in Kona are both called plantations, but they sit in separate statistical universes: one is inventoried through the Forest Service's Forest Inventory and Analysis programme, the other through the Census of Agriculture.
The USDA Forest Service documents the scale of that shift precisely: southern pine plantations grew from under 2 million acres in the 1950s to 32 million acres by 2000 — roughly a sixteen-fold expansion in fifty years. Productivity moved just as far. Stands established in the 1950s and 1960s produced under 90 cubic feet per acre per year; 1990s stands exceeded 400 cubic feet per acre per year, driven by tree improvement, site preparation and fertilisation. That is a four-fold gain from silviculture alone, and it is the reason plantation forestry now dominates southern wood supply.
For anyone writing a land-use policy, a lease, or a sustainability report, the practical rule is this: if the crop is harvested as timber or fibre, expect forestry rules, rotation-based carbon accounting and Forest Service inventory definitions. If it is harvested as food, fibre for textiles, or beverage crops, expect USDA farm definitions, crop insurance frameworks and food-safety traceability. The word is the same; almost nothing downstream is.
ESG Tree Planting Strategy: Why Farm vs Plantation Now Costs Money
An ESG tree planting strategy is where the plantation/farm distinction stops being semantic and starts being audited. A corporate pledge to "plant trees" can mean restoring mixed native forest, or establishing a fast-rotation monoculture plantation. Those two produce very different carbon, biodiversity and disclosure outcomes — and reporting frameworks increasingly require you to say which one you funded.
The three constraints an ESG tree planting programme now has to satisfy
- Survival, measured — not planted counts. A study of 176 tropical and sub-tropical restoration sites, published in Philosophical Transactions of the Royal Society B on 14 November 2022 and summarised by the UK Centre for Ecology & Hydrology, found 18% of planted saplings died within the first year, rising to 44% by year five. Saplings planted near existing mature trees had roughly a 20% higher survival chance. A programme reporting trees planted rather than trees alive at year five is overstating its result by close to half.
- Target-setting rules. The Science Based Targets initiative requires Forest, Land and Agriculture (FLAG) targets from food production, food and beverage processing, food and staples retailing and tobacco companies — plus any company whose FLAG-related emissions exceed 20% of total scope 1, 2 and 3 emissions. FLAG sectors represent 22% of global greenhouse gas emissions, third behind energy and industry. A no-deforestation commitment is mandatory, with a cut-off date of 2020 or earlier and no later than three years before a company's first FLAG target submission.
- Supply-chain proof. EU Regulation 2023/1115 covers cattle, wood, cocoa, soy, palm oil, coffee and rubber plus derived goods such as leather, chocolate, tyres and furniture. Operators must prove products did not originate on recently deforested or degraded land. Large and medium operators must comply from 30 December 2026; micro and small operators from 30 June 2027. The regulation targets a cut of at least 32 million tonnes of carbon emissions per year.
Practically, that means an ESG tree planting strategy should specify four things in writing: the planting model (restoration vs production plantation), the geolocated polygon of every planting site, the survival measurement interval, and who verifies it. Plot-level geolocation is now the binding constraint under EUDR, not the tree count. Farms and plantations that record carbon and land-use change against defined boundaries can carry that evidence into carbon markets — the reason a carbon footprinting platform tied to satellite-observed boundaries is more useful for reporting than a spreadsheet of planting-day totals.
Where the plantation label helps and where it hurts
A production plantation is not automatically the worse ESG outcome. Fast-growing planted stands take harvest pressure off natural forest, and the southern pine productivity record above shows how much fibre a managed acre can deliver. What fails an audit is mislabelling: presenting a monoculture production plantation as ecological restoration, or counting rotation timber as permanent removal. Say which one you built, publish the boundary, publish the survival rate.
Vermicomposting vs Vermiculture: The Same Confusion, Smaller Scale
The difference between vermicomposting and vermiculture follows exactly the same pattern as farm vs plantation — one word names the practice, the other names the product you are selling. UConn Extension defines vermiculture as the use of worms (Eisenia spp.) to break down organic waste through their digestive processes; vermicomposting is the applied practice of turning that biology into a finished compost product.
In commercial usage the split is about revenue: vermiculture operations sell worms and breeding stock, vermicomposting operations sell castings. You cannot run either without the other, which is why the terms get used interchangeably even in trade catalogues.
The operating numbers from UConn Extension are specific enough to size a bed:
- Feed rate: one pound of Eisenia — about 1,000 worms — consumes roughly 3.5 lb of material per week.
- Stocking example: a single horse producing 350 lb of manure per week needs about 100 lb of Eisenia; 200 lb if the manure is mixed 1:1 with bedding.
- Temperature: optimal 65–75 °F, tolerable range 39–90 °F.
- Time to harvest: three to six months before bedding or manure is consumed and castings can be pulled.
- Population growth: worms double their population roughly every four months under ideal conditions.
- Species: Eisenia fetida and Eisenia andrei are recommended outdoors for cold tolerance.
Those figures also settle the classification question for tax and census purposes: a worm operation clearing $1,000 or more in sales meets the USDA Census of Agriculture farm definition — the same $1,000 threshold that a 5,000-acre sugarcane estate meets.

Settling the Classification With Satellite Evidence
Every one of the four tests reduces to a boundary and a time series, which is what satellite monitoring produces. Total operated area, single-crop share, how many seasons the same crop occupies a block, and whether the land was forest before a given cut-off date are all observable from orbit and all auditable after the fact.
- Delineate and measure the block. Multispectral crop-health monitoring gives you acreage, NDVI-based vigour and within-field variability per polygon — the raw material for the monoculture-share calculation you just ran.
- Establish crop history. Repeat imagery over several seasons shows whether a block held a perennial or was rotated, which is the crop-lifespan test and also the EUDR land-use-change test.
- Carry the evidence downstream. Chain-of-custody records matter once output enters a commodity channel; see this comparison of supply chain traceability platforms and our own blockchain-backed product traceability tools.
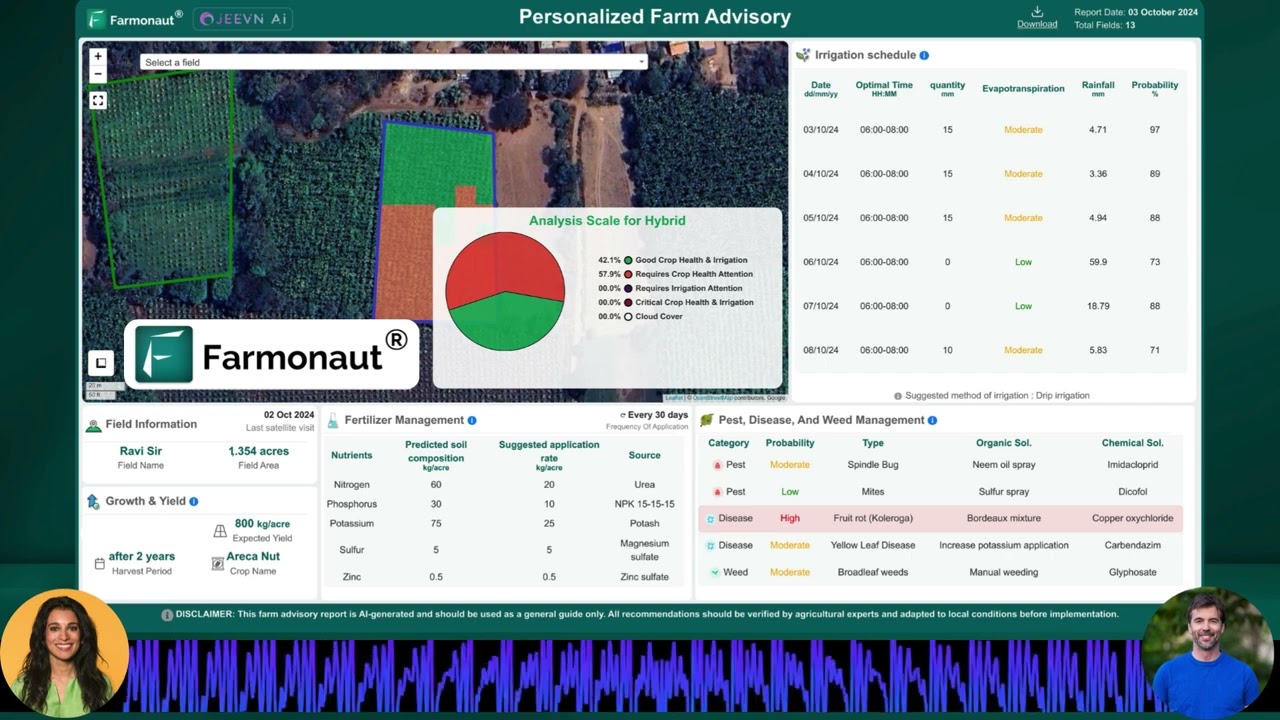
- Advisory on top of the imagery. The Jeevn AI advisory system combines satellite indices with weather to time irrigation and inputs — useful whether the block is 12 acres of mixed vegetables or 1,200 acres of cane.
- Estate logistics. Plantation-scale operations run fleets, not implements; our fleet management platform tracks machine and material movement across dispersed blocks.
- Multi-block administration. Where dozens of parcels report into one entity, a large scale farm management app consolidates them into a single view.
- Finance and insurance. Satellite verification of standing crop and area supports crop loan and insurance applications without a site visit for every parcel.
One adjacent comparison worth reading separately, since it sits outside the farm/plantation axis entirely: vertical farming vs traditional farming — controlled-environment production is neither a farm nor a plantation in the classical sense, and it is treated on its own page.


Farmonaut App and API Access
Measure your own blocks against the four tests with real imagery rather than estimates:



Building classification or EUDR-style due-diligence checks into your own systems? Pull satellite and weather layers directly through the Farmonaut API, with field-by-field call patterns documented in the API Developer Documentation.

Frequently Asked Questions
What is the difference between a farm and a plantation?
"Farm" is the legal category — in the US, any place selling $1,000 or more of agricultural products, per the USDA Census of Agriculture. "Plantation" describes a farm that concentrates one long-lived commercial crop across a large acreage for distant markets. The measurable separators are absolute scale relative to the regional average, single-crop share of planted area, how many years the crop stands before replanting, and whether output enters export or commodity channels.
Is a plantation a farm?
Yes. USDA counts Louisiana's 529,000 acres of sugarcane and Hawaii's 6,500 acres of coffee inside those states' farm totals — Louisiana's 24,300 operations and Hawaii's 6,500 operations respectively. The only common exception is timber: planted pine stands are inventoried by the Forest Service rather than the Census of Agriculture.
How many acres makes a plantation?
No statute sets a number. A defensible working rule is around five times the regional average operation size — so roughly 2,300 acres against the 466-acre US average, but only about 810 acres against Hawaii's 162-acre average. Acreage alone is the weakest of the four tests; monoculture share and crop lifespan discriminate better.
What is the difference between vermicomposting and vermiculture?
Vermiculture is raising worms (Eisenia fetida, Eisenia andrei) as the product; vermicomposting is using them to convert organic waste into castings as the product. UConn Extension puts the working feed rate at about 3.5 lb of material per pound of worms per week, with harvest at three to six months and an optimal bed temperature of 65–75 °F.
What should an ESG tree planting strategy actually report?
Trees surviving, not trees planted — because 18% die in year one and 44% by year five across 176 studied tropical restoration sites. Beyond survival, report the planting model (restoration or production plantation), geolocated site polygons, the verification interval and the verifier. Companies in FLAG sectors also need a no-deforestation commitment with a cut-off date of 2020 or earlier under SBTi rules, and EUDR compliance from 30 December 2026 for large and medium operators.
Why does the classification matter commercially?
Because it decides which rulebook applies: crop insurance and Census of Agriculture reporting for farms, forestry inventory and rotation carbon accounting for timber plantations, and EUDR due diligence for the seven commodity chains named in Regulation 2023/1115. Getting the label wrong means preparing the wrong evidence.
The Takeaway
Stop treating "farm" and "plantation" as opposites. Farm is the container; plantation is a shape the container can take, defined by concentration rather than by any legal boundary. Score your own acreage on scale, monoculture share, crop lifespan and market distance, benchmark it against the USDA average for your state rather than a national figure, and record the boundary and crop history in a form an auditor can check. That last step is what turns a definitional argument into evidence — and under EUDR and SBTi FLAG timelines, evidence is the part with a deadline attached.
Discussion
Questions, corrections or field experience? Share them below. First-time comments are reviewed before they appear, and your email is never published.
No comments yet. Be the first to add a question or your experience.

 Sampurn AgriConnect
 FCF India
 Unifrutti Gulf
 Deluxe Conseil
 TVS Electronics
 BW Pipelines
 WICO
WICO Gen Chayat
 Chimera Innovation
 SkyHarvest
 Polaris Digitech
 Teledarbas
 Wild Oak Farm
 SFX
SFX Doodlakine
