

Reviewed August 2026 against USDA Forest Service Forest Inventory and Analysis data, EPA heat-island research, and OSMRE’s Appalachian Regional Reforestation Initiative reporting.
Try it: ESG Tree-Planting Survival & Carbon Offset Calculator →
ESG Tree Planting Strategy: A CSR Framework With Metrics
Table of Contents
- What an ESG Tree-Planting Strategy Actually Requires
- Why Tree Planting Still Belongs in ESG and CSR Programs
- Building an ESG-Compliant Tree-Planting Strategy: 5 Steps
- Strategy Comparison at a Glance
- Sector Playbooks: Agriculture, Forestry, Mining, Infrastructure
- Measuring Progress and the Offset Calculator
- Tools for Verification and Logistics
- FAQ
- Conclusion
- Try it: ESG Tree-Planting Survival & Carbon Offset Calculator
What an ESG Tree-Planting Strategy Actually Requires
An ESG tree-planting strategy is a documented plan that ties every tree in the ground to a measurable outcome — carbon, biodiversity, soil, or community benefit — and to a monitoring method that can prove the outcome happened. It is not a planting event. A real strategy specifies site-selection criteria, a species list matched to the site, a survival-rate target checked at fixed intervals, and a reporting cadence that satisfies a named standard or your own investors. Earth Day and Earth Month are good deadlines for launching one; they are not the strategy itself.
Why Tree Planting Still Belongs in ESG and CSR Programs
The case for a tree-planting strategy inside a CSR or ESG program rests on documented, not projected, numbers. The USDA Forest Service put the value of America’s urban forest at $18.3 billion a year, spread across 5.5 billion urban trees covering 39.4% of urban land nationally: $5.4 billion in air-pollution removal, $5.4 billion in reduced building energy use, $4.8 billion in carbon sequestration, and $2.7 billion in avoided pollutant emissions (USDA Forest Service, Nowak & Greenfield). Divide that total by the tree count and each urban tree is worth about $3.33 a year across all four categories combined — our own calculation from the same dataset, useful as a floor estimate before a program runs its own canopy assessment.
Independently, the EPA has measured urban forests running 3.0°F cooler on average than non-green urban areas, green infrastructure cutting nearby building energy use by 10%, dense roadside vegetation cutting downwind pollutants by close to 30%, and urban trees reducing stormwater runoff by absorbing 15% to 27% of annual rainfall. The EPA also reports that a 10% increase in tree cover would mean about 50 fewer deaths a year in Salt Lake City and 3,800 fewer in New York City (EPA).

Building an ESG-Compliant Tree-Planting Strategy: 5 Steps
A strategic tree-planting program — the kind that survives an audit, not just a press release — runs through five decisions in order. Skipping any one of them is how a planting event turns into a line item nobody can defend later.
-
Match species and site to the land’s actual constraint.
- Prioritize degraded, deforested, or erosion-prone land — this is where mining, agricultural, and infrastructure sites overlap most.
- Choose native species for the specific site rather than a generic “tree kit”; species mismatched to soil or rainfall are a common cause of losses at the year-3 survival check.
- Example: in arid mining belts, drought-tolerant native species restore land and support local habitat at the same time a generalist species would fail.
-
Engage the community before the shovel goes in.
- Bring local residents into planning, planting, and monitoring — not just planting day.
- This creates local employment, supports food security through agroforestry, and respects existing land stewardship.
- Equity means the community also receives the ecosystem services — food, medicine, shade, cultural value — not just the labor.
-
Integrate with existing land management, not around it.
- In agriculture, agroforestry — trees combined with crops or livestock — improves soil and buffers climate swings rather than competing with the working land.
- In mining, post-extraction reclamation should use site-suitable trees chosen for the specific spoil chemistry, not a default species list.
- Coordinate with crop and forest advisory tools so planting decisions use the same field data as the rest of the operation.
-
Monitor on a fixed schedule and report the number, not the intention.
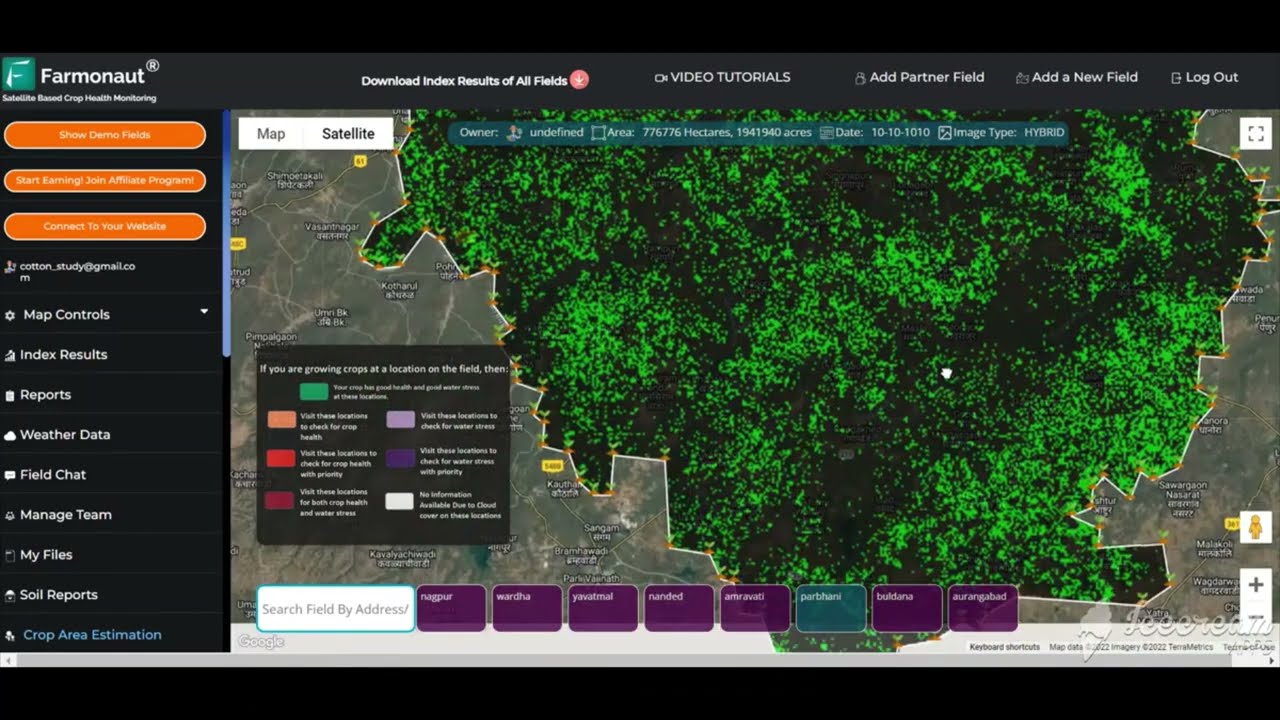
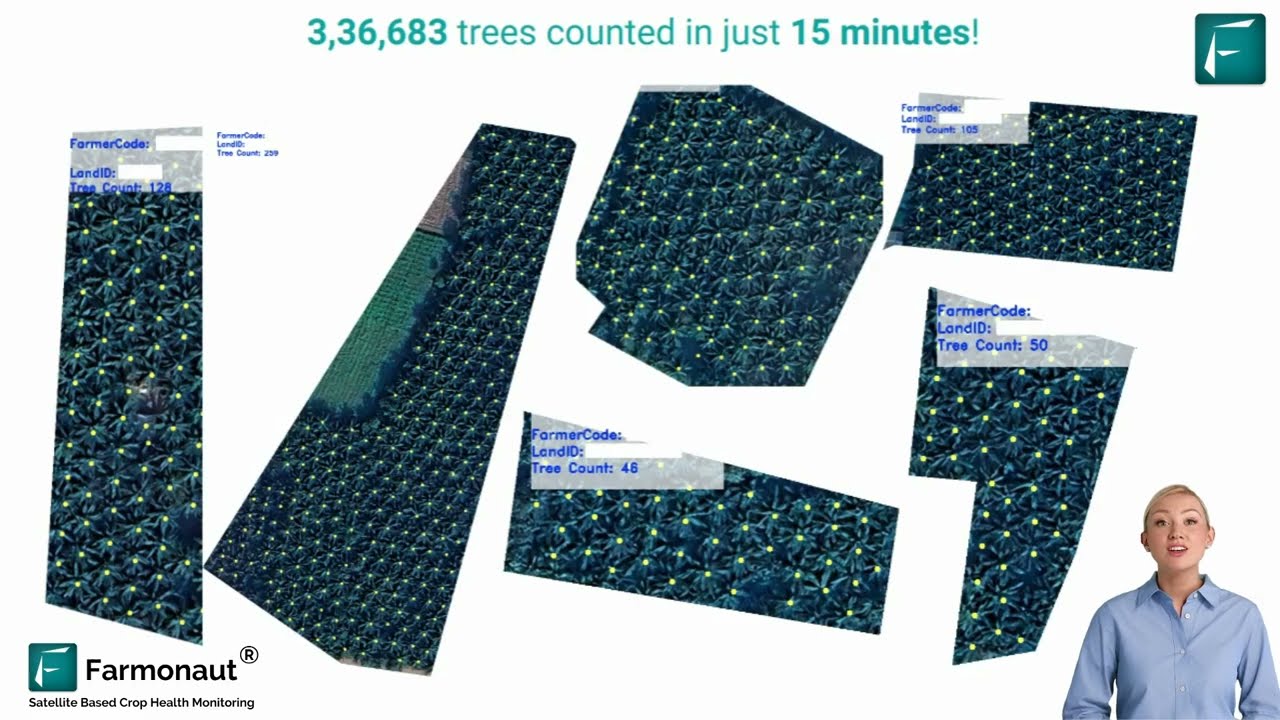
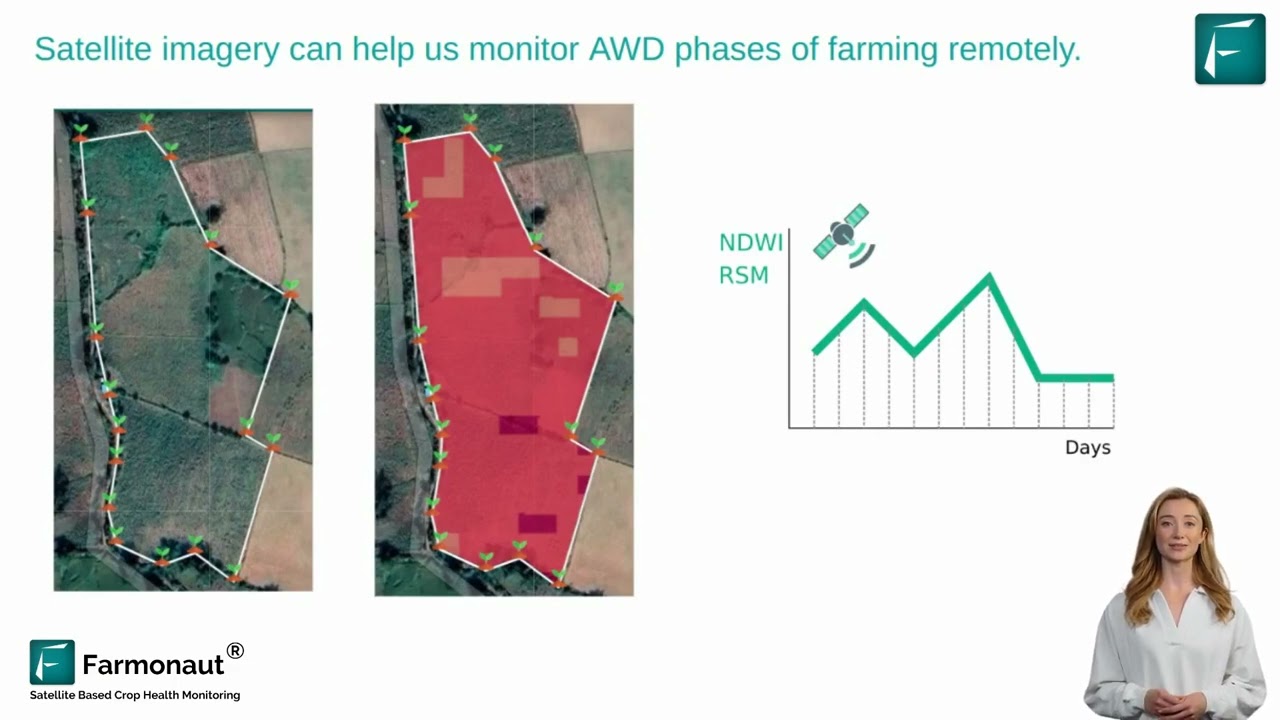
- Track survival, canopy growth, and carbon accumulation with satellite monitoring and field audits at consistent intervals — year 1, year 3, year 5 is a defensible minimum.
- Farmonaut’s carbon footprinting service quantifies the emissions actually reduced, rather than the emissions a planting plan assumed it would reduce.
-
Verify with partners and traceability, not self-reporting.
- Bring in technical partners — universities, extension services, or a digital monitoring platform — to check claims against outside data.
- Traceability solutions can log every stage of a reforestation or reclamation project so an ESG claim has a record behind it, not just a photo.
What Makes a Project “ESG-Compliant”
There is no single global certificate that stamps a planting project “ESG-compliant” — that phrase describes a set of practices, not a badge. In practice, reviewers and auditors look for four things: additionality (the trees would not have been planted without the program), a documented survival check at a stated interval rather than a one-time planting photo, independent verification — satellite imagery, a field audit, or a third party, not just the planter’s own count — and a reporting cadence tied to a named framework the organization already uses for its other ESG disclosures. A project that can answer all four questions in writing is what auditors mean when they say a tree-planting project is ESG-compliant; a tree count with no method behind it is not.

Which Standards Apply to ESG Tree Planting
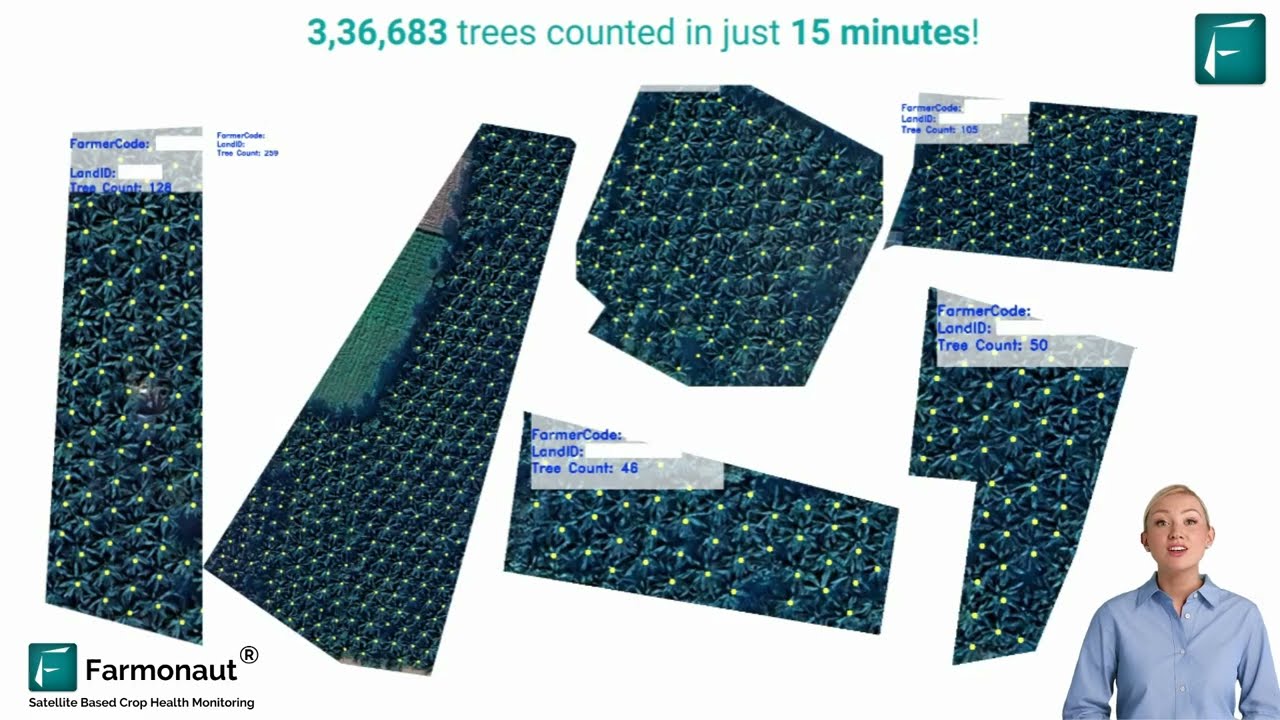
An ESG tree-planting claim usually has to satisfy one of three rulebooks, depending on what the company wants to say about its trees.
| If the claim is… | Rulebook | What it asks for |
|---|---|---|
| Removals in the company’s own greenhouse-gas inventory | GHG Protocol Land Sector and Removals Standard | Published 30 January 2026, effective 1 January 2027. Covers land management, land-use change and CO₂ removals stored in land carbon pools. |
| Carbon credits sold or retired from planting | Verra VM0047 (ARR) | Version 1.1 effective 14 May 2025. Area-based projects measure cover change with remote sensing plus ground plots against matched control plots. A census-based option covers urban forestry, agroforestry and shelterbelts. |
| Reclamation of US coal-mined land | SMCRA, 30 U.S.C. §1265 | A diverse, effective and permanent vegetative cover native to the area. The operator stays responsible for 5 years, or 10 years where average annual rainfall is 26 inches or less. |
The practical point: pick the rulebook before planting day. It decides what you measure, how often, and against what baseline. A tree count alone meets none of the three.
Strategy Comparison at a Glance
Every one of these five steps serves a different ESG pillar, and each one has a different — and differently sized — body of public data behind it. The table below states plainly where a hard figure exists and where it does not, instead of inventing a range to fill a cell.
| Strategy | Primary ESG Pillar | Documented Data Point | Sector Best Evidenced | How to Verify It |
|---|---|---|---|---|
| Site & species selection | Environmental | Most US forests sequester 1–2 tons of CO2 per acre per year; an intensively managed planted stand can reach about 3.7 tons per acre per year (USDA FIA data via Penn State Extension) | Forestry, mine reclamation | Acres planted × sequestration rate, checked against FIA plot data |
| Community engagement & equity | Social | No single national metric exists for this step | Agriculture, urban forestry | Local hires, acres co-managed, species chosen with community input — tracked in program HR and land-use records |
| Agroforestry / land-management integration | Environmental | 32,717 US farms reported agroforestry in the 2022 Census of Agriculture, up 6% from 30,853 in 2017 (USDA NASS, Table 43) | Agriculture | USDA NASS Census of Agriculture, filed every five years |
| Monitoring & transparent reporting | Governance | US urban trees generate $18.3B/year in documented value: $5.4B air-pollution removal, $5.4B energy, $4.8B carbon, $2.7B avoided emissions (USDA Forest Service) | Corporate, urban, all sectors | Satellite-based canopy assessment repeated on a fixed cadence |
| Partnerships & reclamation innovation | Governance + Environmental | ARRI, the OSMRE-backed coalition on Eastern US coal-mined land, has coordinated volunteer reforestation plantings since 2009 | Mining | OSMRE annual reclamation reporting under SMCRA |

Sector Playbooks: Agriculture, Forestry, Mining, Infrastructure
The five steps above apply everywhere, but the evidence and the constraints differ by sector. Here is what each one looks like on the ground.
1. Agriculture: Agroforestry as the Documented Middle Ground
Agroforestry — trees deliberately combined with crops or livestock — is the one tree-planting practice in US agriculture with a national dataset behind it. The USDA Forest Service’s analysis of the 2022 Census of Agriculture counted 32,717 US farm operations reporting agroforestry, up 6% from 30,853 in 2017. Adoption is uneven: Vermont leads at 7.8% of its farms, followed by Maine at 6.0% and New Hampshire at 5.6%, while Arizona sits lowest at 0.3% and Utah and North Dakota follow at 0.4%. The same analysis found eastern states trending up between census years and western states trending down — a regional split worth checking against before assuming a national average applies to a specific farm.
- Use native fruit and timber species to diversify farm income while adding a tree-planting line to an ESG report.
- Layer in satellite-based monitoring for vegetation and soil-moisture trends — see Farmonaut’s large-scale farm management tools.
- Tree roots also stabilize soil against the erosion that undercuts survival rates on sloped or tilled ground; see our guide to the best methods for preventing soil erosion in agriculture for the mechanics.

2. Forestry: Reforestation Rates That Actually Differ by Management
A forestry-sector tree-planting strategy lives or dies on the sequestration rate it can defend. Per Penn State Extension’s reading of USDA Forest Inventory and Analysis data, most US forests offset about 1 to 2 tons of CO2 per acre per year — a wide gap from the roughly 3.7 tons per acre per year an intensively managed planted stand (the FIA’s Mississippi slash-pine example) can reach. Reporting the low end of that range when a program has actually achieved the high end under-states the result; reporting the high end for an unmanaged stand overstates it. Either mistake fails an audit.
- Plant multiple native species to build heterogeneous stands rather than a single fast-growing monoculture.
- Log chain-of-custody records for every planting so third parties can audit species, site, and date without relying on the planter’s own memory.
- Match the reported sequestration rate to the actual management regime — unmanaged natural regeneration and an intensively managed plantation are not the same claim.
3. Mining: Reclamation Under a Legal Reforestation Framework
Coal mining is the only sector here where revegetation is a federal legal duty: the Surface Mining Control and Reclamation Act requires a diverse, permanent native vegetative cover on reclaimed land. On coal-mined land in the Eastern US, the Appalachian Regional Reforestation Initiative (ARRI) — a coalition formed by the Office of Surface Mining Reclamation and Enforcement in early 2004 — has coordinated volunteer tree-planting projects on mine land since 2009 (OSMRE), moving from small donated-tree events to larger projects backed by grants, utility carbon-credit funding, and corporate sponsorship.
- Target open pits, spoil heaps, and access roads for restoration using hardy native species matched to the site’s specific spoil chemistry.
- Monitor reclaimed zones with satellite technology and AI analytics rather than periodic site visits alone; see sustainable land strategies for mining and agriculture for the operational detail.
- Document every planting against the reclamation permit’s bond-release conditions — SMCRA compliance is the actual ESG proof point here, not a general sustainability claim.
4. Infrastructure: Trees as a Measured Cooling Asset
In infrastructure and urban projects, the case for tree planting is a temperature and energy number, not an aesthetic one. Per the EPA figures above, urban forests run about 3.0°F cooler on average than non-green areas, and nearby green infrastructure cuts building energy use by around 10%. At scale, that compounds: the EPA puts the payoff of a 10% increase in tree cover at roughly 50 fewer deaths a year in a mid-sized metro like Salt Lake City and about 3,800 fewer in a dense one like New York City.
- Prioritize public spaces, roadways, and parking areas for canopy, since paved surfaces drive the largest local temperature swing.
- Combine trees with green roofs and living walls in built environments where ground-level planting space is limited.
- Feed remote-sensing canopy data directly into the corporate ESG disclosure rather than reporting tree counts alone.

Measuring Progress and the Offset Calculator
The clearest sign that agroforestry is moving from pilot to mainstream in US agriculture is the national trend line itself: farm operations reporting agroforestry rose from 30,853 in the 2017 Census of Agriculture to 32,717 in 2022, a 6% increase over the five-year gap between census cycles. That is the durable number to track — the Census of Agriculture is refiled every five years, so the next data point supersedes this one on its own schedule rather than going stale silently.
For a single program, the more useful question is not the national trend but a program’s own numbers: how many of the trees planted are still alive, how many acres that represents, and what that acreage should sequester once established. The calculator below runs that arithmetic using the same per-acre sequestration range cited above — put in your own planting plan, not ours.
ESG Tree-Planting Survival & Carbon Offset Calculator
Assumes the 1–2 tons CO2/acre/year range documented for typical US forests (USDA FIA data via Penn State Extension) and applies once the surviving trees have reached the planting density’s expected canopy — it excludes site prep, replanting, and land cost, and it does not apply to single ornamental or urban street trees planted below forest density.
Tools for Verification and Logistics
Whichever sector a program sits in, the governance step — proving the trees are there and staying there — is where most ESG tree-planting claims fail. A short set of tools covers most of that gap:
- API access: pull satellite and weather data directly into monitoring workflows via Farmonaut’s API and its developer documentation.
- Fleet and logistics: coordinate vehicles and crews for large planting or reclamation programs with fleet management tracking.
- Supply-chain traceability: verify the lifecycle of forestry, reforestation, or agroforestry products with product traceability records.
- Financing verification: reduce risk on agricultural financing tied to planting or afforestation with crop loan and insurance verification.



FAQ: ESG Tree Planting Strategy
-
What is an ESG tree planting strategy?
It is a documented plan linking site selection, species choice, community involvement, and a fixed monitoring schedule to a measurable environmental, social, or governance outcome — with a reporting method that can prove the outcome happened, not just describe it.
-
What makes a tree-planting project ESG-compliant?
Four things: additionality (the trees would not exist without the program), a documented survival check at a stated interval, independent verification such as satellite imagery or a field audit, and a reporting cadence tied to a framework the organization already discloses against.
-
How is a CSR tree-planting strategy different from an ESG one?
In practice the two overlap heavily. CSR framing tends to emphasize community and brand — local jobs, volunteer days, stakeholder goodwill — while ESG framing emphasizes the measurable pillar (carbon sequestered, biodiversity change, governance of the reporting itself). A strong program satisfies both by measuring the same trees the same way regardless of which label leads the report.
-
What’s a good tree-planting strategy for Earth Day or Earth Month?
Use the date as a launch or reporting milestone, not the entire program. Pick a site with a documented constraint (erosion, degraded reclamation land, low canopy), commit to the year-1/year-3/year-5 survival checks in writing before planting day, and publish the prior year’s survival number alongside the new pledge — that combination is what separates a strategy from a one-day event.
-
What counts as “strategic” tree planting versus planting trees at random?
Strategic planting starts from the constraint the land actually has — wind erosion, urban heat, mine spoil, low agroforestry adoption in that state — and picks species and sites to address it, then checks survival against a target. Random planting starts from a tree-count goal and works backward, which is why it produces poor survival data and little defensible ESG reporting.
-
How do companies report tree planting under ESG or “tree ESG” disclosures?
Most report against whichever sustainability framework they already use for other disclosures, adding tree-specific line items: acres planted, survival rate at the last check, and estimated carbon sequestered using a documented per-acre rate rather than an assumed one. Satellite-based canopy assessment repeated on a fixed schedule is one widely used verification method; Verra’s VM0047 pairs remote sensing with ground plots.
-
How can organizations track and verify tree-planting results?
Combine satellite imagery, periodic field audits, and a fixed reporting interval. Farmonaut’s API and developer documentation let this run inside an existing monitoring workflow rather than as a separate manual process.





Conclusion: A Strategy Outlasts the Campaign Date
Earth Day and Earth Month are the right moments to launch or renew a tree-planting commitment, but the five steps that make it defensible — site match, community equity, land-management integration, fixed-interval monitoring, and independent verification — run on their own calendar, not the campaign’s. The data points in this piece will move: the next Census of Agriculture will be taken for 2027, and USDA Forest Service urban-forest valuations and OSMRE’s ARRI pages are updated from time to time. Check those sources directly before citing a figure from this page as current.
Take the lead in your sector — whether it’s agriculture, mining, forestry, or infrastructure — and build the tree-planting strategy so the numbers, not the press release, carry the ESG claim.
Discussion
Questions, corrections or field experience? Share them below. First-time comments are reviewed before they appear, and your email is never published.
No comments yet. Be the first to add a question or your experience.

 Geno
Geno Godrej Agrovet
 Hayleys Agriculture
 Linx Agritech
 Adinet
 Save Your Soils
 Grandstream Algérie
 XOS Realty
 Geospatial Lab Africa
 Agro La Gándara
 HIPSAC
 ZOL Zimbabwe
 Juligerm
 AdBio
AdBio MISE Maroc
 NWNS
NWNS Red August Group
 Farm Inc
 WeMe Global
 Licence holder · Niger · Gold










