
Cotton · Canada climate check
Cotton Production in Canada: Why It Is Zero, in Heat Data
Canada has 0 hectares of cotton in USDA’s 2026/27 tables. Windsor, Ontario, gets about 1,490 Fahrenheit degree-days a year (1981-2010 normals), against the 2,200 to 2,600 the crop needs in the US Mid-South.
Key takeaways
- USDA lists Canada at 0 hectares and 0 bales of cotton for 2026/27, with raw cotton use of about 1,000 bales.
- Heat is the main limit in the warmest areas: Windsor has about 1,490 Fahrenheit degree-days (1981-2010 normals), and the crop needs 2,200 to 2,600 in the US Mid-South (National Cotton Council).
- Season length is not the barrier in southwest Ontario: Windsor averages 195 days between frosts (1981-2010 normals), against the 130 to 160 days needed.
- Reinhart, a cotton merchant dating to 1788, worked on satellite crop estimates across 22 districts outside North America.
In this article
- Does Canada grow cotton?
- Why cotton production in Canada is limited by heat
- The gap shows up month by month
- Can you grow cotton in Ontario?
- British Columbia and the Prairies
- Where the northern edge of US cotton sits
- Check your own site for cotton heat
- The Reinhart cotton project
- What Canadian growers can do instead
- FAQ
Cotton production in Canada is effectively zero. USDA’s cotton supply tables list Canada with 0 harvested hectares and 0 bales for the 2026/27 season, and cotton is not among the crops in Statistics Canada’s principal field crops table. In Canada’s warmest farming areas, the main barrier is summer heat, not winter cold or the length of the season.
This page shows the numbers behind that answer. It compares heat and frost records from Canadian weather stations with what the crop needs, and it has a calculator you can run with your own station data. It also covers the Reinhart cotton project that this page first reported.
Does Canada grow cotton?
Not as a commercial crop. USDA shows Canada at 0 hectares and 0 bales. It also shows that Canada uses very little raw cotton: about 1,000 480-lb bales of imports and use in 2026/27, and 2,000 bales in 2025/26. These tables are rounded estimates, so read them as “very small” and not as an exact count.
For scale, USDA’s October production report puts 2026/27 output at 33.5 million bales in China, 19.0 million in Brazil, 13.44 million in the United States and 3.0 million in Australia. These are selected producers, not a ranking.
Canadian farms do grow other agricultural products at scale. Statistics Canada reports these seeded areas and production figures for 2025:
| Crop | Seeded area, 2025 | Production, 2025 |
|---|---|---|
| Corn for grain | 1,530,700 ha | 14,867,256 t |
| Flaxseed | 250,900 ha | 454,461 t |
| Hemp | 15,500 ha | 17,901 t |
| Cotton | Not listed | Not listed |
Why cotton production in Canada is limited by heat
Growers count cotton heat in DD60s. For each day, take the average of the high and low in Fahrenheit, then subtract 60. The National Cotton Council’s growth and development guide gives 2,200 to 2,600 DD60s and 130 to 160 days from planting to harvest-ready cotton in the Mid-South of the US.
Canada’s weather service publishes degree-days above 15 °C. That base is 59 °F, close to the 60 °F base. Multiply by 1.8 to turn Celsius degree-days into Fahrenheit ones. The result flatters Canadian stations by up to one degree-day for each warm day, because the base is one degree lower.
Windsor, Ontario, one of the warmer stations we checked, has 828 degree-days above 15 °C in the 1981-2010 normals. That is about 1,490 in Fahrenheit terms, or two-thirds of the low end of the cotton range. Toronto Pearson has 611, or about 1,100. Winnipeg has 422, or about 760.
The US side of the border tells the same story. Detroit’s airport, a short drive from Windsor, has 1,469 DD60s a year in NOAA’s 1991-2020 normals. Memphis, in the Mid-South cotton belt, has 3,309.
Chart
Yearly cotton heat at selected stations
Fahrenheit degree-days; DD60 for US stations, above 15 °C × 1.8 for Canadian stations
The gap shows up month by month
Detroit gets fewer DD60s than Memphis in each main growing month. Detroit’s monthly normals peak at 435 in July, while Memphis reaches 705. A plant that opens its first flower late then has too little warm weather to finish its bolls: the guide gives 850 to 950 DD60s from flower to open boll.
Chart
Monthly cotton heat: Detroit vs Memphis
DD60 per month, 1991-2020 normals; Detroit stands in for nearby Windsor
Can you grow cotton in Ontario?
You can raise a plant in a warm garden or greenhouse. A commercial field crop is a different question, and the normals do not support one in Ontario. A warm site near Windsor would still sit well under the range above in an average year.
Season length is the smaller problem in southwest Ontario. Windsor averages 195 days between its last spring frost and first fall frost, more than the 130 to 160 days in the guide. Toronto Pearson averages 168. So a long season exists there, but it is not hot enough. Further north and west, both limits apply: Winnipeg averages 121 days.
Hobby growers can start seed indoors and use the warmest wall or a greenhouse. Expect a learning project, not a fibre yield. Before planning a commercial trial, get advice from your provincial agriculture office and check local rules on seed.
Chart
Average days between last and first frost
Selected Canadian stations, 1981-2010 normals (Osoyoos West and Kelowna have shorter records); the crop needs 130 to 160 days in the US Mid-South
British Columbia and the Prairies
The hot interior of BC is a natural place to check. Osoyoos West, in the south Okanagan, has 650 degree-days above 15 °C and 169 days between frosts. That is about 1,170 in Fahrenheit terms, under Windsor. Kelowna has 387 and 140 days. These normals cover specific stations and past decades, and the frost averages rest on short records (15 years at Osoyoos West, 20 at Kelowna), so treat them as rough. A sheltered site may differ.
Where the northern edge of US cotton sits
Cotton states on the northern side of the US belt show how much heat the crop has when it is grown commercially. USDA NASS’s October Crop Production report forecasts upland cotton harvests in Missouri, Virginia and Kansas, along with Tennessee and North Carolina. Cape Girardeau in southeast Missouri has 2,391 DD60s, and Norfolk in Virginia has 2,793. Both clear the low end of the range. For more on the crop’s needs, see our guide to cotton climate requirements.
Chart
Upland cotton harvested in northern US states
Thousand acres, 2025 and October 2026 forecast
Warmer summers would change these numbers, but the normals above do not show any Canadian station we checked near 2,200. Check newer data for your own site with the calculator below.
Check your own site for cotton heat
Look up your nearest station in the Canadian Climate Normals, then enter its “degree-days above 15 °C” and its “length of frost-free period”. The defaults are examples only.
Try the numbers for your own farm below.
Calculator
Does your site have enough heat for cotton?
Enter your nearest station’s normals and your target numbers.
- Heat at your station: 2,160 F-days
- Heat above or below the need: -40 F-days
- Spare days in the season: 5 days
Example values only, not a benchmark or a forecast. The 1.8 factor converts Celsius degree-days to Fahrenheit; the 15 °C base is one degree below the 60 °F base, so results run high by up to one degree-day for each warm day. The 2,200 DD60 and 145-day defaults sit within the Mid-South ranges in the National Cotton Council guide; your variety may differ.
The Reinhart cotton project
Some searches that reach this page are for Reinhart cotton. Reinhart is a global merchant that has served customers since 1788, trading cotton and other farm products. Its work with Farmonaut took place outside North America, across 22 cotton-growing districts, and had no link to Canadian farms.
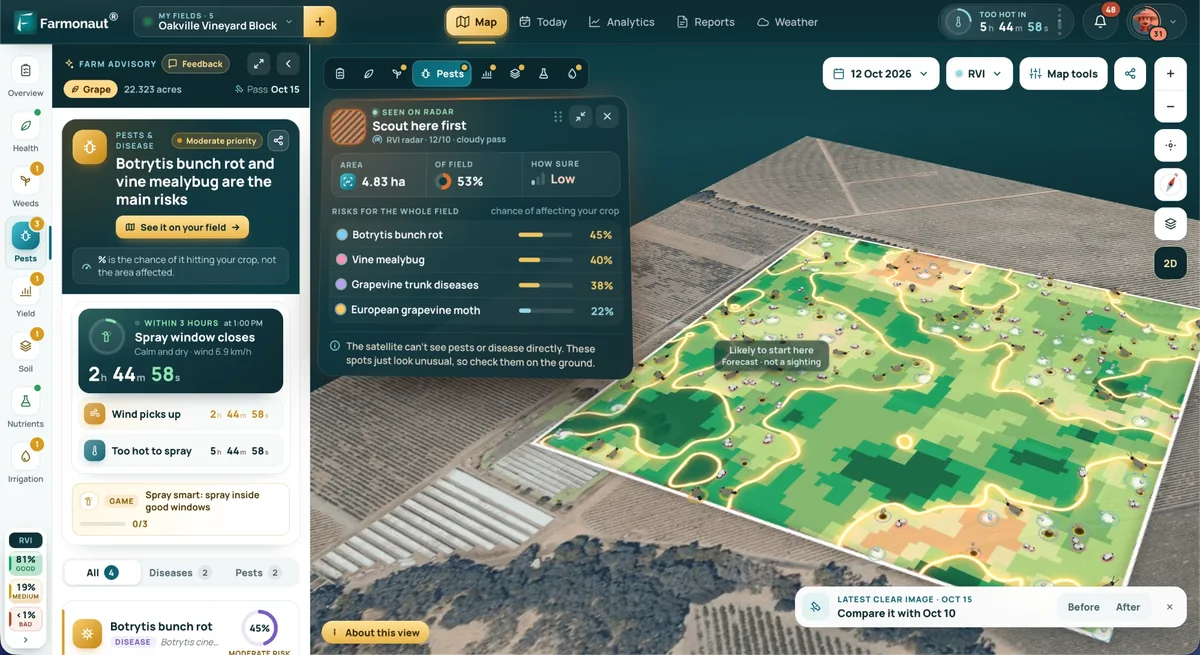
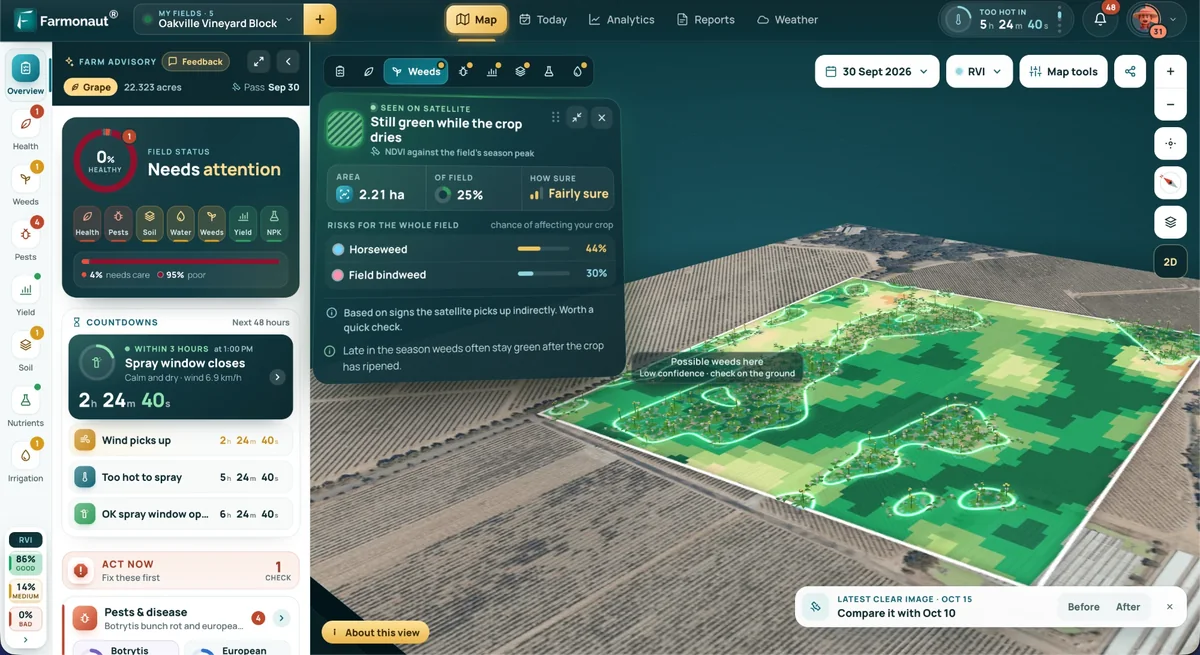
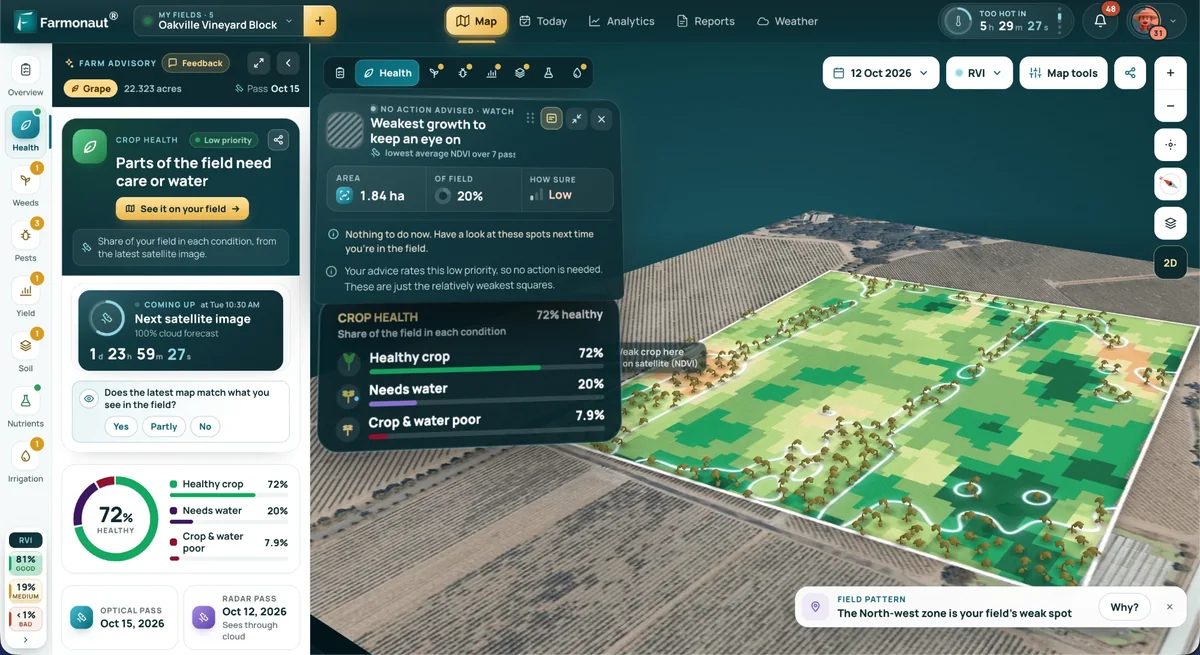
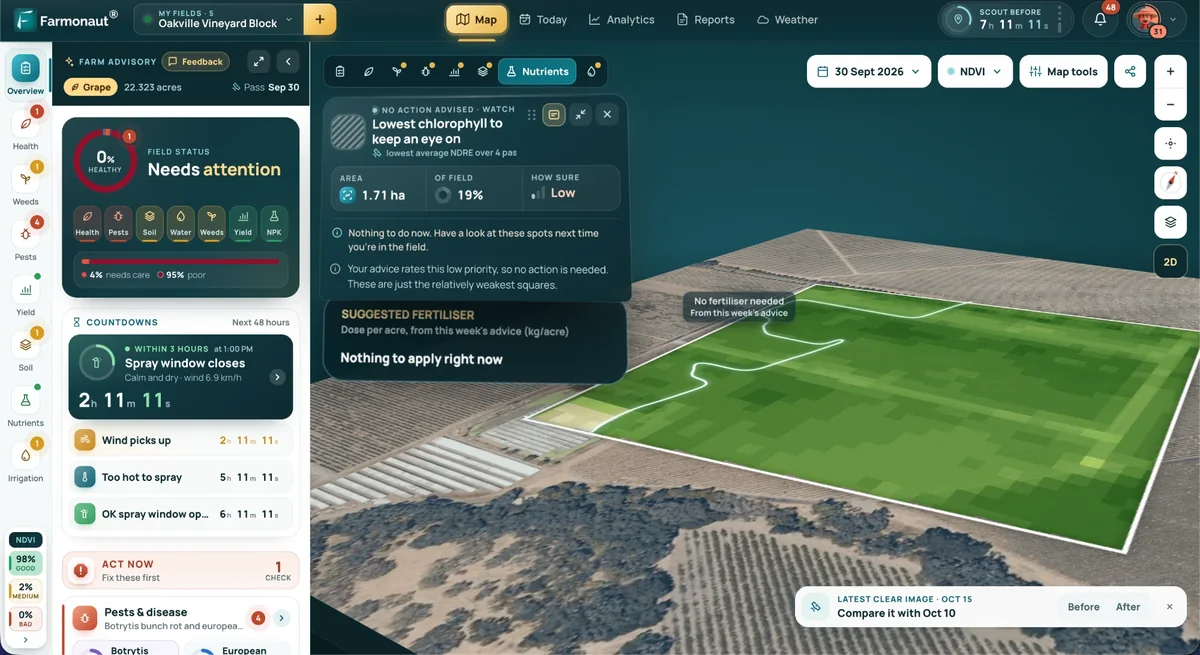
Satellite data was used to estimate cotton acreage and yield and to flag crop stress during the season. Reinhart’s feedback covered four points:
- Accurate data: accuracy above 90% compared with government and other sources.
- Timely alerts: warnings about crop stress and its likely effect on production.
- Useful comparisons: side-by-side views against the previous year.
- Positive feedback: overall satisfaction with the information provided.
Why a merchant wants this data
A cotton merchant buys and sells before the crop is in. Early estimates of acreage and yield help with three plans:
- Buying: how much cotton a region is likely to offer.
- Logistics: when to book storage and transport.
- Risk: which areas show stress compared with last season.
Satellites show changes in plant growth. They do not name the cause, so field checks still matter.
▶ How satellite data and AI help cotton growers monitor their crops. · 9:57
What Canadian growers can do instead
Readers searching for a natural fibre crop have nearer options. Flaxseed and hemp both appear in the Statistics Canada table above. The flaxseed line measures seed, and the hemp line does not say which part of the crop it counts, so check the buyer and end use before planning around fibre.
The same field-scale habits apply to any crop. Sound agricultural practices, a crop suited to your heat units and regular scouting will do more than chasing a crop your climate cannot finish. Farmonaut’s satellite crop maps can help you spot uneven growth across fields, whatever you grow.
Related pages on our site: cotton farming with field sensors.
▶ An overview of precision agriculture and AI in field crops. · 23:42
FAQ
Is cotton grown in Canada?
Not commercially. USDA lists Canada at 0 hectares and 0 bales for 2026/27.
Why can’t cotton grow in Canada?
The plant can grow, but the summers we checked are too cool to mature a crop. Windsor reaches about 1,490 Fahrenheit degree-days against the 2,200 to 2,600 given for the US Mid-South.
Can you grow cotton in Ontario at home?
Yes, as a garden or greenhouse plant, with seed started indoors. Do not count on a harvest of fibre.
Where does Canada get its cotton?
Canada grows none, so any raw cotton it uses is imported. USDA estimates that use at about 1,000 to 2,000 bales a year.
What is Reinhart in cotton?
Reinhart is a global merchant in cotton and other farm products that dates back to 1788. It is not a Canadian grower.
Farmonaut crop monitoring
See your own fields from space
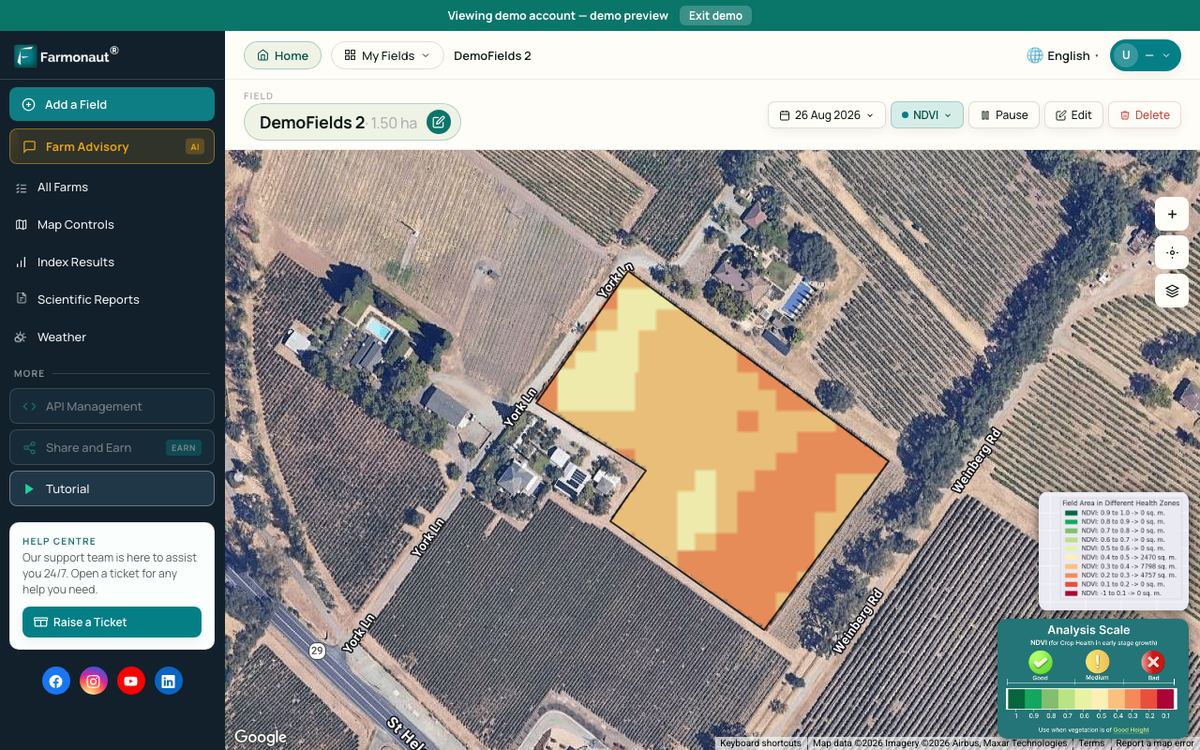
Draw your fields once and Farmonaut shows satellite vegetation maps for them through the season, on web, Android or iOS.



Keep reading
Sources
- Statistics Canada, Table 32-10-0359, principal field crops (2025 data): www150.statcan.gc.ca
- USDA FAS, Cotton: World Markets and Trade, supply tables (October 2026): apps.fas.usda.gov
- USDA FAS, World Agricultural Production (October 2026): apps.fas.usda.gov
- National Cotton Council, Growth and Development of a Cotton Plant: cotton.org
- USDA NASS, Crop Production (October 2026): release.nass.usda.gov
- Reinhart, company website: reinhart.com
- Environment and Climate Change Canada, Climate Normals 1981-2010, Windsor A: api.weather.gc.ca
- Environment and Climate Change Canada, Climate Normals 1981-2010, Toronto Pearson: api.weather.gc.ca
- Environment and Climate Change Canada, Climate Normals 1981-2010, Winnipeg Richardson: api.weather.gc.ca
- Environment and Climate Change Canada, Climate Normals 1981-2010, Osoyoos West: api.weather.gc.ca
- Environment and Climate Change Canada, Climate Normals 1981-2010, Kelowna A: api.weather.gc.ca
- NOAA NCEI, US Climate Normals 1991-2020, annual, Detroit: ncei.noaa.gov
- NOAA NCEI, US Climate Normals 1991-2020, annual, Memphis: ncei.noaa.gov
- NOAA NCEI, US Climate Normals 1991-2020, annual, Cape Girardeau: ncei.noaa.gov
- NOAA NCEI, US Climate Normals 1991-2020, annual, Norfolk: ncei.noaa.gov
- NOAA NCEI, US Climate Normals 1991-2020, annual, Lubbock: ncei.noaa.gov
- NOAA NCEI, US Climate Normals 1991-2020, monthly, Detroit: ncei.noaa.gov
- NOAA NCEI, US Climate Normals 1991-2020, monthly, Memphis: ncei.noaa.gov
Discussion
Questions, corrections or field experience? Share them below. First-time comments are reviewed before they appear, and your email is never published.
No comments yet. Be the first to add a question or your experience.

 Pulsar Supernova
 Magrifly
 LatConnect 60
 Disease Free Life
 WebsEdge
 Blickwinkel
 Agricultural Credit Policy Council
 BayWa
 MCSOD
 Marei Nursery
 eKGIS
 Mostas Tech
 Andex
 FCF India
 Unifrutti Gulf
 Deluxe Conseil
 WICO
 Chimera Innovation

 Licence holder · Niger · Gold
 Licence holder · Nigeria · Gold + lithium
 Client · Tanzania · Gold
 Client · Somalia · Gold
 Client & affiliate partner · Ghana · Gold