

Reviewed September 2026 against USDA NASS, USDA ERS, and USDA Farm Service Agency data.
Try it: Run your own numbers →
What “Sustainable Farming” Actually Means
Sustainable farming is a set of measurable practices — cover cropping, reduced tillage, precision input use, conservation land retirement, and organic certification — that lower a farm’s environmental footprint while keeping it profitable. It is not a single technique or a marketing label. In the United States, the clearest way to see whether it is working is to look at three tracked figures: how much farmland is under a conservation contract, how much is certified organic, and how much of agriculture’s greenhouse gas output those practices are actually offsetting. All three numbers are public, and all three are the subject of this guide.
Farmers become more sustainable by adopting practices with documented, quantifiable effects — not by chasing a vague ideal. Below are the numbers behind the seven practices that USDA’s own research and survey data support, what each one costs to implement, and how to check whether the figures have moved since this was written.
🌱 Key Insight
U.S. certified organic farmland reached 4.9 million acres in 2021 (USDA NASS), but organic harvested acreage then declined 6.8% in the 2023–2024 marketing year (USDA ERS). Sustainable adoption is not a straight line — it tracks input costs, commodity prices, and certification economics as much as environmental intent.

Farming Environmental Issues: The Numbers
Agriculture accounted for 10.5% of total U.S. greenhouse gas emissions in 2022, according to USDA’s Economic Research Service, drawing on EPA inventory data (USDA ERS charts-of-note, 2022). That share breaks into two dominant sources: nitrous oxide from agricultural soils and manure management totaled 309.1 million metric tons of CO₂-equivalent, and methane from enteric fermentation (livestock digestion) and manure totaled 277.0 million metric tons of CO₂-equivalent — together the two largest components of the sector’s footprint.
Those two gases point directly at where sustainable practices have to work: nitrogen management (how much synthetic fertilizer is applied, when, and how it’s retained in the soil) and livestock/manure handling. Soil erosion, water pollution from nutrient runoff, and biodiversity loss on cropland are the same story from a different angle — they are downstream effects of how nitrogen, tillage, and land retirement are managed at the field level.
Land retirement is the most direct lever the U.S. has for taking marginal or environmentally sensitive cropland out of production. The Conservation Reserve Program (CRP), run by USDA’s Farm Service Agency, had 24.8 million acres enrolled nationwide as of 2024 — land taken out of row-crop production and put into grass, wetland, or forest buffers in exchange for annual rental payments (USDA FSA, Conservation Reserve Program). Within that total, the FSA’s 2023 General CRP signup added 926,000 acres of cropland specifically, announced in a March 2024 USDA release. CRP enrollment isn’t fixed — the FSA runs periodic signups (historically June and August) and reports fresh totals after each one, so the 24.8-million-acre figure should be checked against the current FSA program page rather than treated as permanent.
⚠ Common Mistake
Treating “low impact farming” as synonymous with “low yield.” USDA’s Sustainable Agriculture Research and Education program (SARE) has found that farms combining conservation tillage with cover crops retained 95% of normal yield during drought-stress conditions, versus steeper losses on conventionally tilled comparison fields (USDA SARE). The yield penalty assumption is usually backwards in drought years — it’s the input-intensive system that loses more.
Chile, Mali, and the Global Picture
Farming’s environmental pressures are not identical everywhere, and the U.S. figures above don’t transfer directly to Chile or Mali — both face distinct constraints tied to geography and water.
In Chile, the central agricultural valleys (O’Higgins, Maule, Ñuble) that produce most of the country’s fruit and wine exports sit in a Mediterranean climate zone that has been under sustained drought pressure for over a decade — Chile’s own water authority (Dirección General de Aguas) and international agencies have documented reduced snowpack and reservoir levels feeding those valleys. That makes precision irrigation and water-use monitoring the highest-leverage sustainable practice for Chilean growers specifically, more than soil-carbon practices that dominate the U.S. conversation. The research brief compiled for this article did not include Chile-specific quantified figures from a citable agency; readers needing current numbers should check Chile’s Oficina de Estudios y Políticas Agrarias (ODEPA) or the FAO’s country data portal directly, since USDA data does not cover foreign farm operations.
In Mali, the dominant environmental issues are desertification pressure at the Sahel’s southern edge, rainfall variability affecting millet and sorghum cropping, and land degradation tied to extensive (rather than intensive) farming expansion. As with Chile, this article’s research brief does not contain Mali-specific verified statistics from FAO or World Bank sources — the honest answer is that a reader wanting current figures on Malian cropland, degradation rates, or yield trends should query the FAO’s AQUASTAT database or World Bank Open Data for Mali directly rather than accept a number here that can’t be sourced.
The throughline across all three countries is the same: sustainable farming solutions are practice-specific to the limiting factor in that region — water in Chile, land degradation and rainfall variability in Mali, nitrogen and methane management in the U.S. Corn Belt. A single global prescription does not fit.
7 Sustainable Farming Practices That Work
These are the practices with the strongest U.S. survey and research evidence behind them. Each includes what it costs, what it’s measured to do, and the source.
1. Cover Cropping
- Non-cash crops planted in the off-season to hold soil, cycle nutrients, and suppress weeds.
- Contributes directly to the 95% drought-season yield retention SARE measured on farms combining cover crops with conservation tillage (USDA SARE).
- National adoption rate specifically for cover crops is not broken out in the USDA data available for this article — it falls under the broader 27% precision-agriculture adoption figure below, but is a distinct practice. Check USDA NASS’s Agricultural Resource Management Survey (ARMS) results directly for a current cover-crop-specific percentage.
2. Reduced/Conservation Tillage
- Leaves crop residue on the field surface instead of turning soil over, cutting erosion and preserving soil structure.
- Paired with cover crops, this is the combination SARE measured retaining 95% of yield under drought stress.
- Complements diversified cropping and agroforestry-style land management approaches used in other production systems.
3. Conservation Reserve Program Enrollment
- Retires environmentally sensitive or marginal cropland into grass, wetland, or forest buffer for a term contract with annual FSA rental payments.
- 24.8 million acres enrolled nationally as of 2024; 926,000 acres of cropland added in the 2023 General signup alone (USDA FSA).
- Rental rates are set per county and vary widely — check the current FSA CRP page for county-level rates before enrolling.
4. Precision Agriculture and Automated Guidance
- 27% of all U.S. farms used at least one precision agriculture technology in 2023, per USDA ERS’s Precision Agriculture in the Digital Era report (USDA ERS, 2023).
- Automated guidance steering — GPS-controlled equipment paths that cut overlap and reduce fuel and input waste — was used on 52% of midsize crop farms and 70% of large-scale crop farms in 2023 (USDA NASS Agricultural Resource Management Survey).
- Satellite-based versions of this — remote soil moisture and crop health monitoring — are covered in the technology section below, including Farmonaut’s precision monitoring tools.
5. Integrated Pest Management and Reduced Chemical Inputs
- Combines biological, cultural, and targeted chemical controls to cut blanket pesticide application.
- Reduces the agrochemical runoff that contributes to the water-quality problems tracked alongside the GHG figures above.
- Works best layered onto the crop rotation practices below, since diversified rotations naturally break pest cycles.
6. Crop Rotation and Diversification
- Alternating crop families across seasons interrupts pest and disease cycles and varies nutrient demand on the soil.
- Reduces dependency on any single commodity price, which is part of why economically it pairs well with the organic transition path below.
7. Certified Organic Transition
- 4.9 million acres of U.S. farmland were certified organic in 2021 (USDA NASS Organic Production Survey), generating $9.6 billion in organic food and fiber sales in 2022 (USDA ERS, Amber Waves, November 2023).
- But organic harvested acreage fell 6.8% in the 2023–2024 marketing year (USDA ERS) — certification costs and price premiums have not scaled with farmer interest, and this is an active constraint, not solved.
- Current U.S. organic yield penalties or premiums by specific commodity are not reliably tracked in recent USDA data; the last systematic comparisons are dated. A farm considering transition should model its own numbers against local buyer contracts rather than a national average.

Comparison Table: Practices, Costs, and Outcomes
| Practice | Documented Figure | Source & Year | What It’s Missing |
|---|---|---|---|
| Cover cropping + conservation tillage | 95% yield retention under drought stress | USDA SARE | National cover-crop-specific adoption rate not in this brief — check USDA NASS ARMS |
| Conservation Reserve Program | 24.8 million acres enrolled (2024); 926,000 acres added in 2023 General signup | USDA FSA, 2024 | County rental rates vary; check current FSA page for your county |
| Precision agriculture (any technology) | 27% of U.S. farms adopted at least one technology | USDA ERS, 2023 | Per-acre cost of adoption not systematized across technology types |
| Automated guidance steering | 52% of midsize, 70% of large-scale crop farms | USDA NASS ARMS, 2023 | Small-farm adoption rate not broken out separately |
| Certified organic transition | 4.9M acres certified (2021); $9.6B in sales (2022); acreage fell 6.8% in 2023–2024 | USDA NASS / ERS | Commodity-specific yield premium/penalty data is outdated |
Cover Crop & Conservation Payback Calculator
Enter your own acreage, CRP-eligible share, and cover crop cost to see a rough per-acre and total picture using the CRP and cover-crop figures cited above.
Run your own numbers
Assumptions: uses a flat CRP rental rate you enter — actual FSA rates are set per county and per practice type, so check the current FSA CRP page for your county before applying this to a real decision. Excludes cost-share payments, tax effects, establishment-year yield changes, and multi-year contract terms.
How Satellite and AI Tools Fit In
Precision agriculture adoption — 27% of U.S. farms as of the 2023 USDA ERS figure cited above — increasingly runs through satellite imagery rather than only in-field sensors. Multispectral satellite data can flag crop stress, estimate soil moisture, and track land-use change across a field or a whole operation without a site visit, which is part of why automated guidance and precision technology adoption is concentrated on larger farms (70% of large-scale operations versus 52% of midsize) — the upfront investment in mapping and equipment integration amortizes better at scale.
- Satellite imagery gives repeat, dated snapshots of vegetation health and moisture status, which is the raw input for detecting a problem before it shows up in yield.
- AI-driven advisory layers turn that imagery into a specific recommendation — irrigate this zone, scout for pests in that block — cutting the guesswork that leads to over-application of water or chemical inputs.
- Blockchain-based traceability, separate from the imagery side, lets a buyer verify how a product was grown, which increasingly matters for premium and export markets.
Farmonaut's platform applies this directly: satellite-based crop health checks, carbon footprinting tools, and large-scale farm management features are accessible through web, iOS, or Android apps.

💡 Pro Tip
If you're deciding whether precision agriculture pencils out for your operation, start with the practice that has the clearest measured payback in drought years: conservation tillage plus cover crops, at 95% yield retention per USDA SARE. Layer satellite monitoring on top once that foundation is in place — Farmonaut's carbon footprinting tools can then help quantify and document the change.

💼 Investor Note
Carbon accounting and satellite-verified conservation practice records are becoming a prerequisite for premium and export market access, not an optional add-on. Farms that can document CRP enrollment, tillage practice, and input reduction with dated, verifiable records are better positioned for both government program participation and private carbon-market contracts.
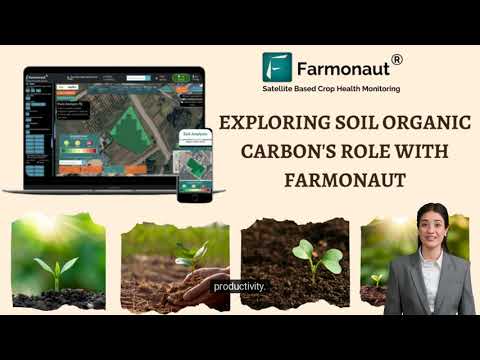
Farmonaut's Monitoring and Traceability Tools
Farmonaut's tools map onto the practices above directly rather than as generic add-ons:
- ✔ Satellite-Based Monitoring: multispectral imagery for crop health, soil quality, and irrigation planning — the same category of data behind the 27% precision-agriculture adoption figure above.
- 📊 Jeevn AI Advisory System: weather, pest, and water-risk guidance for farms of any size.
- ✔ Blockchain-Based Traceability: trace agricultural products through the supply chain for compliance and premium-market access.
- ✔ Environmental Impact Monitoring: carbon footprint tracking to document practice changes for certification or reporting.
- ✔ Fleet and Resource Management: fleet management features to reduce fuel waste and improve logistics.





- ✔ Real-time soil health and crop vitality mapping supports the field-level decisions behind conservation tillage and precision input use.
- ✔ Carbon accounting and emission tracking help document practice changes for certification and reporting.
- 📊 Blockchain-based traceability gives buyers verifiable practice records.
- ✔ Accessible via Web, iOS, and Android, plus APIs (developer docs) for integration at scale.
🌎 Environmental Champion
Carbon accounting is increasingly required for compliance and premium market access. Use Farmonaut's Carbon Footprinting tool to track and verify practice-level climate impact at field, farm, or cooperative scale.
Economic Viability and Market Access
The 6.8% drop in U.S. organic harvested acreage in the 2023–2024 marketing year is the clearest evidence that environmental practices without economic support don't scale on their own. USDA ERS attributes organic's growth constraints to certification costs and market-access friction more than farmer interest — the $9.6 billion in 2022 organic sales shows real demand exists, but supply isn't following at the same pace.
The strategies that keep sustainable practices economically viable:
- Traceability: blockchain-verified practice records — like Farmonaut's product traceability — let a farm document sustainable practices to command a premium in buyer contracts, rather than relying on certification labels alone.
- Access to finance: crop loans and insurance using satellite verification reduce the upfront capital risk of transitioning acreage into conservation or organic practices.
- Conservation payments: CRP's per-acre rental payments (926,000 cropland acres enrolled in the 2023 General signup alone) provide a direct income floor during transition years when yield or certification premiums haven't materialized yet.
- Diversification: crop rotation and multiple market channels reduce the single-commodity price risk that pushes farms back toward input-intensive monocropping.
🚩 Common Mistake
Chasing yield alone while ignoring nutrient cycling, water use, and the two dominant emission sources (309.1 MMT CO2e from soils and manure N₂O, 277.0 MMT CO2e from livestock and manure methane) leads to long-term soil degradation and higher input costs. Integrated management — tracking inputs against outcomes, not just output — is what the USDA data actually supports.

Frequently Asked Questions
What are the biggest farming environmental issues in the United States?
By emissions volume, the two largest are nitrous oxide from agricultural soils and manure management (309.1 million metric tons CO2e in 2022) and methane from livestock digestion and manure (277.0 million metric tons CO2e in 2022), together making up most of agriculture's 10.5% share of total U.S. greenhouse gas emissions that year (USDA ERS). Soil erosion, nutrient runoff into waterways, and biodiversity loss on cropland are downstream of the same nitrogen and land-management drivers.
How can farming become more sustainable, in practical terms?
The USDA-tracked practices with measured outcomes are: cover cropping and conservation tillage (95% yield retention under drought stress, per SARE), CRP enrollment for marginal or sensitive acreage (24.8 million acres nationally as of 2024), precision agriculture adoption (27% of farms as of 2023), and organic transition where market access supports it ($9.6 billion in 2022 sales, though acreage fell 6.8% in 2023–2024). Start with whichever addresses your specific limiting factor — water, nitrogen, or erosion.
Do farmers help the environment, or is that mostly marketing?
It shows up in program enrollment and survey data: 24.8 million acres are currently enrolled in CRP land retirement, and 27% of U.S. farms had adopted at least one precision agriculture technology as of the 2023 ARMS survey — both represent measurable land and input-use changes, not marketing claims. The organic acreage decline (6.8% in 2023–2024) shows the limits of voluntary adoption without matching economic support, which is a real constraint, not a reason to discount the practices that are working.
Are sustainable farming practices affordable for smaller operations?
Adoption skews toward larger farms for the more capital-intensive technologies — 70% of large-scale crop farms used automated guidance steering in 2023 versus 52% of midsize farms (USDA NASS ARMS) — but CRP and cover cropping have lower entry costs and are available at any farm size. Financing tools like satellite-verified crop loans and insurance are aimed specifically at closing that gap.
What about sustainable farming issues outside the U.S., like in Chile or Mali?
The limiting factor changes by region — water scarcity and drought in Chile's central growing valleys, desertification and rainfall variability in Mali's Sahel-edge cropland — and this article does not have citable, current figures for either from the research base used here. Chile's ODEPA and FAO's AQUASTAT database, and the World Bank's Mali country data, are the right places to get current, sourced numbers rather than a generic global estimate.
How do I get started with satellite-based monitoring for my farm?
Try Farmonaut's app platform (web, iOS, Android) for crop monitoring, or explore API access for enterprise integration.
Get Started with Farmonaut Satellite Monitoring
Ready to document and improve your farm's sustainability practices? Try real-time satellite crop and soil monitoring:
Learn more or request enterprise integration: API Platform | API Developer Docs
The Bottom Line on Sustainable Farming
Sustainable farming solutions that hold up are the ones with a documented, checkable number behind them: 24.8 million acres in CRP, 27% precision-agriculture adoption, 95% yield retention under drought stress with cover crops and conservation tillage, and a $9.6 billion organic market that is growing in sales even as certified acreage has recently contracted. None of these are static — CRP enrollment shifts after every signup, ERS revises emissions estimates annually, and NASS reissues organic survey data each winter. The practices that will still make sense next year are the ones tied to your farm's actual limiting factor, checked against the current USDA source rather than a number frozen in an old article.
- 🌿 Match the practice to the limiting factor — nitrogen and methane in most of the U.S., water in Chile's growing valleys, land degradation and rainfall variability in Mali.
- 🌐 Use satellite and AI monitoring to document practice changes with dated, verifiable records, not just intent.
- 💸 Treat CRP payments, crop insurance, and traceability-driven premiums as the financial bridge during transition years.
- 📊 Re-check the source data — USDA NASS, ERS, and FSA all update on predictable cycles — before citing any figure from this or any other article as current.
With satellite monitoring, carbon footprinting, blockchain traceability, and AI-driven recommendations from Farmonaut, farms can track these practices with the same rigor USDA uses to measure them at the national level.

 Deluxe Conseil
 Krishify
 TVS Electronics
 BW Pipelines
 WICO
WICO Gen Chayat
 Chimera Innovation
 SkyHarvest
 Polaris Digitech
 Teledarbas
 Wild Oak Farm
 SFX
SFX BACF Africa
 Doodlakine
 Exurbia Geospatial
