

Agriculture Projects for Students: 10 Ideas + Free PDF Guide
Reviewed August 2026 against Frontiers in Education and the National FFA Organization.
Try it: Run your own numbers →
The ten projects below cover soil health, irrigation, pest management, composting, agroforestry, reforestation, rainwater harvesting, rotational grazing, and post-harvest storage — each with a materials list, a duration estimate, and a way to measure whether it worked. Skip to the comparison table if you already know your general interest area and just need to pick one, or use the project-fit calculator below to match a project to the hours and land you actually have.
These are agriculture projects for students at the high school and introductory college level — not university capstone research. They’re designed to run on a school garden bed, a few containers, or a small plot with a parent’s or teacher’s permission, and every one produces a real dataset a student can defend in front of a judge, a teacher, or a science fair panel.
Ten agriculture projects for students — soil testing, irrigation comparison, cover cropping, pest scouting, composting, agroforestry, reforestation, rainwater harvesting, rotational grazing, and post-harvest storage — each with a step-by-step method, an estimated timeline, and a way to measure results. A downloadable PDF version is linked at the bottom so you can print the checklist and take it into the field.
Why These Projects Matter: The Data Behind Student Agriculture
Student agriculture projects in the United States are usually organized through Supervised Agricultural Experience (SAE) programs, run alongside classroom agricultural education and FFA chapters. Research published in Frontiers in Education in 2026, covering the 2022–2024 academic years, gives a concrete picture of participation instead of a vague “many students do projects” claim:
- 📊 54% of first-year agricultural education students had any SAE project involvement during the 2022–2024 academic years.
- ⏱️ 33% of first-year students reached meaningful engagement, defined as 10 or more hours on their project, in the same period.
- 🔁 52% of continuing (non-first-year) students maintained an SAE project across the same two years.
- 🏆 29% of continuing students reached immersion-level engagement — 50 or more hours — during 2022–2024.
- 💵 SAE projects generated an estimated $1.6 billion in total economic impact across the United States in 2022, averaging $187,476 per local agricultural education program.
Scale that against enrollment: the National FFA Organization reported 1,042,245 student members in 9,407 chapters for the 2024–2025 school year (AgDaily). FFA publishes updated membership figures annually on its own site, so if you need the current number rather than the 2024–2025 figure, check the National FFA Organization’s agricultural education page directly — it’s refreshed each school year.
The gap between “any involvement” (54% and 52%) and “meaningful engagement” (33% and 29%) is the real design problem this article addresses: a project that a student starts but abandons at hour 3 produces no usable data and no defensible conclusion. Every project below is scoped so a single student can hit the 10-hour meaningful-engagement threshold within its stated duration, and most can reach the 50-hour immersion threshold if extended by a season.
For the per-program economic figure — $187,476 in local impact per agricultural education program in 2022 — the study defines “local impact” as spending, sales, and value generated by SAE projects tied to a single school’s program, not a single student’s project. Read the full Frontiers in Education paper for the methodology if you’re citing this figure in a research write-up.
Essentials of a Strong Agriculture Project
High-impact agriculture projects for students share several core characteristics that drive learning, boost outcomes, and promote engagement past the drop-off point the SAE data shows above.
- 🎯 Clear Objective: Each agriculture project for students should define a tangible goal—such as improving crop yield, soil health, water efficiency, or livestock welfare.
- 🌱 Sector Relevance: Projects should align with actual farm operations, soil resources, forestry planning, or rural infrastructure to ensure practical applicability and real-world context.
- 📏 Measurable Outcomes: Establish clear metrics like germination rate, moisture retention, pest reduction, fertilizer efficiency, or yield improvement to track results.
- 🔒 Feasibility & Safety: Choose scalable projects with accessible resources, proper supervision, safety protocols, and manageable scope for your environment.
- 📊 Data-Driven Analysis: Collect baseline data, monitor progress, and perform statistical analysis to draw evidence-based conclusions.
Tie your project’s objective back to a real-world agricultural challenge—optimizing crop productivity, conserving water, or improving soil health. This is also the exact structure an SAE project record book expects, so building your project this way doubles as FFA/SAE documentation if you’re enrolled in a formal ag-ed program.
Comparative Project Overview Table
| Project Name | Focus Area | Estimated Duration (weeks) | Required Materials (Count) | Expected Learning Outcome | Difficulty Level |
|---|---|---|---|---|---|
| Soil Health Assessment & Amendment | Soil Health | 3-4 | 7 | Test & analyze soil pH, organic matter, compaction; develop amendment plan | Beginner |
| Drip vs Surface Irrigation Comparison | Water Use, Crop Yield | 5-6 | 9 | Compare water use & yield using two irrigation methods | Intermediate |
| Cover Crops & Mulching Evaluation | Soil Moisture, Erosion Control | 6-7 | 6 | Evaluate soil moisture, temperature, & erosion outcomes | Beginner |
| Botanical Pest Monitoring Calendar | Pest Management | 4-5 | 8 | Identify pests, create monitoring schedule, & test control strategies | Intermediate |
| Composting & Biofertilizer Impact Study | Soil Nutrient Management | 8-10 | 10 | Produce compost, compare effects with synthetic fertilizer | Intermediate |
| Agroforestry Buffer Strip Design | Forestry, Biodiversity | 14-20 | 12 | Integrate trees/crops, assess shade, biodiversity, soil stability | Advanced |
| Reforestation Planning Project | Forestry, Sustainability | 16-24 | 11 | Site selection, native species study, analyze long-term growth | Intermediate |
| Rainwater Harvesting & Storage Comparison | Resource Efficiency, Water | 6-8 | 7 | Build, measure plant growth with/without supplemental water | Beginner |
| Rotational Grazing Model | Livestock, Forage Management | 8-12 | 9 | Model, track forage/animal performance, analyze pasture health | Intermediate |
| Post-Harvest Storage Solution Design | Infrastructure, Produce Quality | 4-6 | 8 | Design small storage to reduce produce losses, preserve quality | Beginner |
✔ Why Use a Comparative Project Table?
- 📊 Upfront clarity for students on required effort, resources, and expected benefits
- ✔ Visual overview—easy to compare options at a glance
- 🛠️ Flexible planning—choose projects that suit your skills, objectives, and resources
- ❤️ Engagement boost—diverse topics keep learning outcomes high
- 📋 Project-matching—quickly identify what fits your school, community, or local context
If your goal is to reach the 10-hour “meaningful engagement” threshold documented in the 2022–2024 SAE data above, the beginner-tier projects (soil health, cover crops, rainwater harvesting, post-harvest storage) reach it inside their first 3-4 weeks even at a couple of hours per week. The advanced-tier projects (agroforestry, reforestation) are the ones built to reach the 50-hour immersion tier the continuing-student data shows only 29% of students hit — pick one of those if you’re building a multi-year FFA project record rather than a single-semester assignment.
Top 10 Agriculture Projects for Students PDF Guide
Below are the ten most impactful projects in agriculture for students, with step-by-step guides, focus areas, and tips for leveraging data and technology to boost your results. Practically all these ideas can be implemented on a small scale—at your school, local farms, or in the wider community. Print or save this section as your working PDF checklist; each project lists exactly what to buy, measure, and log.
1. Soil Health Assessment & Amendment Planning
- 🌱 Objective: Analyze your local soil’s pH, organic matter, and compaction.
- 🧪 Method: Collect soil samples from different plots. Use simple soil test kits to determine pH, organic content, and compaction levels. Log all readings.
- 🔄 Action: Design an organic soil amendment plan using locally sourced compost or plant residues.
- 📈 Monitor: Track changes in soil health over several weeks using baseline and follow-up measurements.
- 📑 Learning: Understand soil’s role in plant growth, farm productivity, and water retention.
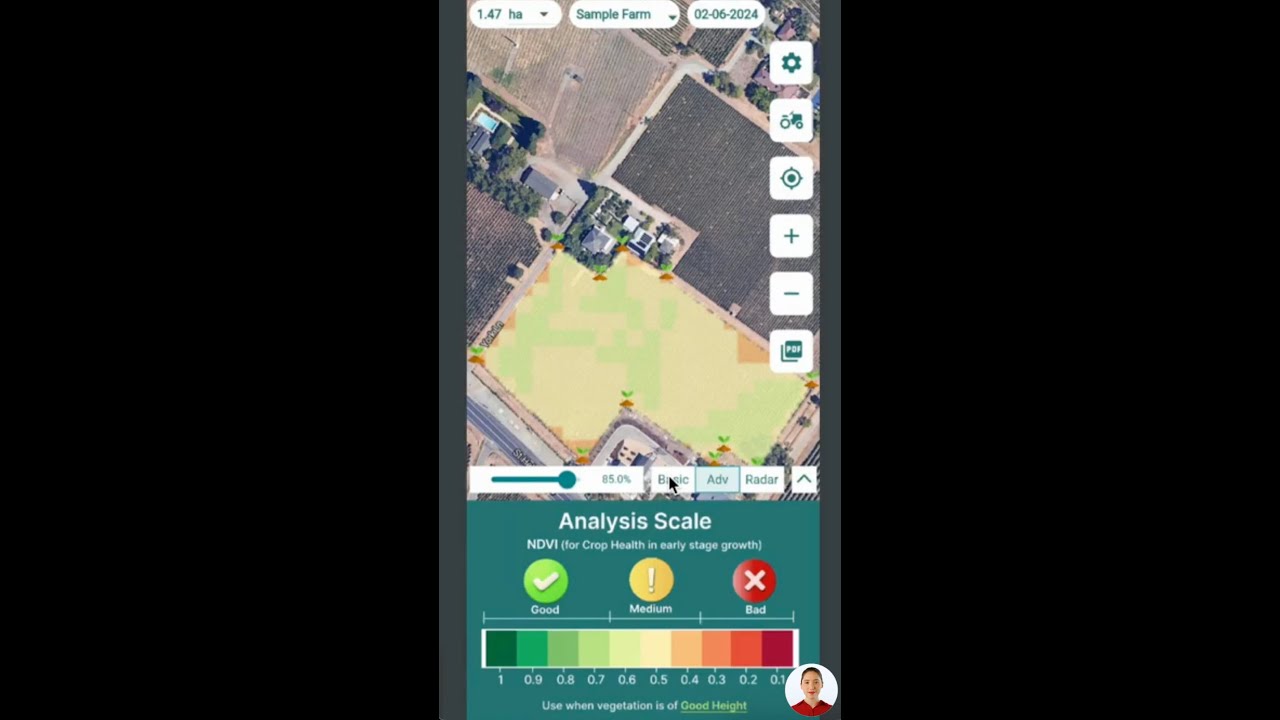
For long-term soil monitoring and health tracking, we suggest students use tools like Farmonaut’s crop and soil analysis modules available on Farmonaut’s platform. These solutions leverage satellite-based data to assess vegetation health and soil condition across your study plots.

Step-by-step:
- Collect soil samples from various locations within your site or school garden.
- Label each sample and test for pH, organic matter, and compaction with a field kit.
- Record results and analyze the data for patterns or deficiencies.
- Create a soil amendment plan using available organic materials: compost, manure, cover crops, etc.
- Re-test soil after implementing amendments to monitor changes.
- Compare amended vs non-amended plots for plant health and yield.
2. Drip vs. Surface Irrigation: Water-Smart Cultivation Comparison
- 💧 Objective: Compare drip irrigation versus surface irrigation for a chosen crop.
- 📊 Method: Set up two small plots—one with traditional surface irrigation, the other with a simple drip kit.
- 🚰 Action: Measure total water used each week and record crop growth parameters.
- 🎯 Outcome: Calculate water saved, changes in yield, and efficiency of each method.

Students often skip quantitative data logging. Track water used (gallons per week), soil moisture, and final crop yield in each plot from day one — going back to reconstruct week-one numbers from memory is the single most common reason these comparisons fail peer review at science fairs.
Bonus Resource:
Gain insights on how satellite imagery supports irrigation planning on a larger scale by exploring the Farmonaut NDWI and moisture monitoring solutions. The Large Scale Farm Management platform can help students understand remote moisture sensing and efficient water use for bigger operations.
3. Cover Crops and Mulching: Soil Moisture & Erosion Control
- 🌾 Objective: Evaluate the effects of cover crops and mulching on soil moisture and temperature in your school or community garden.
- 📋 Method: Select garden plots, establish cover crops in one, mulching in another, and leave a control plot bare.
- 🌡️ Action: Weekly, use a soil thermometer and moisture probe to monitor temperature and moisture retention in each plot. After heavy rainfall, assess for visible erosion.
- 🌱 Outcome: Chart the effects of these practices on soil health, plant growth, and erosion reduction.

Soil moisture retention under mulch versus bare soil is exactly the kind of figure this project is designed to generate for your own plot and climate — log weekly readings rather than relying on a single national average, since retention depends heavily on your local soil texture and rainfall pattern.
4. Botanical Pest Monitoring & Low-Toxicity Management
- 🐞 Objective: Create a pest scouting calendar and identify common pests in your local ecosystem.
- 🔎 Method: Routinely inspect crops or garden plants for pests, document quantity and type, and track pest population trends using a calendar.
- 🌿 Action: Implement and compare low-toxicity interventions (neem spray, soap solution, natural repellents) versus untreated controls.
- 🔬 Outcome: Measure pest reduction and assess efficacy of sustainable pest management techniques.

Tips:
- 🦋 Identify and photograph all insects—distinguish between harmful and beneficial species.
- 📆 Use a calendar to document outbreaks, infestation rates, and intervention outcomes.
- 📈 Compare damage levels, yield, and plant health across each treatment group.
Effective pest control and pest monitoring are crucial not just for higher yields, but for protecting the livelihoods and investments of rural communities and agri-businesses alike.
5. Compost & Biofertilizer Production: Impact on Crop Growth
- 🌱 Objective: Produce compost or biofertilizers and compare their effects on plant growth with synthetic fertilizers.
- ♻️ Method: Set up two groups of pots or plots—one using your homegrown compost/biofertilizer, the other using conventional fertilizer.
- 🌼 Action: Plant the same crop, ensure equal watering and sunlight, and record weekly measurements of germination, leaf size, color, and yield.
- 🏆 Outcome: Draw conclusions by analyzing the material’s impact on growth, quality, and soil health indicators.

6. Agroforestry Buffer Strip: Integrating Trees & Crops
- 🌳 Objective: Design a small agroforestry demonstration plot—incorporate buffer strips with native trees and crops.
- 🖊️ Method: Map your plot, select appropriate species, and plant trees as buffers among crops or in strips.
- 👍 Action: Regularly record the following: under-canopy soil moisture, crop yield, shade temperature, and biodiversity (birds, insects).
- 🌟 Outcome: Evaluate benefits such as erosion control, soil retention, and ecosystem health.

At 14-20 weeks, this is one of the longest projects on this list — long enough for a student pursuing an SAE record book to log well past the 50-hour immersion threshold documented in the 2022-2024 continuing-student data above, provided the observation schedule is kept weekly rather than sporadic.
7. Reforestation Planning & Sustainability Analysis
- 🌲 Objective: Assess site suitability and develop a reforestation plan using indigenous species.
- 🌎 Method: Survey soil, sunlight, and moisture; research best native trees for the area.
- 📝 Action: Prepare a planting schedule, map, and care plan. Monitor sapling growth rates at intervals.
- 💡 Outcome: Illustrate the long-term benefits of forest restoration (carbon sequestration, soil protection, biodiversity).
8. Rainwater Harvesting & Plant Growth Comparison
- 💧 Objective: Build a basic rainwater catchment system and compare plant growth with and without supplementary irrigation.
- 🛠️ Method: Collect rainwater runoff in barrels or tanks; set up two identical plots—one irrigated only by rainwater, the other using stored water as backup during dry periods.
- 🌿 Action: Measure plant height, moisture, and yield over a growing cycle.
- 📊 Outcome: Analyze the impact of supplemental watering on resilience and productivity.

9. Rotational Grazing & Livestock Management Model
- 🐄 Objective: Model the effects of rotational grazing within a small fenced pasture.
- 📋 Method: Divide an area into several paddocks. Move livestock at set intervals to mimic sustainable grazing cycles.
- 🍀 Action: Track forage growth, availability, and animal health after each grazing rotation.
- 🧮 Outcome: Use data to highlight best practices for improved pasture health and animal productivity.
10. Post-Harvest Storage Solution Design
- 🧊 Objective: Design a low-cost, small-scale storage solution for fruits or vegetables to minimize post-harvest losses and maintain quality.
- 🧱 Method: Research traditional cool storage or evaporative cooling. Build a prototype (e.g., clay-pot cooler or insulated box).
- 🦠 Action: Measure produce spoilage and quality over time in your storage versus open air.
- 🏅 Outcome: Recommend affordable storage improvements for local farms and communities.
📦 Five Practical Benefits of These Projects
- ✔ Provides real-world context for classroom learning
- 📊 Fosters practical data collection and basic statistical analysis skills
- 🌿 Encourages sustainable and organic practices using locally available resources
- 🤝 Strengthens community engagement and local farm partnerships
- 🚩 Highlights the importance of safety protocols and planning
- 📚 Strengthens understanding of the interconnection between soil, water, crop, pest, and community dynamics
- 🚀 Promotes innovative thinking—experimentation is fundamental in driving agricultural progress
Documenting every step—from materials and initial baseline data, through to final statistical analysis—ensures your conclusions are credible and your agriculture project for students is easily reproducible and scalable.
Simple Agriculture Projects for Beginners
If you’re searching for simple agriculture projects for students rather than a full ten-project curriculum, start with the three rated Beginner in the comparison table: Soil Health Assessment (3-4 weeks, 7 materials), Cover Crops & Mulching (6-7 weeks, 6 materials), and Rainwater Harvesting (6-8 weeks, 7 materials). All three need under 10 items of equipment, run in a school garden bed or a set of containers, and don’t require chemical handling or livestock access.
For a high school student who needs a project done inside a single grading period, Soil Health Assessment is the fastest complete cycle at 3-4 weeks — it’s also the project most directly transferable to an SAE record book entry, since soil testing methodology maps onto standard agricultural education rubrics. Post-Harvest Storage Solution Design (4-6 weeks) is the next-fastest and works well as a design/build project rather than a field-monitoring one, which suits students without outdoor plot access.
None of the beginner projects requires purchased lab equipment beyond a basic soil test kit, a thermometer, and a moisture probe — all inexpensive and sold at most farm-supply or hardware stores. If your school’s agricultural education program has an FFA chapter, check with your advisor before buying anything: many chapters maintain shared equipment sets precisely because per-student purchases are the most avoidable cost in a project budget.
More Agriculture Project Ideas by Setting
If none of the ten fits your space, these shorter agriculture project ideas use the same method: one change, a control, and a number you record every week.
| Setting | Project idea | What to measure |
|---|---|---|
| Indoors, no land | Grow lettuce in a simple hydroponic tub against lettuce in potting mix | Days to harvest, fresh weight per plant |
| Indoors, no land | Germinate seeds in water with rising amounts of salt | Germination rate at each salt level |
| Windowsill | Grow microgreens under different light durations | Height and weight after 10 to 14 days |
| Classroom | Run a worm bin against a standard compost bin | Weeks to finished compost, temperature, volume reduction |
| School garden | Plant a pollinator strip next to a vegetable bed | Pollinator visits counted for 10 minutes each week, fruit set |
| School farm or home | Compare two feed or bedding options for poultry | Weight gain, feed used, egg count |
| Computer only | Track a local field’s vegetation index from free satellite imagery across a season | NDVI by week, matched to rainfall |
Pick one variable to change and keep everything else the same. Three or more pots or plots per treatment make results easier to defend than a single pair. If you belong to an FFA chapter, most of these can be logged as a research SAE.
Project-Fit Calculator
Enter the hours per week you can realistically commit and the number of weeks left in your term, and this tool matches you to the projects from the table above that fit inside your available time and cross the engagement thresholds documented in the 2022-2024 SAE research.
Run your own numbers
Implementation & Methodology Tips
Effective projects for agriculture students require thoughtful preparation, structured experimentation, and a clear plan for safety and data handling. Here’s how to plan, implement, and document your initiative for optimum educational impact:
- 🤝 Work with local mentors: Partner with local farms, ag extension agents, or school teachers for advice, data access, and guidance. Never work unsupervised in remote or hazardous areas.
- 🛠 Use simple tools: A small kit—soil test kits, rulers, tape, notebooks, smartphones—covers most needs. For remote sensing and crop health insights, consider platforms like ours at Farmonaut for data-driven management.
- 🔬 Emphasize experimentation: Design clear control-treatment groups. Carefully document all variables—soil type, water usage, weather, crop type, etc.
- 📊 Collect and analyze data: Take baseline readings. Track progress at regular intervals. Utilize simple charts/graphs or spreadsheet analysis to draw your project’s conclusions.
- 📢 Communicate findings: Prepare a concise report, a presentation poster or slides—summarizing goals, methods, results, and recommendations for wider community benefit.
If working in teams, keep a shared digital log (photos, measurements, daily notes), making it easier to collaborate and back up your data!
Safety Essentials:
- ✔️ Wear gloves, closed footwear, and hats outdoors.
- ✔️ Use protective equipment when handling fertilizers or pest control agents.
- ✔️ Ensure all electrical or water collection setups are secure and supervised.
- ✔️ Keep first-aid kits handy—accidents can happen even with simple activities!
Not accounting for all variables—like unexpected weather or differences in sunlight—can lead to inconclusive results. Always document external factors alongside your main project data.
Outcomes and Learning Benefits
Strong agriculture projects for students foster holistic understanding and measurable outcomes across different skills. The economic figures from the 2022-2024 SAE research make the case concretely: agricultural education programs generated an average of $187,476 in local economic impact per program in 2022, and that value is built by students individually reaching the engagement thresholds described earlier — not by enrollment numbers alone.
- 🌱 Practical knowledge: Understand agronomy, soil science, resource management, and ecological connections.
- 🔬 Technical skill: Gain hands-on experience in field testing, instrumentation, experiment design, and statistical analysis.
- 🤔 Critical thinking: Hypothesize, test, and draw evidence-based conclusions—versus rote learning or guesswork.
- 🌍 Community engagement: Collaborate with local farms and apply knowledge to real-world rural, agricultural, or community initiatives.
- 🚀 Career readiness: Build skills for future roles in agroforestry, rural infrastructure planning, landscape management, and more.
Classroom demonstrations of even small-scale projects can inspire larger, community-wide sustainability initiatives—laying the groundwork for long-term change in agriculture. If you’re enrolled in a formal ag-ed program, ask your instructor how your project can count toward an SAE record — the participation data above shows that’s the difference between a one-off assignment and a multi-year, resume-worthy project history.
Key Farmonaut Tools for Students
At Farmonaut, we champion data-driven agriculture projects for students at every scale. Use these satellite and AI-powered tools to deepen your project analysis and real-world impact:
-
Satellite Crop & Soil Health Monitoring: Easily track plant growth, soil moisture, and overall field status with multispectral satellite data using the Farmonaut Web & Mobile App.



- Jeevn AI Advisory: Get real-time satellite and weather-based recommendations for crop and soil health. Great for monitoring field intervention impacts in student projects. Try it via our Crop Plantation & Forest Advisory App.
-
Traceability for Project Documentation:
Record every stage of your project, from field mapping to final harvest, using blockchain-based traceability. Makes your advisory/conclusion truly transparent and verifiable. - API Access for Developers: Integrate satellite data insights directly into custom school or college apps with our Farmonaut Satellite API and API Developer Documentation.
- Environmental & Carbon Impact Monitoring: For sustainability-focused projects, use our carbon footprint monitoring solution to quantify and reduce project or farm emissions.
Students familiarized with satellite-driven agriculture solutions like Farmonaut’s gain an edge: ready-made, data-rich project documentation; exposure to cutting-edge climate-smart technologies; and early experience with resource management platforms of tomorrow.
FAQs on Agriculture Projects for Students
1. What makes a good agriculture project for students?
A good agriculture project is goal-oriented, measurable, data-driven, and hands-on. The best projects focus on improving soil health, water use, pest management, or efficiency, and have practical implications for the local community or farm. If you’re enrolled in a formal agricultural education program, it should also map onto SAE record-book categories so the hours you log count toward your program.
2. Is there a downloadable PDF version of these agriculture projects for students?
This page is built to function as your PDF guide: every project above lists objective, method, materials, and outcome in order, so you can print this section directly or save it as a PDF from your browser (File → Print → Save as PDF) for offline reference in the field.
3. What are simple agriculture projects for high school students?
The three rated Beginner in the comparison table — Soil Health Assessment (3-4 weeks), Cover Crops & Mulching (6-7 weeks), and Rainwater Harvesting (6-8 weeks) — need fewer than 10 materials each and no chemical handling, making them the best fit for a first high school agriculture project. See the Simple Agriculture Projects for Beginners section above for a full breakdown.
4. Why use comparative experimentation (e.g., drip versus surface irrigation)?
Comparing methods helps students quantify outcomes—such as water saved or yield improved. This hands-on experimentation builds critical skills in data collection and analysis, and produces the kind of dataset that holds up under a science-fair judge’s or teacher’s questions.
5. How can students with limited access to land or resources still do impactful projects?
Start small! Use potted plants, school gardens, or containers. Many experiments can be scaled down yet still yield meaningful data—especially when leveraging digital and satellite-based monitoring tools.
6. What are the main safety protocols for student agriculture projects?
Students should always have supervision, use safety equipment (gloves, masks), and ensure all chemical/biological materials are handled responsibly. Basic first aid and emergency protocols should also be discussed in advance.
7. How can Farmonaut help make agriculture projects for students more meaningful?
We provide real-time, data-driven satellite solutions that allow students to monitor soil, crop health, and environmental conditions efficiently. Our solutions make project monitoring more precise, accelerating learning outcomes and supporting transparent, reproducible research for agriculture-focused students.
- ✅ Direct connection between theory and practice
- 💡 Enhanced digital literacy with advanced tools like satellite data
- 🌍 Immediate application of sustainable agriculture practices
- 💬 Clear, concise documentation to drive community impact
- 🚀 Springboard opportunities for future agricultural careers
Ready to launch your own agriculture project for students?
Use this step-by-step PDF guide as your roadmap for data-driven, sustainable, and impactful agricultural initiatives. Harness the power of thoughtful planning, practical experimentation, and leading-edge technology to improve crop yield, soil health, water efficiency, and beyond. Let your next project set a new benchmark for learning outcomes—in the classroom and in the field!
Discussion
Questions, corrections or field experience? Share them below. First-time comments are reviewed before they appear, and your email is never published.
No comments yet. Be the first to add a question or your experience.

 Concept Global
 Kubota
 FFBS
FFBS Jontra
 Kalustyan
 Tucor
Tucor Geno
Geno Hayleys Agriculture
 Linx Agritech
 Adinet
 Save Your Soils
 Grandstream Algérie
 XOS Realty
 Geospatial Lab Africa
 Agro La Gándara
 HIPSAC
 ZOL Zimbabwe
 Licence holder · Niger · Gold










