

Canada Ethanol Market & US Farm Subsidies: The Numbers
Reviewed August 2026 against USDA Economic Research Service, USDA Farm Service Agency, and US Environmental Protection Agency data.
US farm subsidies are forecast at $44.3 billion in direct government payments for 2026, per USDA’s Economic Research Service Farm Sector Income Forecast. Canada’s farm machinery and equipment market was valued at $64.4 billion CAD in the 2021 Census of Agriculture, the most recent benchmark Statistics Canada has published. The US Renewable Fuel Standard mandates roughly 15 billion gallons of conventional (corn-based) ethanol for 2026-2027, a demand floor that shapes corn prices on both sides of the border. This article walks through what’s actually funded, at what level, from which agency, and how to pull a fresher number the day you read this.

Table of Contents
- US Farm Subsidies: What’s Actually Funded in 2026
- Ethanol Subsidies: The Federal Tax Credit Structure
- Canada Ethanol Market: Where the Mandate Meets the Corn Belt
- Canada Agricultural Machinery Market
- Canada Agricultural Drones Market: What’s Measured and What Isn’t
- Subsidies on Corn and Wheat: Price Context
- Feed-Cost Exposure Calculator
- How to Verify These Numbers Yourself
- Where Agtech Fits Into the Subsidy Picture
- FAQ
- Try it: Estimated feed cost
US Farm Subsidies: What’s Actually Funded in 2026
“Gov farm subsidies” is a broad search, so here is the actual breakdown by program, with the agency and period behind each figure.
USDA’s Economic Research Service forecasts $44.3 billion in direct government farm payments for 2026. This is the headline figure ERS publishes quarterly in its Farm Sector Income Forecast, and it covers commodity programs, ad hoc disaster and market-support payments, and conservation payments combined — not a single program. Because ERS revises this forecast each quarter as new data comes in, the $44.3 billion figure should be treated as the 2026 vintage, not a fixed baseline: check the USDA ERS Farm Sector Income Forecast directly for the current quarter’s revision. How those payments break down by program, and what changed recently, is covered in US farm subsidy programs.
Separately, USDA’s Risk Management Agency reported $10.4 billion in crop insurance premium subsidies for 2024 — the government’s share of the premium cost for federally reinsured crop insurance policies, detailed in RMA’s 2024 Specialty Crops Report. And in December 2025, USDA’s Farm Service Agency announced $12 billion in Farmer Bridge Assistance Program payments to row crop farmers for 2026, a program distinct from both the ERS forecast total and the RMA insurance subsidy — announced separately because it’s an ad hoc bridge payment, not a standing insurance or commodity program.
| Program | Amount | Period | Agency |
|---|---|---|---|
| Direct government farm payments (total, all programs) | $44.3 billion (forecast) | 2026 | USDA Economic Research Service |
| Crop insurance premium subsidies | $10.4 billion | 2024 | USDA Risk Management Agency |
| Farmer Bridge Assistance Program (row crops) | $12 billion | 2026 | USDA Farm Service Agency |
These three figures are not additive in a simple sense — the Farmer Bridge payments and crop insurance subsidies likely fall inside or alongside the broader ERS direct-payment total depending on how each is categorized in a given quarter — so treat them as three separate, independently sourced data points rather than a sum. If you need the current distribution schedule for the Farmer Bridge Assistance Program, USDA FSA posts payment announcements to its newsroom within weeks of each disbursement; see the USDA FSA announcement for the program’s terms and eligibility.
Subsidies in Agriculture and Subsidies on Agriculture: The Distinction
“Subsidies in agriculture” and “subsidies on agriculture” both point to the same functional categories: income support (direct payments), risk management (crop insurance premium subsidies), and ad hoc disaster or market-support payments (like the Farmer Bridge program). What changes year to year is the mix — a year with a major weather disaster shifts more dollars into ad hoc payments, while a stable year leans on standing crop insurance and commodity programs. The $44.3 billion 2026 ERS forecast is the number to track for the aggregate; it is published quarterly, so a search run more than three months after this review should pull the newer quarter’s revision rather than cite this one as current.
Ethanol Subsidies: The Federal Tax Credit Structure
“Ethanol subsidies” in the US context means, principally, the federal biofuel production tax credit administered under the Internal Revenue Code and tracked by the Department of Energy’s Alternative Fuels Data Center. Effective January 1, 2025, the baseline credit is $0.20 per gallon. Producers who meet prevailing wage and registered apprenticeship requirements qualify for a higher rate: $1.00 per gallon. That five-fold gap is the single most important number in this section — it means the effective subsidy a producer receives depends entirely on whether their facility meets labor standards that have nothing to do with fuel chemistry.
| Credit tier | Rate | Condition |
|---|---|---|
| Baseline federal biofuel production tax credit | $0.20 per gallon | No labor requirements met |
| Enhanced federal biofuel production tax credit | $1.00 per gallon | Prevailing wage + registered apprenticeship requirements met |
Both rates took effect January 1, 2025, per the Alternative Fuels Data Center’s ethanol laws and incentives page, which the Department of Energy updates as federal and state legislation changes — bookmark that page rather than this one if you need the current rate, since tax credit structures are amended on their own legislative timeline, not an annual one.
On the demand side, the US Environmental Protection Agency’s Renewable Fuel Standard sets the conventional (corn) ethanol volume requirement at roughly 15 billion gallons for the 2023-2025 rule period, carried forward into 2026-2027 planning. This mandate — not a direct subsidy check to farmers — is what creates guaranteed blending demand for corn-based ethanol and is the mechanism most closely tied to corn price support. Full volume tables are in the EPA’s Final Renewable Fuel Standards Rule, which EPA revises through its own rulemaking cycle — check that page directly before quoting a mandate volume for a period beyond 2027.
Canada Ethanol Market: Where the Mandate Meets the Corn Belt
Canada’s ethanol market runs on its Clean Fuel Regulations, which set a carbon-intensity reduction target for transportation fuel rather than a direct dollar subsidy to ethanol producers. That’s a meaningful distinction for anyone searching “canada ethanol market” expecting a US-style tax credit: the research available does not show a published direct government subsidy program paying Canadian ethanol producers per gallon or per litre, the way the US federal biofuel credit does. What the Clean Fuel Regulations do is create a compliance-driven demand floor — refiners and fuel suppliers need low-carbon-intensity fuel credits, and ethanol blending is one way to generate them — which functions similarly to a mandate in its effect on corn demand, even without a matching direct payment structure.
Ontario’s role as a major Canadian corn producer means Clean Fuel Regulation-driven ethanol demand feeds directly into the same corn market that supports livestock feed costs — the two are structurally linked even where the subsidy mechanisms differ from the US. For current Canadian ethanol production volumes, USDA’s Foreign Agricultural Service publishes a Canada-specific Biofuels Annual report once a year, and Statistics Canada’s energy supply and demand tables cover the same ground with roughly a 12-month reporting lag. Neither source was available with current-year figures in the research for this article, so if you need an up-to-date production number in litres or gallons, those two sources are where to pull it — do not rely on the 2024 range cited in older versions of this article, since neither the volume nor the subsidy structure behind it has been re-verified since.
Canada Agricultural Machinery Market
Statistics Canada’s 2021 Census of Agriculture put the value of farm machinery and equipment in Canada at $64.4 billion CAD. This is a stock value — the total worth of machinery and equipment Canadian farms reported owning — not an annual sales or market-growth figure, which is an important distinction if you’re trying to size the “canada agricultural machinery market” as a yearly transaction volume rather than an installed base.
The Census of Agriculture runs on a five-year cycle, so the next update to this figure falls due in 2026, with results typically published by Statistics Canada roughly a year after collection. Until that release, $64.4 billion (2021) remains the most recent official benchmark; no growth rate or 2024-2025 forecast for the Canadian machinery market was available in the sources checked for this piece. If you need a growth trajectory rather than a point-in-time value, Statistics Canada’s farm machinery and equipment table (3210023801) is the direct source table to monitor for the next data release.
Canada Agricultural Drones Market: What’s Measured and What Isn’t
A Canada-specific agricultural drone market size or adoption rate is not published in the sources checked for this article. The closest verified data point is from the United States: 7.0% of US corn acres used aerial imagery (a category that includes drone-based imagery) as of 2016, per historical USDA survey data — a figure old enough now that it should not be quoted as a current adoption rate for either the US or Canada.
For a current Canadian figure, the practical path is Statistics Canada’s Census of Agriculture technology-adoption questions (next cycle 2026) or industry surveys from groups like the Canadian Agricultural Human Resource Council, which periodically track precision-ag technology uptake including drones. Because no verified current number exists for this specific market, the honest answer to “how big is the Canada agricultural drones market” right now is: not publicly quantified at a national level — check Statistics Canada’s next Census release or a paid industry report (e.g., from a market-research firm covering precision agriculture) rather than accepting an unsourced figure. This is also why precision agriculture solutions are usually evaluated by farmers on a cost-per-acre basis rather than by market-size statistics that aren’t yet reliably tracked at the country level.
Subsidies on Corn and Wheat: Price Context
“Subsidies on corn” searches usually want to know how support programs interact with the price a farmer actually receives. USDA’s National Agricultural Statistics Service put the US marketing-year average corn price at $4.30 per bushel for the 2025/26 marketing year. USDA’s Agricultural Marketing Service put the US marketing-year average wheat price at $5.52 per bushel for the same period. Both are marketing-year averages, not spot prices — they smooth out weekly and seasonal swings, which is exactly why NASS and AMS publish updated ag price reports weekly during the growing and marketing season.
These marketing-year prices are the backdrop against which both the ethanol mandate’s corn demand and the $44.3 billion 2026 direct-payment forecast operate: corn support programs and crop insurance subsidies are priced and triggered relative to these same NASS and AMS benchmarks. For the current week’s corn and wheat prices rather than the marketing-year average, USDA NASS publishes weekly Agricultural Prices reports at nass.usda.gov, and USDA AMS publishes its own grain price summaries on a similar cadence — both are the correct refresh path once you’re past the 2025/26 marketing year.
| Commodity | Marketing-year average price | Period | Source |
|---|---|---|---|
| Corn | $4.30 per bushel | 2025/26 marketing year | USDA NASS |
| Wheat | $5.52 per bushel | 2025/26 marketing year | USDA AMS |

Feed-Cost Exposure Calculator
Corn is the dominant input in most livestock feed rations, so a change in the corn price flows straight into feed cost per ton. Enter your operation’s numbers below to see what a change in corn price does to your feed cost, using the 2025/26 marketing-year average corn price of $4.30 per bushel as the default reference point.
Estimated feed cost: —
Assumptions: this calculator estimates only the corn-driven portion of feed cost, using a fixed bushels-per-ton conversion you supply and a flat non-corn cost per ton. It excludes soybean meal price swings, transportation, storage, and ration-formulation changes across seasons — for a full ration cost, use your feed supplier's current formulation sheet alongside the corn price from USDA NASS.

How to Verify These Numbers Yourself
Every figure in this article expires on a different schedule, so treat this as a durable checklist rather than a one-time read:
- US farm subsidy totals: USDA ERS updates its Farm Sector Income Forecast quarterly. Pull the current release from the ERS Farm Sector Income Forecast page before citing the $44.3 billion figure past its current quarter.
- Farmer Bridge Assistance Program and other ad hoc payments: USDA FSA posts distribution announcements to its newsroom within weeks of each payment round.
- Federal ethanol tax credit rates: the Alternative Fuels Data Center's ethanol laws and incentives page reflects rate changes as legislation is amended, not on a fixed calendar.
- Renewable Fuel Standard mandate volumes: EPA revises these through its own rulemaking cycle; check the Final Renewable Fuel Standards Rule page for volumes beyond the current rule period.
- Corn and wheat prices: USDA NASS and AMS publish weekly Agricultural Prices reports during the growing and marketing season — use those for a current spot or weekly figure rather than the marketing-year average cited here.
- Canada ethanol production: USDA FAS publishes an annual Canada Biofuels Annual report; Statistics Canada's energy supply and demand tables cover the same ground with roughly a 12-month lag.
- Canada farm machinery market value: Statistics Canada's Census of Agriculture runs on a five-year cycle; the next update after the 2021 figure used here falls due in 2026.
Where Agtech Fits Into the Subsidy Picture
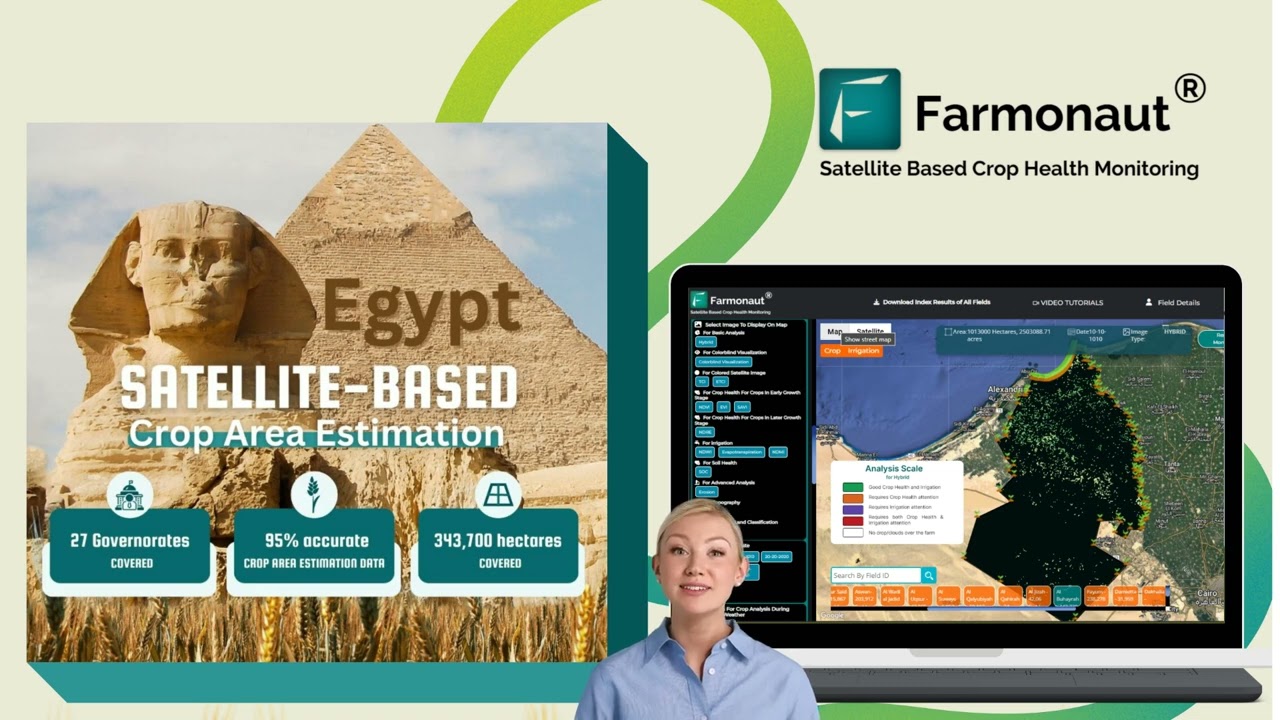
None of the subsidy or mandate structures above change the fact that input costs — corn, feed, machinery — are the line items a farm operator actually controls day to day. Farmonaut's satellite-based crop monitoring tracks vegetation health indices and soil moisture in real time, which lets corn and livestock-feed producers target inputs more precisely rather than applying a flat rate across a field. That doesn't offset a $1.22 gap between the $4.30 corn price and any given contract price, but it does affect the cost side of the ledger a farm controls directly, independent of what Washington or Ottawa does with mandates or tax credits.
The Farmonaut app gives corn producers field-level insight into where inputs are needed and where they aren't, which matters more, not less, when the marketing-year price backdrop is fixed and the only lever left is cost control. Farmers can use satellite imagery and AI-driven analytics to flag underperforming zones, adjust irrigation timing, and catch yield-limiting issues before they show up at harvest.
Precision monitoring also supports crop rotation planning, which is one of the few farm-level decisions that can reduce dependence on any single commodity's price cycle — corn included. Diversifying rotation reduces exposure to a single mandate, a single tax credit rate, or a single marketing-year price swing, which is a durable hedge that doesn't depend on which subsidy program is active in a given year.
Researchers and policymakers tracking the interaction between these subsidy programs and on-the-ground land use can pull the same underlying data through the Farmonaut API, which provides land-use change, crop health trend, and environmental-indicator data at scale. The API Developer Docs cover the integration details for anyone building subsidy-impact analysis or yield-forecasting tools on top of that data.

For operators weighing whether to expand corn acreage against the current mandate and price backdrop, the interconnection between trade policy and domestic subsidy programs matters as much as the subsidy figures alone — a tariff shift on export markets can move the effective price a farmer receives independent of any domestic support program. Broader agricultural policy analysis and career-side context on who works in these support programs are useful companion reading, as is a look at resilient farming system design for reducing single-commodity exposure, and comparative production technology approaches used in other major agricultural economies.
Farmonaut's tools are available through the Android app and iOS app, both built for field-level decisions that don't wait for the next policy announcement.
FAQ
- Q: What are the current US federal ethanol subsidy rates?
A: Effective January 1, 2025, the baseline federal biofuel production tax credit is $0.20 per gallon; producers meeting prevailing wage and registered apprenticeship requirements qualify for $1.00 per gallon, per the Department of Energy's Alternative Fuels Data Center. - Q: How much does the US government spend on farm subsidies?
A: USDA's Economic Research Service forecasts $44.3 billion in direct government farm payments for 2026. Separately, USDA's Risk Management Agency reported $10.4 billion in crop insurance premium subsidies for 2024, and USDA's Farm Service Agency announced $12 billion in Farmer Bridge Assistance Program payments for 2026. - Q: Does Canada subsidize ethanol production directly?
A: The available research did not find a published direct dollar subsidy program for Canadian ethanol producers. Canada's Clean Fuel Regulations set a carbon-intensity reduction target that creates compliance-driven demand for low-carbon fuels including ethanol, functioning differently from the US's per-gallon tax credit structure. - Q: How big is the Canada agricultural machinery market?
A: Statistics Canada's 2021 Census of Agriculture valued Canadian farm machinery and equipment at $64.4 billion CAD — a stock value of the installed base, not an annual sales figure. The next Census update is due in 2026. - Q: Is there reliable data on the Canada agricultural drones market?
A: No Canada-specific drone market size or adoption rate was found in the sources checked for this article. The closest data point is a 2016 US figure (7.0% of corn acres using aerial imagery), which is too dated to use as a current benchmark for either country. - Q: What is the Renewable Fuel Standard's corn ethanol mandate?
A: The EPA's Renewable Fuel Standard sets the conventional (corn) ethanol volume requirement at roughly 15 billion gallons for the 2026-2027 period, per EPA's Final Renewable Fuel Standards Rule. - Q: What were US corn and wheat prices for the 2025/26 marketing year?
A: USDA NASS reported a marketing-year average corn price of $4.30 per bushel; USDA AMS reported a marketing-year average wheat price of $5.52 per bushel, both for 2025/26.



Discussion
Questions, corrections or field experience? Share them below. First-time comments are reviewed before they appear, and your email is never published.
No comments yet. Be the first to add a question or your experience.

 Linx Agritech
 Adinet
 Save Your Soils
 YelloSkye
 GalaxEye Space
 Grandstream Algérie
 XOS Realty
 Geospatial Lab Africa
 Agro La Gándara
 HIPSAC
 ZOL Zimbabwe
 Juligerm
 AdBio
AdBio MISE Maroc
 NWNS
NWNS Red August Group
 Farm Inc
 WeMe Global
 Agrotoken
 Blue BearX
 Licence holder · Niger · Gold










