
Investing in Farmland: Canada & U.S. Prices, Yields, Rules
Reviewed August 2026 against the USDA National Agricultural Statistics Service (NASS) Land Values report, Farm Credit Canada’s Farmland Values Report, and the NCREIF Farmland Property Index.
Try it: Enter your figures above to see results. →
U.S. cropland averaged $6,020 per acre in the USDA’s 2026 Land Values report, up 3.3% from 2025, while Canadian farmland values rose 9.3% nationally in 2025 according to Farm Credit Canada (FCC). Neither number tells you whether farmland is a good investment on its own — that depends on what you pay relative to what the land earns in cash rent, plus whichever province or state’s ownership rules apply to you. This article works through both markets with the actual figures, a derived yield comparison, and a calculator so you can run your own numbers.

How Much Farmland Costs Right Now: U.S. and Canada Compared
The USDA’s July 2026 Land Values Summary put the U.S. average value of farm real estate (land plus buildings) at $4,500 per acre, up $150 (3.4%) from 2025. Cropland alone averaged $6,020 per acre (+3.3%), and pastureland averaged $2,000 per acre (+4.2%), the first time U.S. cropland has crossed $6,000 per acre in the series, according to farmdoc’s Farm Policy News at the University of Illinois, which summarizes the primary USDA NASS Land Values report. Corn Belt cropland averaged $8,590 per acre, with Iowa the most expensive state at $10,700 per acre (+3.9%), followed by Illinois at $10,200 (+3.6%) and Ohio at $10,100 (+3.6%). Nebraska came in at $6,960 per acre (+2.4%), and Kansas at $3,540 (+2.9%).
Cash rent moved in the opposite direction at the national level: the average U.S. cropland cash rent was $160 per acre in 2026, down $1 from 2025, while irrigated cropland held steady at $244 per acre. By state, California led cash rent at $331 per acre, followed by Hawaii ($280), Iowa ($271), Illinois ($261), Washington ($234), Indiana ($232), Nebraska ($227), Idaho ($212), Minnesota ($206), and Ohio ($188).
Investing in Farmland in Canada: Provinces, Growth Rates, and Ownership Rules
Canadian farmland values increased 9.3% nationally in 2025, matching the 2024 growth rate, according to Farm Credit Canada’s 2025 Farmland Values Report, released in March 2026. FCC does not publish one blended national dollar-per-acre figure, because per-acre values differ too widely between, say, Ontario and Saskatchewan for an average to mean much; instead it tracks the annual percent change by province. Manitoba posted the largest gain at 12.2%, followed by Alberta (11.4%), Saskatchewan (9.4%), New Brunswick (9.1%), Prince Edward Island (8.5%), Quebec (4.8%), Ontario (2.2%), and Nova Scotia (1.6%). British Columbia was the outlier, falling 1.7% despite having the highest average per-acre values in the country.
Foreign and non-resident buyers face rules that are set province by province, not federally. Saskatchewan’s are the most tightly quantified: under provincial law, non-resident persons are capped at land holdings with an assessed value of $15,000 for property-tax purposes (excluding buildings), and non-Canadian-owned entities are capped at 10 acres in aggregate, per MLT Aikins’ analysis of the Saskatchewan Farm Security Act. A non-Canadian entity can hold up to 320 acres if Saskatchewan residents own the majority of its voting shares, and pension plans and most trusts are barred outright from acquiring Saskatchewan farmland regardless of size. Buyers who fall outside the limits can apply to the Farm Land Security Board for an exemption order; the filing fee runs from $50 up to a $200 cap, and reviews are typically completed within six weeks. Every other province sets its own thresholds, so check the relevant provincial agriculture ministry or land ownership board before making an offer — Ontario and the Atlantic provinces, for instance, have materially different rules than Saskatchewan’s. For a Canadian government data source rather than a lender’s press release, Statistics Canada’s table on the value per acre of farm land and buildings tracks per-province figures annually, benchmarked to the Census of Agriculture using FCC’s survey data between census years.
Is Farmland a Good Investment? What the Total-Return Data Shows
The clearest benchmark for farmland as an asset class is the NCREIF Farmland Property Index, a quarterly series tracking institutional farmland holdings (mostly pension-fund owned) acquired purely for investment. For 2025, the Total Farmland Index returned 0.20%, made up of a 3.05% income return and a −2.80% capital return, according to AgIS Capital’s State of Returns report, which breaks down the NCREIF data by crop type. Annual cropland (row crops replanted each season) returned 3.52% in 2025 — its capital return was 0.52% and its income return, at 2.99%, was the lowest on record for that sub-index. Permanent cropland (orchards, vineyards) returned −5.43%, dragged down by an 8.48% capital decline; the Almond Index fell 4.43% for a sixth straight year, which AgIS ties partly to weak surface-water rights and orchard removals tied to California’s Sustainable Groundwater Management Act.
NCREIF updates the index every quarter, and redistribution of the raw data requires contacting NCREIF directly, so treat 2025’s 0.20% as one data point in a longer series rather than a permanent verdict — check the NCREIF Farmland Property Index page for the most recent quarter before deciding anything based on this figure alone.
Best Farmland for Investing: Comparing Regions by Yield, Not Just Price
“Best” farmland for an investor isn’t the most expensive per acre — it’s the acre that returns the most cash relative to what you paid for it. You can approximate this yourself with public NASS figures: divide the published cash rent for a state by its published cropland value per acre. That implied cash-rent yield is a starting point, not a substitute for underwriting a specific parcel’s soil type, drainage, and water rights, but it separates land priced for appreciation from land priced for income.
| Region | Cropland value ($/acre, 2026) | Cash rent ($/acre/yr, 2026) | Implied cash-rent yield |
|---|---|---|---|
| Nebraska | $6,960 | $227 | 3.26% |
| U.S. average | $6,020 | $160 | 2.66% |
| Illinois | $10,200 | $261 | 2.56% |
| Iowa | $10,700 | $271 | 2.53% |
| Ohio | $10,100 | $188 | 1.86% |
| California (irrigated cropland) | $21,500 | $331 | 1.54% |
Nebraska’s cropland is priced for a materially higher cash yield than the Corn Belt states carrying the highest per-acre prices — Iowa and Illinois trade at a premium partly on appreciation expectations and soil quality, not current rent alone. California’s irrigated cropland, at $21,500 per acre against $8,150 for non-irrigated cropland in the same state, illustrates the opposite case: water access alone roughly triples the asking price without tripling the rent it commands.
Investing in U.S. Farmland: Financing, Foreign-Buyer Rules, and Due Diligence
Buying land in the United States means underwriting the region for both value trend and cash flow, using the state-level figures above as a starting point, then verifying them against a specific parcel’s soil survey, water rights, and lease history. On the foreign-ownership side, the U.S. Department of Agriculture requires disclosure — not prior approval — of agricultural land acquired by foreign persons under the Agricultural Foreign Investment Disclosure Act of 1978 (AFIDA). As of December 31, 2024, foreign investors held an interest in 46 million acres of U.S. agricultural land, an increase of 1.3 million acres from the year before, with Canada, the Netherlands, Germany, and the United Kingdom as the largest foreign holders, according to the USDA Farm Service Agency’s AFIDA announcement, published alongside an online portal for filing these disclosures starting January 2026. Several individual states layer on their own restrictions or outright bans for certain foreign entities on top of the federal disclosure requirement, so confirm the rule in the specific state before closing.
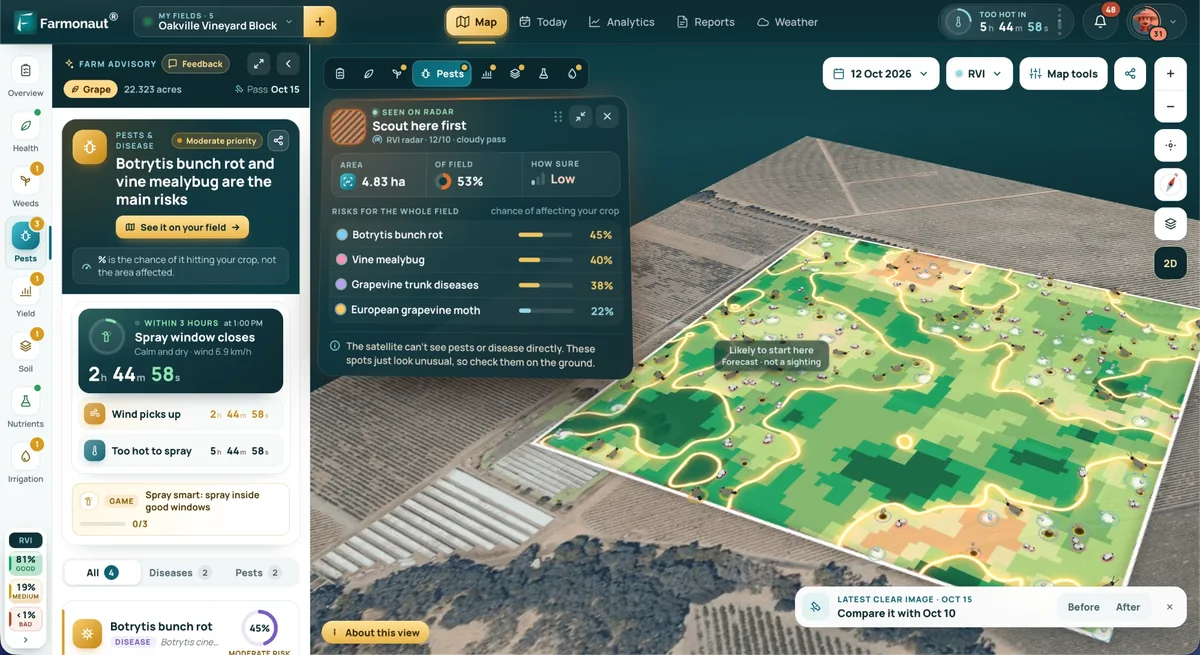
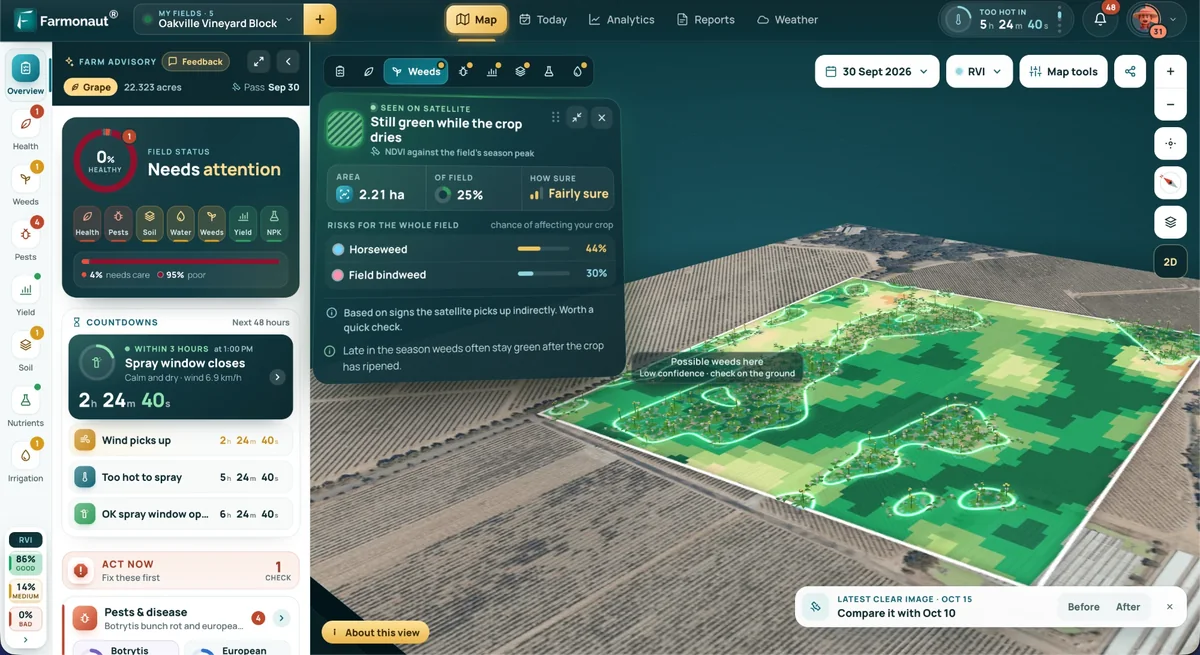
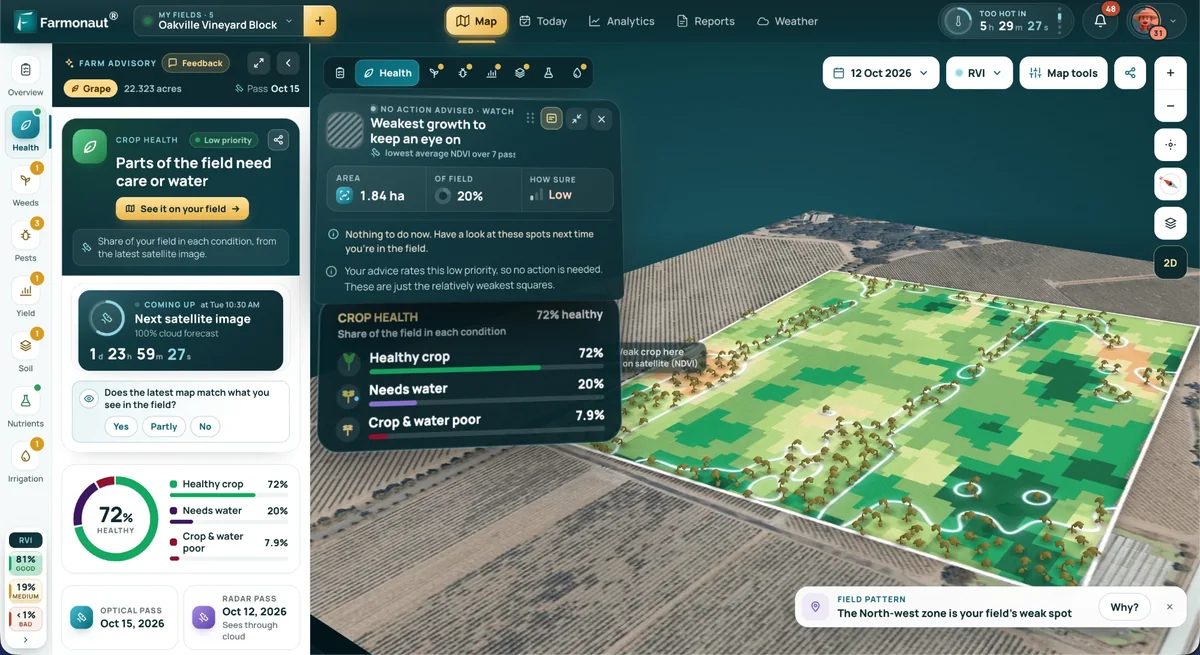
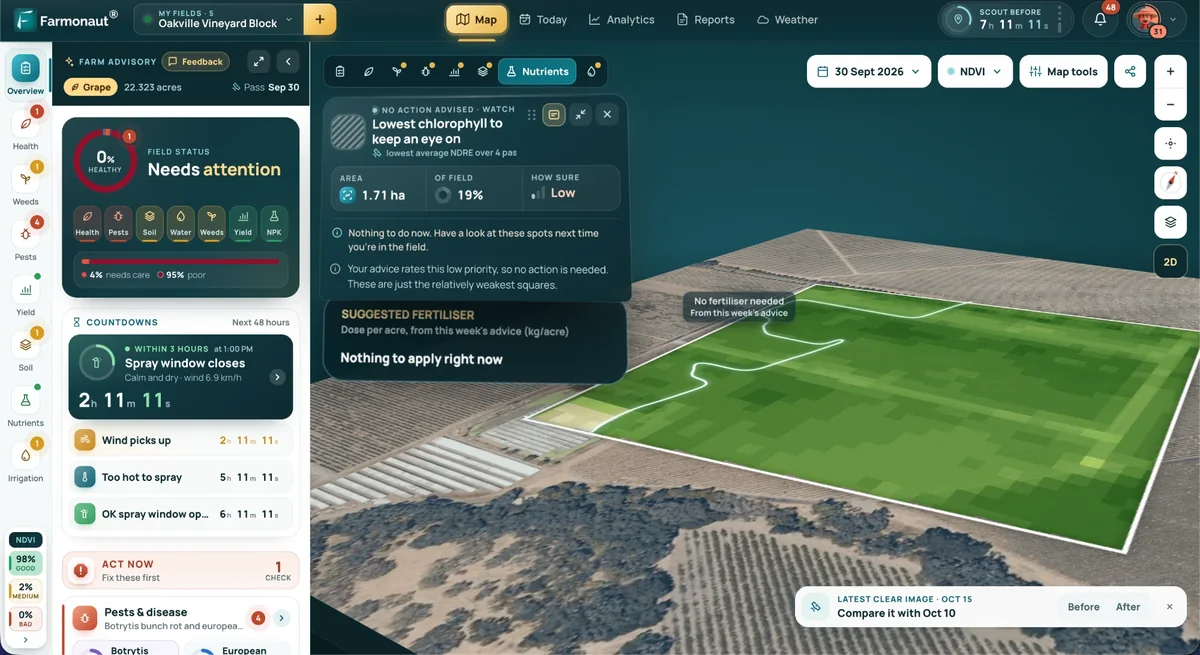
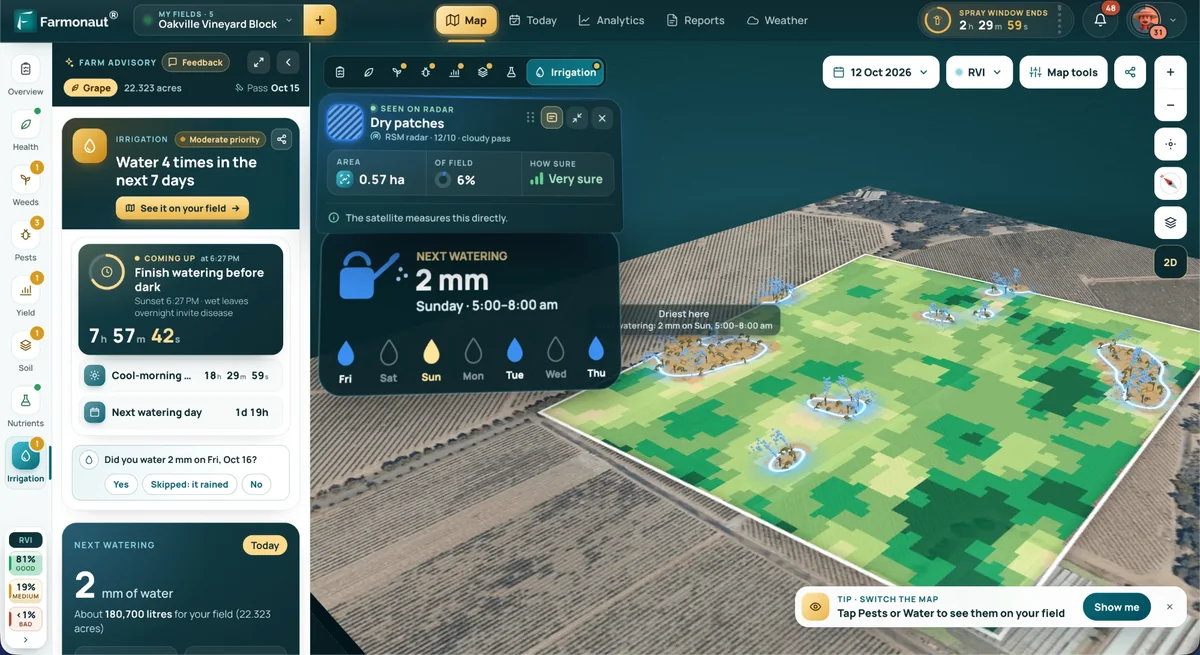
Verifying a parcel’s actual acreage, boundaries, and cropped condition before you buy is the same problem the EU is solving for subsidy claims with mandatory digital agriculture and geotagged-photo verification — an investor doing due diligence on a U.S. or Canadian parcel can use the same satellite tools to cross-check a seller’s acreage and vegetation-health claims independently. Farmonaut’s satellite API and API developer docs pull vegetation-index and field-boundary data that can flag a parcel with degraded soil health or overstated cropped acreage before you sign.

Farmland Cash-Rent Yield Calculator
Run your own numbers against a specific parcel using the figures cited above as a starting point:
Enter your figures above to see results.
Farm Investing Beyond Land: REITs, Crowdfunding, and Farm Operations
Buying acreage outright isn’t the only route into farm investing. Publicly traded farmland real estate investment trusts, such as Farmland Partners (NYSE: FPI) and Gladstone Land (Nasdaq: LAND), let investors buy shares backed by leased farmland portfolios without a land purchase; check each company’s most recent SEC filings and investor-relations pages directly for current share price, dividend yield, and portfolio acreage, since those change continuously and neither is covered by the NASS or FCC data above. Equity crowdfunding platforms offer fractional ownership of specific parcels with lower minimums than buying a farm outright, though minimum investment amounts, fee structures, and liquidity terms vary by platform and should be confirmed on each platform’s own disclosure documents before committing capital.
Whichever route you choose, returns lean heavily on operating efficiency once you own or lease the land. Modernizing agricultural operations with sensor and satellite data, adopting digital farming tools for irrigation and input timing, and using satellite crop monitoring — proven at scale on row crops in Brazil’s Mato Grosso — are the levers that move a tenant’s yield, and by extension a landlord’s rent-paying capacity, independent of the broader price cycle. Advanced precision-farming techniques are also spreading well beyond North America, cutting input waste on cropland globally rather than staying confined to any one country.
Track a farmland investment’s field-level health with Farmonaut’s satellite tools:




Not every farmland market runs on private capital and cash rent the way North America’s does. EU member states fund modernization largely through Common Agricultural Policy subsidies rather than investor return expectations; see our coverage of agriculture in Cyprus for how that subsidy-driven model compares. On the smaller-scale end, some investors skip row-crop acreage altogether for peri-urban or community-supported plots — our piece on urban agriculture benefits covers that alternative, and high-precision farming methods illustrate how far intensive-acreage techniques can push output per acre when land itself is scarce.
U.S. vs. Canada Farmland Investing: At a Glance
| Metric | United States | Canada |
|---|---|---|
| Primary benchmark | USDA NASS Land Values report, published each August | Farm Credit Canada Farmland Values Report, published each spring |
| Latest headline figure | Farm real estate $4,500/acre (+3.4%); cropland $6,020/acre (+3.3%) — 2026 report | National average value +9.3% — 2025 report, released March 2026 |
| Fastest-growing region cited | Southeast +4.3%, Southern Plains +4.2% (2026) | Manitoba +12.2%, Alberta +11.4% (2025) |
| Foreign-buyer rules | Federal disclosure via AFIDA (46 million acres foreign-held, Dec. 2024); added restrictions vary by state | Set per province; Saskatchewan caps non-residents at $15,000 assessed value, non-Canadian entities at 10 acres |
| Institutional return benchmark | NCREIF Farmland Property Index: +0.20% total return in 2025 (income +3.05%, capital −2.80%) | |
FAQ
Q: Is farmland investing in Canada still worth it after a 9.3% 2025 gain?
A: It depends on the province and how you enter. Manitoba and Alberta grew fastest (12.2% and 11.4% in 2025), while British Columbia fell 1.7% despite the highest per-acre values in the country, per Farm Credit Canada. A national growth rate hides that spread, so evaluate the specific province’s trend and its ownership rules before comparing it to the U.S. figures above.
Q: What is the best farmland for investing — Corn Belt states or cheaper regions?
A: On implied cash-rent yield, Nebraska (3.26%) beat both the U.S. average (2.66%) and the pricier Iowa and Illinois cropland (2.53% and 2.56%) in the 2026 NASS data. “Best” depends on whether you’re underwriting for cash income or long-term appreciation; the two don’t always point to the same state.
Q: How does farmland investing compare to buying farmland-REIT shares?
A: Direct ownership gives you the land’s cash rent and appreciation, minus your own carrying costs, financing, and management time. Farmland REITs like Farmland Partners (FPI) and Gladstone Land (LAND) trade like any public stock, with liquidity and no acreage minimum, but you take on share-price volatility and management fees instead of direct control; check their current filings for yield rather than relying on any figure that isn’t dated.
Q: Are there restrictions on investing in U.S. farmland as a foreign buyer?
A: The federal AFIDA law requires foreign owners to disclose agricultural land holdings to the USDA, but disclosure isn’t the same as prior approval, and some states add outright restrictions on top. Foreign investors held 46 million acres of U.S. agricultural land as of December 31, 2024, per the USDA Farm Service Agency, roughly 3% of all privately held farmland.
Q: How do I check whether these prices are still accurate?
A: USDA NASS republishes its Land Values report every August; Farm Credit Canada republishes its report every spring; and NCREIF’s Farmland Property Index updates quarterly. Re-run the cash-rent-yield formula in this article (rent ÷ price) against whichever fresh figures those sources publish next.

Farmonaut Subscriptions
Discussion
Questions, corrections or field experience? Share them below. First-time comments are reviewed before they appear, and your email is never published.
No comments yet. Be the first to add a question or your experience.

 BACF Africa
 Nivia
 Doodlakine
 Exurbia Geospatial
 FieldZero
 Indico Company
 Kubota
 FFBS
 Jontra
 Kalustyan
 Tucor
 Hayleys Agriculture
 Linx Agritech
 Licence holder · Niger · Gold