

Reviewed September 2026 against ISTAT, USDA ERS, and Bayer’s Annual Report 2025.
Try it: Run your own numbers →
Bayer Agriculture & Italy: Transport Rules That Pass Customs
Moving agriculture products across the Italy-EU border means matching two separate compliance chains at once: the crop-protection and seed inputs supplied by companies like Bayer, and the sanitary/traceability paperwork Italian and EU customs require for the harvested product itself. Get either one wrong and a truck sits at Brenner Pass or Ventimiglia while produce ages in the trailer. This guide covers both chains together, because in practice they are checked together — inspectors want to see what was applied to the crop and how the batch was documented, in the same file.
Two numbers anchor the scale here. Bayer’s Crop Science division reported €22.3 billion in net sales for 2024, according to Bayer’s Annual Report 2025 — that is the input side: seeds, crop protection chemistry, and digital farming tools that Italian and European growers apply before a single truck loads. On the output side, Italy’s agricultural production was valued at €74.6 billion at current prices in 2024, per ISTAT’s preliminary economic accounts. Every euro of that output eventually has to cross a border checkpoint, a port, or a rail yard, carrying documentation that traces back to what was used to grow it.
“Italy’s agricultural production value reached €74.6 billion at current prices in 2024 (ISTAT).”
Table of Contents
- Bayer Agriculture Products: What’s in the Input Chain
- Italy Agriculture Products: 2024 Output and What Moves Where
- Quality Preservation & Handling of Perishable Goods
- Regulatory Landscape and Compliance Essentials
- Logistics, Infrastructure & Grain/Bulk Transport
- IoT Precision Agriculture & Fertilizer Product Pricing
- Technology, Digital Tools & Risk Management
- Comparison Table: Italy vs EU Transport Requirements
- Border-Delay Cost Calculator
- Best Practices for Cross-Border Transport
- Farmonaut Satellite Solutions & Applications
- FAQ
- Conclusion
Bayer Agriculture Products: What’s in the Input Chain
“Bayer agriculture products” in a transport and compliance context means three categories: seeds, crop protection chemistry (herbicides, fungicides, insecticides), and digital farming tools. Bayer’s Crop Science division — the unit that covers all three — reported €22.3 billion in net sales for 2024, according to the company’s Annual Report 2025 filing on economic position by division. That figure sits inside Bayer’s broader group results and is the most current officially reported annual figure at the time of writing; Bayer publishes updated divisional results with each annual report, so check the Bayer Crop Science divisional report directly for the next reporting cycle’s numbers.
Why this matters for transport compliance specifically: every crop protection product applied to a field that later exports its harvest has to clear a destination market’s Maximum Residue Limit (MRL) before the shipment is accepted. This is not a Bayer-specific rule — it applies to every agrochemical manufacturer — but Bayer’s scale in the EU crop protection and seed market means Italian and wider European growers are more likely than not to have at least one Bayer-branded input somewhere in the batch record for a given field. Documentation showing exactly which product was applied, on which field, on which date, is what an inspector checks against the destination country’s MRL table.
- ✔ Input Traceability: Digital application registers — which product, which batch, which field, which date — are increasingly required rather than optional, and this is the same batch-record discipline covered under EU Regulation 178/2002 in the traceability section below.
- ✔ Withdrawal Periods: Every crop protection product carries a pre-harvest interval; shipping before that interval has elapsed is a compliance failure regardless of how good the rest of the paperwork looks.
- ✔ Destination MRL Alignment: A product approved for use in Italy may still exceed the MRL threshold in a non-EU destination market — check the destination country’s MRL table before, not after, the truck loads.
- Try it: Run your own numbers
Italy Agriculture Products: 2024 Output and What Moves Where
Italy’s agricultural production value reached €74.6 billion at current prices in 2024, per ISTAT’s preliminary estimate of agricultural economic accounts. Within that total, ISTAT reported crop product prices up 2.9% year-on-year, fruit production volume up 5.4%, and fresh vegetable production volume up 3.8% for 2024. Those three figures matter directly for transport planning: a volume increase in fruit and vegetables means more perishable-goods truck capacity is needed at the same harvest windows, and a crop-price increase changes the insured value that has to be declared on export documentation.
ISTAT publishes this preliminary estimate annually in January, with the next full report — including crop-specific yields per hectare — expected in January 2026. The press release summary used for the figures above does not break out yield-per-hectare by individual crop; that level of detail requires querying ISTAT’s statistical database directly rather than the press release. If you need current-year, crop-specific yield figures for a specific Italian region, that database query — not this article — is the correct source.
For background on Italian farmland structure, regional specialization, and 2025 trends feeding into these production figures, see Farmonaut’s dedicated Italian farmland trends and insights article — it covers the land-use side that this piece does not duplicate.

Quality Preservation & Handling of Perishable Goods
Perishable agricultural products — fresh fruits, vegetables, dairy, and meat — have strict handling requirements to minimize spoilage and maintain value from the field, through border checkpoints, to final markets. With Italy’s fruit volume up 5.4% and fresh vegetable volume up 3.8% in 2024 (ISTAT), the cold-chain capacity required to move that additional volume without loss has grown at the same pace.
Perishable Product Supply Chain: Key Steps for Quality Preservation
- Field Harvest: Timed to match optimum ripeness and immediate cold storage initiation.
- Packing: Use of standardized crates, pallets, and packaging designed to minimize damage and contamination.
- Pre-cooling: Rapid removal of field heat, typically within hours, to control temperature and extend shelf-life.
- Transport: Movement via refrigerated trucks, rail cars, or insulated containers to maintain controlled environments — cold chain discipline.
- Border Clearance: Efficient documentation and compliance minimize delays at checkpoints, reducing exposure to ambient conditions.
- Distribution Hubs: Transit through hubs with controlled atmosphere warehousing and sometimes further sorting, labeling, or packaging.
- Final Delivery: Timely delivery to retail, wholesale, or processing plants, with cold chain unbroken until the point of sale.
- ✔ Key Benefit: Consistent temperature monitoring throughout the journey reduces microbial growth and preserves freshness during long cross-border transport.
- ⚠ Risk: Deviations in cold chain or improper packaging lead to rapid spoilage and loss of product value, particularly for delicate produce like berries and leafy greens.
Critical Documents & Compliance for Preservation
- 📃 Sanitary Certificates: Verify product health and country of origin at every stage.
- 🔍 Batch Traceability Records: Trace products back to their batch, field, and harvest date, as required by EU Regulation 178/2002.
- 🏷 Labeling: Must be clear, compliant, and align with destination market requirements — languages, origin declaration, packaging codes.

- 🌡 Temperature Control: Continuous monitoring at 0-4°C for chilled produce, -18°C for frozen.
- 🔒 Sealed & Inspected Containers: Tamper-evident seals for transit security.
- 📦 Standardized Packaging: Crates and pallets optimized for both protection and easy inspection.
- 📑 Clear Documentation: All physical goods must be accompanied by correct export/import papers at every stage.
- 🛡 Insurance Coverage: Recommended for high-value perishable goods, factoring in spoilage and delay risks.
Regulatory Landscape and Compliance Essentials
The regulatory landscape for transporting agriculture products across borders features a detailed matrix of European Union harmonized standards and country-specific rules. Navigating these is vital for timely, legal, and efficient shipments of Italy agriculture products and inputs sourced from suppliers like Bayer into wider European markets and beyond.
EU and National Regulatory Requirements
- ✔ Sanitary & Phytosanitary Controls: Prevent the spread of animal and plant diseases by requiring veterinary or plant health certificates.
- ✔ Veterinary Inspections: Mandatory for dairy, meat, and animal-origin foods at designated border checkpoints or inspection posts.
- ✔ Conformity Checks: Certain fruit and vegetable consignments must conform to destination country standards; pre-clearance by recognized producer organizations can expedite handling.
- ✔ Compliant Labeling: All goods must be correctly labeled with country of origin, product data, traceability codes, and compliance marks.
- ✔ Chemical Residue Limits: All crop protection products — including those from Bayer’s agriculture portfolio — must adhere to Maximum Residue Limits applicable in destination markets.
Documentation: Minimizing Delays & Ensuring Batch Traceability
- • Export Declarations: Standardized forms for customs authorities.
- • Origin Declarations: Required for preferential tariff access, e.g. the EUR.1 Movement Certificate for EU-internal trade.
- • Health Certificates, Lab Results: For animal, dairy, and plant shipments.
- • Batch Records: Blockchain-based traceability (see Farmonaut’s traceability offering) is increasingly favored by EU and global buyers, and covers the same input-to-shipment chain described in the Bayer section above.

Harmonized Regulations, But Watch Local Nuances
- ✔ EU-wide Harmonization: Most sanitary and phytosanitary regulations are harmonized, but Italian authorities routinely request additional regional documents, especially for PDO/PGI labeled products.
- ✔ Trusted Trader Schemes: Recognized producer organizations or exporters with strong compliance track records can qualify for simplified clearances.



Logistics, Infrastructure & Grain/Bulk Transport
Agricultural logistics means more than just moving goods from Point A to Point B. In Italy, effective supply chain management relies on a robust infrastructure that integrates road, rail, river, and sea networks — serving production areas, distribution hubs, and export ports connecting to the greater European market.
Networks & Multimodal Options: Reducing Costs & Improving Speed
- ✔ Road and Rail Integration: Most goods move first by road to collection hubs (e.g., Milan, Verona), then onward by refrigerated rail to southern Italy or EU borders.
- ✔ Short-Sea Shipping: Cost-effective alternatives for large, consolidated loads to Greece, Spain, and North Africa.
- ✔ Cold Chain Warehousing: Centralized, climate-controlled warehouses reduce in-transit storage time and minimize spoilage risk.
- ✔ Real-Time Tracking: GPS and IoT-enabled systems give granular visibility into temperature, humidity, and location during cross-border journeys.
- ✔ Distribution Hubs: Major centers act as checkpoints for compliance, sorting, and sometimes further processing — labeling or packaging to destination-market specs.
For readers specifically asking about transporting a grain truck: bulk grain movement in the US runs on a separate cost structure from the refrigerated perishable-goods routes described above — grain moves in hopper trucks or unit trains without cold-chain requirements, but is bound by state-level weight limits and DOT hours-of-service rules. USDA’s Agricultural Marketing Service publishes a quarterly Grain Transportation Report covering barge, rail, and truck rates; that report — not this article — is the correct source for current per-mile or per-bushel grain trucking costs, since exact current rates were not available for this review. Check the USDA AMS Grain Transportation Report directly for the current quarter’s figures before budgeting a route.

Infrastructure Challenges: Italian vs. Regional EU Context
- Geographic Diversity: Northern Italy’s Po valley is flat and enables easy movement, but mountainous central/southern regions often rely on tunnel-bridged roads or slower rail links.
- Port Facilities: Efficient, tech-enabled ports at Genoa, Trieste, and Naples are vital for both import and export of perishable agricultural products.
- Border Crossings: Italian border posts to Austria, France, Switzerland, and Slovenia remain subject to periodic controls in sync with updated EU-wide security and health measures.
IoT Precision Agriculture & Fertilizer Product Pricing
Two adjacent input categories affect how much a shipment costs to grow and prepare before it ever reaches a truck: IoT precision-agriculture hardware and fertilizer products. Both are directly measurable and both change on a schedule worth knowing.
USDA’s Economic Research Service reports that 27% of US farms used precision agriculture practices in 2023, and that adoption climbs sharply with farm size — 70% of large-scale crop farms used autosteering systems on tractors in 2023, per the same USDA chart. The US IoT precision agriculture market was sized at $2.36 billion in 2024, growing at a 17.8% compound annual rate for 2024-2025, according to Market.us; hardware — sensors, devices, and communication equipment — made up 42.5% of that market in 2024. Precision agriculture adoption is tracked biennially by USDA NASS through the Census of Agriculture, with the next cycle running in 2025 and results releasing in 2026 — that census, not a market forecast, is the authoritative adoption figure once published.
On fertilizer: urea, the primary nitrogen fertilizer, priced at $492 per ton spot at the US Gulf in January 2025, according to USDA ERS. Monoammonium Phosphate (MAP, 11-52-0) averaged $1,201 per ton over 2024-2025, per USDA’s Agricultural Marketing Service. Urea spot prices update weekly, published every Monday on USDA AMS’s Cotton and Grain Market News; check that report directly for the current week’s number rather than relying on the January 2025 figure above as a current price.

Technology, Digital Tools & Risk Management
Risk management is inseparable from transporting agricultural products across borders. Digital tools, real-time monitoring, and blockchain-based traceability provide new reliability layers in traditionally variable supply chains.
Digital Transformation: Visibility & Compliance
- ✔ Real-Time Monitoring: IoT sensors, RFID tags, and satellite tracking monitor temperature, location, and shock/vibration during transit.
- ✔ AI-Based Route Optimization: Minimize transit times and avoid known bottlenecks at border checkpoints using historical and real-time data.
- ✔ Blockchain Traceability: Batch-level traceability with tamper-resistant records, enabling quick response to audits or food safety incidents — see Farmonaut’s traceability solution.
- ✔ Data-Driven Forecasting: Anticipate demand spikes, regulatory changes, and weather risks to better plan batch shipments.
Major risk categories for cross-border agricultural product transport, and practical digital mitigations:
- ⚠ Spoilage and Loss: Cold-chain failure or contamination — mitigate with real-time temperature sensors and alerting.
- ⚠ Compliance Failures: Regulatory changes or missing paperwork — mitigate with digital document management and compliance monitoring via apps.
- ⚠ Delays & Disruptions: Weather, strikes, or border closures — mitigate with predictive analytics and contingency route planning.
- ✔ Build Buffer Stocks: Near border or distribution hubs, ready for rapid distribution in case of lengthy inspections.
- ✔ Secure Insurance Coverage: Specify coverage for perishables, compliance delays, and force majeure scenarios.
- ✔ Maintain Strong Communication: Share real-time shipping data with all value chain partners — suppliers, processors, transporters, retailers.
Comparison Table: Italy vs. EU Transport Requirements
| Transport Criteria | Italy | General EU |
|---|---|---|
| Documentation | Detailed export, sanitary, and origin certificates. Regional labeling for PDO/PGI required. | EU-wide harmonized sanitary and origin declarations; member state specifics vary. |
| Temperature Control (Perishables) | Strict monitoring, especially for fresh produce. Cold chain from field to border and beyond. | EU standard: 0-4°C for chilled, -18°C for frozen. |
| Traceability Regulations | Batch-level traceability and blockchain increasingly recommended; strict batch/country documentation expected. | EU Regulation 178/2002 enforces batch traceability for all member states. |
| Estimated Transit Time | 2–4 days (domestic/export border). Up to 5 days for southern routes. | 3–7 days (cross-border average EU routes). |
| Common Inspection Points | Milan, Verona, Genoa, Naples, Trieste, Northern border crossings (Ventimiglia, Brenner Pass, Tarvisio). | Major EU gateways: Rotterdam, Hamburg, Paris Rungis, Vienna; relevant member state borders. |
| Typical Costs per Ton | €80–€120 (short/medium distance, cold chain and compliance included). | €100–€150 (longer distances, higher compliance/traceability system costs). |
| Labeling & Packaging | Dual-language for many exports; strict adherence to regional PDO/PGI/organic standards. | Commodity and country language, origin, allergen info per EU labeling rules. |
| Transport Modes | Road dominates; strong rail & short-sea shipping for large loads. | Road primary; expanded rail and multimodal growth ongoing. |
- 🚚 Milan: Northern agribusiness hub
- 🚁 Verona: Main fruit/veg export node
- 🚢 Genoa/Trieste: Sea export gateways
- 🚆 Brenner Pass: Key EU-crossing railway
Border-Delay Cold Chain Cost Calculator
Use the typical per-ton transport cost ranges above alongside your own shipment weight and expected delay to estimate the added holding cost of a border inspection hold.
Run your own numbers
Best Practices for Transporting Agriculture Products Across Borders
- Maintain Cold-Chain Discipline: Strictly control temperature from harvest to final destination — real-time digital logging is recommended.
- Compliant Labeling & Documentation: Label every item with origin, destination, product codes, and batch-level traceability, digitally managed when possible.
- Align Production & Planning: Schedule harvest and shipments to complement market demand cycles — avoid gluts and shipping perishable goods out of season.
- Invest in Multimodal Logistics: Use road for flexibility, rail for cost and eco-savings, and short-sea/river routes where volumes permit.
- Leverage Digital Monitoring Tools: Use platforms like Farmonaut for traceability, compliance checks, and environmental tracking.
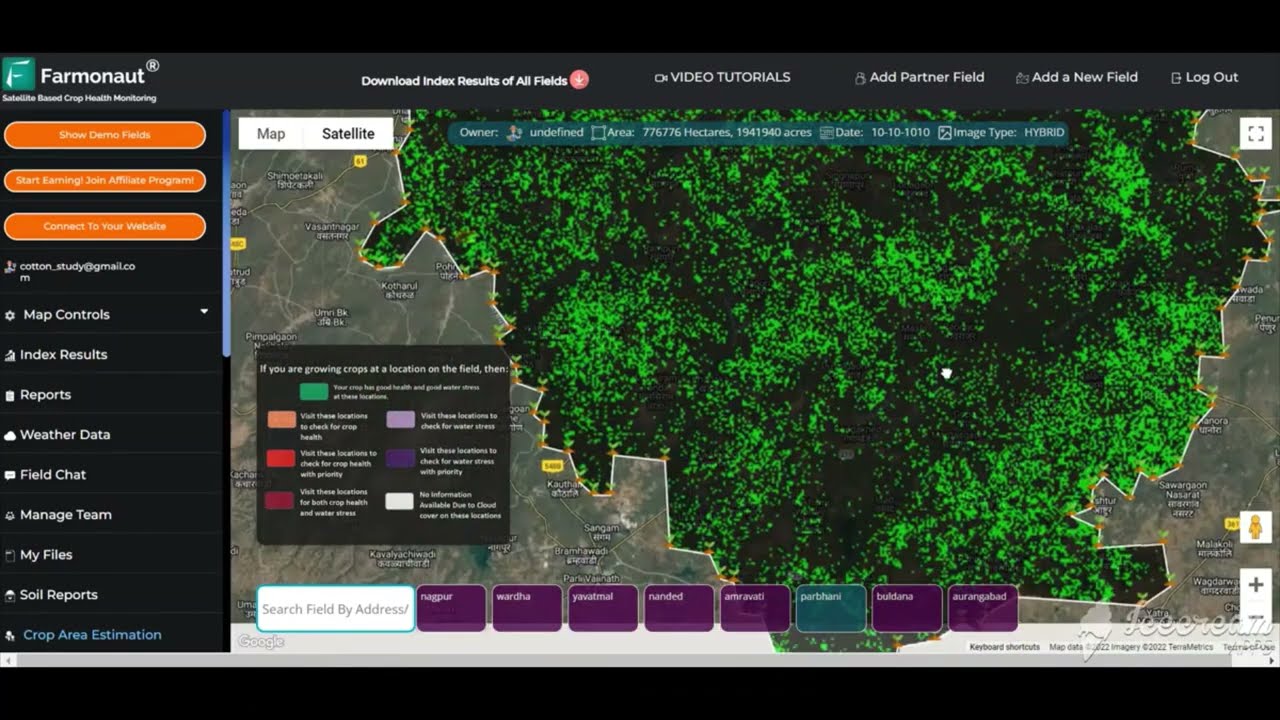
Farmonaut Satellite Solutions & Applications
At Farmonaut, we provide a suite of satellite-driven solutions ideal for producers, logistics companies, agribusinesses, and financial/insurance institutions working in cross-border agricultural supply chains:
- ✔ Satellite-Based Real-Time Monitoring: Assess large-scale field conditions & crop health to optimize harvest and batch planning for cross-border exports.
- ✔ Blockchain Traceability Platform: Digitally record every transaction — from farm field, to processing hub, to final destination — ensuring compliance, rapid audits, and response capability (more here).
- ✔ Environmental Impact Monitoring: Automated carbon footprinting and compliance reporting tools keep you ahead of sustainability demands.
- ✔ AI-Driven Advisory (JEEVN AI): Real-time weather, crop, and logistics advice personalized to Italian, EU, and US farming needs (see JEEVN AI tutorial above).
- ✔ Fleet & Resource Management: Optimize machine/vehicle fleet management for reduced costs, improved safety, and delivery reliability — including grain truck fleets.
- ✔ Financial Access: Streamline satellite-based crop loan & insurance verification for instant eligibility checks, reducing fraud and risk.
- ✔ Developer Tools & API: Integrate our data into your systems with the Farmonaut API (developer docs).

Farmonaut Subscription Options
We offer flexible pricing through our subscription-based platform. Choose a plan for your business, government, or personal needs — scale as you grow, or integrate with web, mobile, or API access.
Frequently Asked Questions
A1. Seeds, crop protection chemistry, and digital farming tools from Bayer's Crop Science division, which reported €22.3 billion in net sales for 2024 (Bayer Annual Report 2025). What matters for transport is the documentation showing which of these inputs was applied to a given field, since destination markets check Maximum Residue Limits against that record before accepting a shipment.
Q2. What is Italy's agricultural production value, and how does it affect transport volume?
A2. €74.6 billion at current prices in 2024, per ISTAT's preliminary estimate, with fruit volume up 5.4% and fresh vegetable volume up 3.8% year-on-year. Higher output volume in perishable categories means more cold-chain truck and rail capacity is needed within the same seasonal harvest window.
Q3. How widely are agriculture IoT products used, and what do they cost?
A3. 27% of US farms used precision agriculture practices in 2023, rising to 70% adoption of autosteering among large-scale crop farms, per USDA ERS. The US IoT precision agriculture market was valued at $2.36 billion in 2024 with 17.8% CAGR into 2025, per Market.us; hardware made up 42.5% of that market.
Q4. What do agriculture fertilizer products cost right now?
A4. Urea priced at $492/ton (US Gulf spot, January 2025, USDA ERS), and MAP (11-52-0) averaged $1,201/ton over 2024-2025 (USDA AMS). Urea prices update weekly via USDA AMS market news — check that report for the current week's figure rather than relying on a fixed number.
Q5. Are Italian and EU regulations for agricultural transportation significantly different?
A5. Most regulations are harmonized across the EU — food safety, sanitary controls, batch traceability under EU Regulation 178/2002 — but Italy requires additional labeling for PDO/PGI certified products and sometimes regional specialty documentation.
Q6. Can satellite technology improve traceability and risk management in agricultural logistics?
A6. Yes. Solutions like Farmonaut provide satellite-based real-time field monitoring, blockchain-backed supply chain records, and predictive risk management for perishables across borders.
Q7. What are best practices to optimize cross-border agriculture product shipments?
A7. Use digital tools for monitoring and compliance, plan batch harvests aligned to destination demand, prepare comprehensive documentation, select trusted logistics partners, and maintain transparent communication across the value chain.
Conclusion
The two chains covered here — Bayer's crop-input compliance trail and Italy's agricultural output moving across EU borders — meet at the same customs desk. An inspector checking a truck of Italian produce wants to see the input record (what was applied, when, and whether it clears the destination MRL) alongside the batch traceability record (which field, which harvest date, which sanitary certificate). Getting one right without the other still stops the truck.
The figures that anchor this — €22.3 billion in Bayer Crop Science 2024 net sales, €74.6 billion in Italy's 2024 agricultural output, $492/ton urea, 27% US precision-agriculture adoption — will all be superseded by the next reporting cycle. Bayer republishes divisional results annually; ISTAT republishes its agricultural accounts every January; USDA ERS updates fertilizer prices weekly and precision-agriculture adoption every two years via the Census of Agriculture. The durable part of this article is not the numbers — it's the method: check input documentation against destination MRLs before harvest, check batch records against EU Regulation 178/2002 before the truck loads, and re-pull each figure from its named source on the schedule given above rather than trusting last year's number.

 Godrej Agrovet
 Hayleys Agriculture
 Linx Agritech
 Adinet
 Save Your Soils
 GalaxEye Space
 Grandstream Algérie
 XOS Realty
 Geospatial Lab Africa
 Agro La Gándara
 HIPSAC
 ZOL Zimbabwe
 Juligerm
 AdBio
AdBio MISE Maroc
 NWNS
NWNS Red August Group
 Farm Inc
 WeMe Global
 Agrotoken
 Blue BearX
 Insignito
 DnCubed
 Indosistim Teknologi
 Liquify Digital
 CU Foods
 BeyondTech Global
 Rouge VC
 AgroRisk
 Oath Inc
 Esri North East Africa
 MDCV UK
 Etech Consulting Madagascar
 Vestlandsforsking
 WB Dev
 Sama Premium
 Tres Valles
 Blickwinkel
 Agricultural Credit Policy Council
 eKGIS
eKGIS Mostas Tech
 Andex
Andex Deluxe Conseil
 WICO
WICO Chimera Innovation
 SkyHarvest
 Teledarbas
 Exurbia Geospatial
 FieldZero
