

Reviewed September 2026 against USGS Mineral Commodity Summaries, MarketsandMarkets, and RTS Labs’ mining AI benchmarks.
Try it: Run your own numbers →
Big data analytics in mining means applying sensor streams, historical failure records, and machine-learning models to three specific decisions: when to service equipment before it breaks, how much ore is actually recoverable from a block, and where cost is leaking out of the supply chain. Two figures come up most often. RTS Labs, a software consultancy, puts the downtime cut from predictive maintenance at 10-30%, and Boston Consulting Group reported in January 2026 that mature mining sites using AI see 2-5% throughput gains and 2 to 4 point margin improvements.
This is not a survey of what analytics could someday do. It’s a breakdown of what’s been measured, what a US mining operation should expect to pay when it doesn’t have this in place, and a calculator below that runs your own downtime numbers instead of an industry average.
Summary: What Big Data Analytics in Mining Actually Delivers
Big data analytics in mining is the application of sensor data, historical maintenance logs, geological models, and market data to five operational problems: equipment reliability, safety monitoring, environmental compliance, supply chain planning, and mineral exploration accuracy. The reported gains — a 10-30% downtime reduction (RTS Labs, a consultancy estimate) and a 2-5% throughput increase (BCG, January 2026) — come from sites that have already deployed the tooling, not industry-wide averages. The US AI-in-mining market is forecast to grow at a 19% compound annual rate through 2032, according to MarketsandMarkets, which signals where investment is heading rather than what any single site should expect to spend. This article breaks down each application area with the figures that exist, flags the ones that don’t, and gives you a calculator to run against your own equipment costs.
The Scale of US Mining Data and Why Analytics Now Pays Off
US mining output is large enough that small percentage gains translate into real dollars. The US produced roughly 160 tons of gold in 2024, valued at $12 billion, and about 1.1 million tons of recoverable copper, valued at $10 billion, according to the USGS Mineral Commodity Summaries 2025. Against production values of that size, a 2-5% throughput gain from analytics-driven process control is worth pursuing on its own — before counting the downtime savings.
What’s not published is a single figure for how much data US mining companies generate annually, or what share of revenue goes to analytics infrastructure. Those numbers don’t exist in any source reviewed for this article. If you need them for your own operation, the practical path is to total your own SCADA, fleet-telemetry, and sensor data volumes internally — there is no external benchmark to compare against yet, and any number you see quoted for “industry-wide mining data volume” should be treated as unsourced until you can trace it to a named study.
Mining industry data and analytics spend is easier to track at the market level than the operational level: MarketsandMarkets’ US AI in Mining Market report projects a 19% CAGR through 2032, and cites a related High Performance Data Analytics market reaching $158.4 billion by 2031. Those are market-size forecasts, not per-site budgets — treat them as a directional signal that investment is accelerating, not as a number to plug into your own capital plan.
Where Mining Data Comes From
Big data in the mining industry is not one dataset. It is several streams, each owned by a different team, that rarely share a common format.
| Source | What it records | Typical use |
|---|---|---|
| Fleet management systems | Truck and shovel position, payload, cycle times, fuel | Dispatch, haul-road planning, fuel control |
| Equipment condition monitoring | Vibration, temperature, oil analysis, engine fault codes | Predictive maintenance |
| Plant control systems (SCADA) | Crusher and mill power, flow rates, reagent use, recovery | Process control, throughput |
| Drilling and blasting | Drill penetration rate, blast design, fragmentation | Blast optimisation, ore boundaries |
| Geology and assays | Drill-hole logs, assay grades, block models | Resource estimation, grade control |
| Remote sensing | Satellite and drone imagery, surveys | Exploration, stockpile volumes, environmental monitoring |
| Safety systems | Gas monitors, ground movement sensors, worker location | Alarms, risk mapping |
Most of the value comes from joining two or more of these. For example, linking payload data from the fleet system with mill throughput shows whether blasting changes actually speed up the plant. That join is usually the hardest part of a project, which is why data integration appears first in the list of challenges further down.
1. Operational Efficiency: Predictive Maintenance and Resource Estimation
Predictive analytics in mining works by feeding sensor telemetry — vibration, temperature, oil analysis, load cycles — and historical failure records into machine-learning models that flag which components are trending toward failure. The reported payoff: a 10-30% reduction in unplanned downtime, per RTS Labs, and 2-5% throughput gains at mature sites, per BCG (January 2026).
The dollar case for closing that gap is direct. Software vendors publish their own estimates of what failures cost: Reliamag says equipment failure causes 42% of unplanned downtime, Innovapptive puts the average failure incident at $180,000, and FleetRabbit cites about $130,000 an hour for high-production assets. None of these is an audited industry statistic, so replace them with figures from your own maintenance records before building a business case.
- Predictive maintenance: Machine-learning models trained on sensor and failure-history data flag at-risk components before they fail, letting maintenance teams schedule service instead of reacting to breakdowns. It is the most widely reported application; RTS Labs cites a 10-30% downtime reduction.
- Resource estimation: Geospatial and remote-sensing data feed ore-grade models that replace manual sampling with continuous, updatable block models — reducing the gap between predicted and actual recoverable tonnage. No published US-specific ROI figure exists for this application separate from overall throughput gains; treat the 2-5% throughput number as the closest available proxy until a dedicated study is published.
- Process optimization: Real-time dashboards surface bottlenecks across blasting, hauling, and processing stages, feeding the same throughput gains cited above.

Mining equipment reliability is where this pays fastest, because failure cost is already well documented per incident. If you run a fixed number of major assets, the calculator further down this page converts your own fleet size and failure cost into an estimated annual savings range using the 10-30% RTS Labs band — not an assumed number.

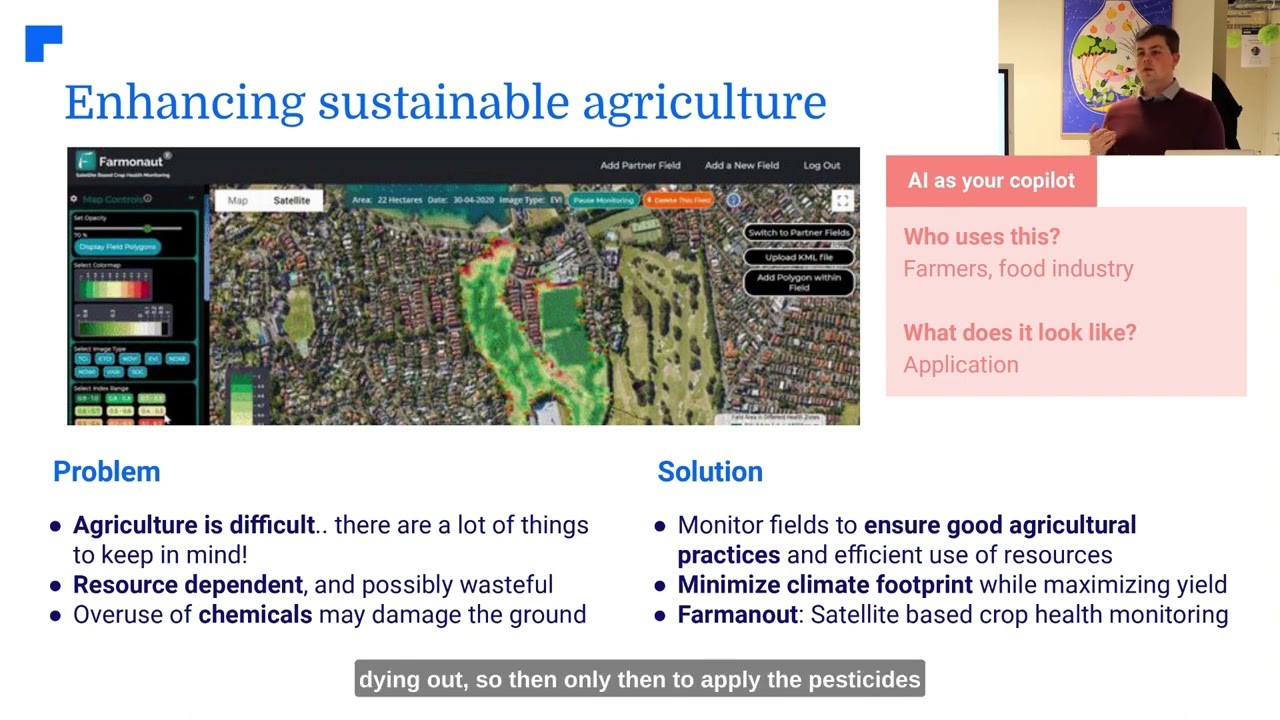
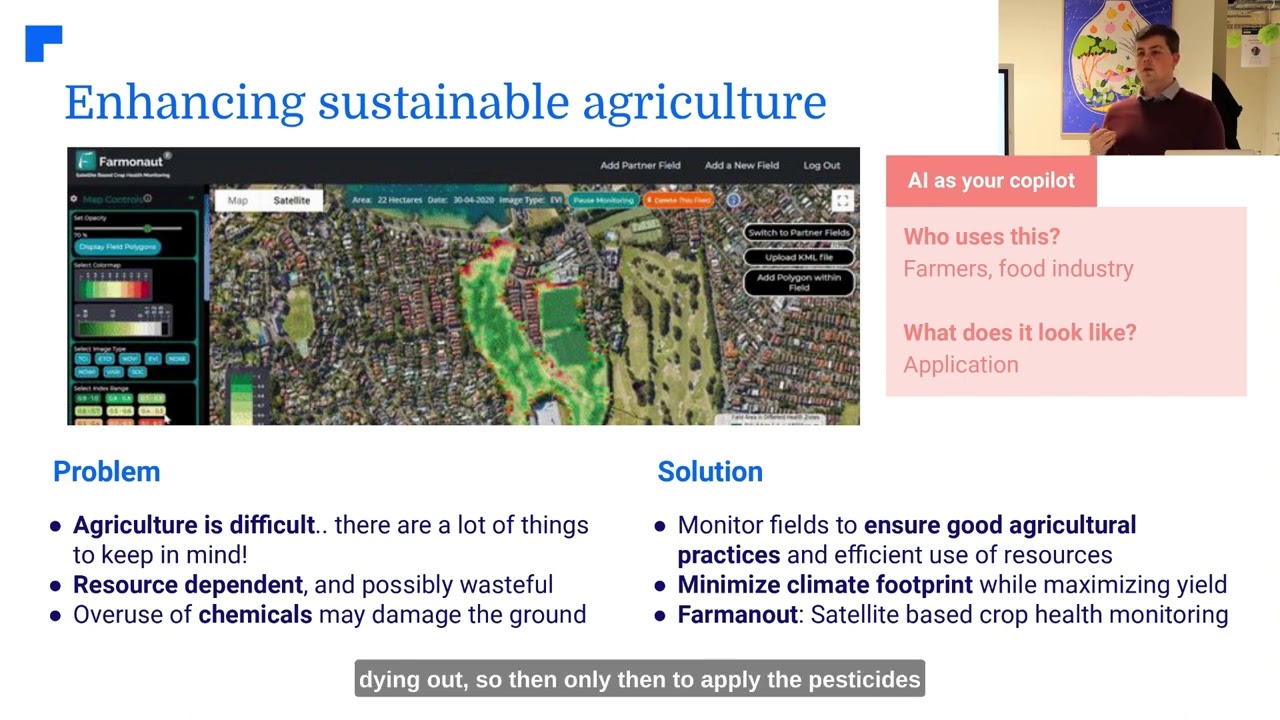
Access real-time mining operations monitoring and resource management with Farmonaut’s cloud-based platform. Our app empowers users to oversee exploration, extraction, and environmental compliance—all through an intuitive dashboard.


Monitor mining activities on-the-go with Farmonaut’s Android and iOS apps—advanced analytics in your pocket. Explore how large scale field management benefits from satellite-driven insights.
2. Safety and Risk Management Through Advanced Analytics
Real-time monitoring for gas concentration, seismic activity, and equipment status is the safety application of big data analytics in mining most directly tied to the same downtime and failure data covered above — a piece of equipment trending toward mechanical failure is also a safety exposure, not just a cost line.
- Real-time monitoring: Wearables and fixed sensors stream worker location, air quality, and structural data; analytics platforms flag anomalies for immediate response.
- Predictive risk models: Historical incident data combined with live environmental variables identifies risk hotspots ahead of an event, rather than after one.
- Emergency response modeling: Simulation against historical and live data shapes response plans for landslides, underground fires, or gas events.
There is no separate, published US mining-specific accident-reduction percentage tied strictly to safety-analytics deployment distinct from the downtime figures already cited — the two data streams (equipment condition and worker safety) run through the same sensor networks and the same predictive models. Where a company reports a standalone safety metric, check whether it’s audited by MSHA or self-reported before treating it as comparable across companies.


3. Environmental Sustainability, Nature Risk, and Regulatory Compliance
For large mining companies evaluating a nature risk analytics solution, the honest answer is that no peer-reviewed study with a quantified ROI figure for nature/ESG risk analytics specific to large US mining operations exists in the sources reviewed for this piece. ESG disclosure obligations are regulatory-driven — tied to SEC climate-disclosure rules and investor reporting requirements — but the return-on-investment literature for the analytics layer itself hasn’t caught up. If you’re evaluating vendors here, ask for site-specific before/after compliance-incident counts rather than an industry-wide ROI claim, because that data doesn’t exist yet at the industry level.
- Continuous environmental monitoring: Remote sensor networks track water quality, emissions, and soil integrity against compliance thresholds in real time.
- Emissions and carbon footprinting: Predictive models forecast — not just measure — emission trajectories, giving operators lead time to adjust before a threshold is breached.
- Reclamation and land restoration: Geospatial and machine-learning models plan and track post-extraction land restoration progress against a documented baseline.
- Regulatory compliance and community relations: Auditable, timestamped data trails support both regulatory filings and community trust — increasingly relevant as tailings management draws sustained regulatory attention following high-profile failures.
Farmonaut’s Carbon Footprinting Tool gives operators a way to track emissions and water use against their own baseline rather than an industry average — useful precisely because no external ROI benchmark exists yet for this category.

4. Strategic Decision-Making and Supply Chain Analytics
Mining analytics solutions aimed at supply-chain and strategic planning aggregate market data, price indices, and geopolitical signals to inform inventory, logistics, and workforce decisions — the layer of analytics least tied to a single equipment sensor and most tied to enterprise-wide data integration.
- Market intelligence: Analytics platforms track price indices and geopolitical risk to flag emerging supply or demand shifts.
-
Supply chain optimization: Predictive models track inventory and forecast delays across extraction, processing, and logistics.
Fleet and Resource Management Solutions from Farmonaut track vehicles and resource flow in real time, reducing logistics bottlenecks and fuel consumption. - Workforce analytics: Labor productivity, skill-gap identification, and health-parameter tracking for a safer, more efficient workforce.
- Traceability: Farmonaut Traceability uses blockchain to create auditable records of resource movement — relevant as buyers increasingly require sourcing documentation.
5. Edge Analytics, AI, and What’s Actually Deployable
Mining big data infrastructure is shifting from centralized cloud processing toward edge computing, where latency-sensitive decisions — equipment shutdown triggers, gas-leak alerts — get processed at the sensor rather than round-tripped to a data center. The US AI-in-mining market’s projected 19% CAGR through 2032 (MarketsandMarkets) reflects investment flowing specifically into this layer: edge inference, AI-driven advisory systems, and automated anomaly detection.
- Edge computing: Processing at the source cuts latency for safety-critical and equipment-critical alerts.
-
AI and machine learning: Models trained on historical and live streams support everything from mineral exploration targeting to adaptive process control.
Farmonaut API gives developers direct integration to satellite and analytics data for custom mining applications. - Remote sensing and satellite monitoring: Satellite imagery lets operators track large or remote sites and feed environmental data into planning models without a physical site visit.
-
Blockchain traceability: Securely links operational data with product movement across the supply chain.
Farmonaut API Developer Docs shows how modern mining software connects and automates these data streams.
To keep this current: MarketsandMarkets and Spherical Insights publish mining-technology market reports annually. Search “AI in mining market” plus the current year when you need an updated CAGR or market-size figure rather than relying on the 2032 forecast cited above once newer editions are published.



Comparative Impact of Mining Analytics Applications
The table below separates figures that are directly sourced from figures that remain estimates pending better published data — a distinction most industry roundups skip entirely.
| Application | Documented Figure | Source & Period | Status |
|---|---|---|---|
| Predictive maintenance downtime reduction | 10-30% | RTS Labs, 2024-2025 deployments | Sourced |
| Throughput gain from analytics/AI | 2-5% | BCG, January 2026 | Sourced |
| Average cost per equipment failure incident | $180,000 | Innovapptive, 2024-2025 | Sourced |
| Hourly cost of high-production asset downtime | $130,000 | FleetRabbit, 2024-2025 | Sourced |
| Share of unplanned downtime from equipment failure | 42% | Reliamag, 2024-2025 | Sourced |
| US AI-in-mining market growth rate | 19% CAGR through 2032 | MarketsandMarkets | Sourced (forecast) |
| Nature/ESG risk analytics ROI, large US mines | Not published | — | Gap — request site-specific vendor data |
| US mining-specific big data adoption rate | Not published | — | Gap — mining-specific figure unavailable |
Predictive Maintenance Savings Calculator
Run your own fleet size and failure cost against the documented 10-30% downtime-reduction range from RTS Labs’ 2024-2025 mining deployment data — instead of an industry-wide average that doesn’t reflect your equipment.
Run your own numbers
Assumptions: uses the $180,000 average failure-incident cost (Innovapptive) and $130,000 hourly downtime cost (FleetRabbit) as fixed constants; your own site’s costs will differ by equipment class and region. Excludes labor, parts, and secondary production losses beyond the direct downtime window. The 10-30% reduction range is RTS Labs’ documented range across 2024-2025 mining deployments, not a guarantee for any specific site.
How Farmonaut Fits Into a Mining Analytics Stack
Farmonaut provides satellite-driven monitoring and analytics aimed at making the exploration, environmental-compliance, and logistics layers of mining industry data and analytics accessible without a full in-house data-science build.
- Satellite-based monitoring: Multispectral imagery tracks mining sites, giving operators regular snapshots of land conditions, extraction progress, and environmental risk without a site visit.
- AI-driven advisory: The Jeevn AI system generates recommendations tied to operational efficiency, safety, and sustainability targets.
- Blockchain traceability: Auditable mineral supply-chain records support regulatory compliance and buyer trust.
- Environmental impact tracking: Real-time emission and environmental monitoring for documentation and reporting.
- Fleet and resource management: Logistics optimization and equipment/worker safety tracking at scale.
- Accessibility: Web, Android, and iOS apps put mining analytics tools directly into the hands of field operators, managers, and executives.
For coordinating assets across multiple sites, Farmonaut’s fleet management and large scale field management tools scale from a single pit to a multi-site portfolio.
Key Challenges for Big Data Integration in Mining Operations
Every gain described above assumes the data pipeline actually works end to end. In practice, five obstacles recur:
- Data silos: Legacy SCADA systems, newer IoT sensors, and third-party fleet-management platforms often don’t share a common data model, fragmenting the dataset before analysis starts.
- Workforce skill gaps: Mining companies compete with every other data-hungry industry for scarce data-science and ML talent.
- Cybersecurity and data privacy: Growing sensor networks expand the attack surface for operational and environmental data.
- Change management: Adoption resistance and process reengineering slow rollout regardless of the technology’s maturity.
- Cost and ROI timing: Upfront platform and integration costs are real, even where the documented 10-30% downtime reduction makes the case — smaller operators face a longer payback window than the figures above suggest on their own.
None of these five is solved by better analytics alone — each requires an organizational fix (data governance, hiring, security policy, training, budget staging) that a dashboard purchase doesn’t provide.
How to Start a Mining Analytics Project
Mines that get results usually start small and specific. A workable sequence:
- Pick one costly problem. A crusher that trips several times a month or a truck class with frequent engine failures is a better first target than “use our data better”.
- Measure the baseline. Pull 12 months of downtime hours, failure counts and repair costs from your own maintenance system. This is the number any result will be judged against.
- Check the data exists. Confirm the sensors on that equipment record at a useful frequency and that failure records are labelled consistently. Poor labels sink more projects than poor models.
- Run a time-boxed pilot. Set a fixed period and a target, then compare downtime against the baseline for the same equipment.
- Decide on evidence. Scale up only if the pilot beat the baseline by more than normal year-to-year variation.
Boston Consulting Group reported in January 2026 that sites with mature AI applications see 2-5% throughput gains and 2 to 4 point margin improvements. Your own pilot result is the figure that matters for your site.
Frequently Asked Questions
What is big data analytics in mining?
It’s the use of sensor data, historical maintenance records, geological surveys, and market data to drive five decisions: equipment maintenance timing, safety-risk detection, environmental compliance, supply-chain planning, and resource estimation. Reported results include a 10-30% downtime reduction (RTS Labs, a consultancy) and 2-5% throughput gains at mature sites (BCG, January 2026).
How much does predictive maintenance actually save in mining?
RTS Labs, a consultancy, cites 10-30% reductions in unplanned downtime. The calculator above uses vendor estimates of $180,000 per failure incident (Innovapptive) and $130,000 per downtime hour (FleetRabbit); treat its output as a rough guide and substitute your own costs where you can.
Is there a proven ROI figure for nature or ESG risk analytics in mining?
Not yet, at least not in peer-reviewed or industry-standard form for large US operations. ESG disclosure is regulatory-driven, but the analytics-ROI literature hasn’t caught up. Ask vendors for site-specific before/after data rather than an industry-average claim.
How fast is the mining analytics market growing in the US?
MarketsandMarkets forecasts a 19% compound annual growth rate for the US AI-in-mining market through 2032, with an associated High Performance Data Analytics market projected to reach $158.4 billion by 2031. Check the MarketsandMarkets research page directly for updated figures as newer report editions are published.
How is Farmonaut different from other mining analytics solutions?
Farmonaut integrates satellite imagery, AI advisory, blockchain traceability, and fleet analytics into one platform accessible via web and mobile apps, rather than requiring a company to build or license each layer separately.





Where This Goes Next
The durable part of this story isn’t a single year’s figure — it’s the method: measure your own failure-incident cost and downtime-hours, apply the 10-30% documented reduction range to that baseline, and re-check the RTS Labs and MarketsandMarkets sources annually for updated ranges as more operations publish deployment data. That calculation stays valid whether the underlying percentages tighten or widen in future reporting cycles.
What’s still missing — a mining-specific US adoption-rate figure, a nature-risk-analytics ROI study, and a published US data-volume benchmark — represents where the next round of industry reporting needs to land before this page can cite firmer numbers in those three areas.
The future of mining economics is anchored in whichever companies close that measurement gap first at their own sites, rather than waiting for an industry average to catch up.

 Mine4Africa
 Lithspo Minerals Limited
 Tintina Mining Group
 Dalgety Minerals Pty Ltd
 Vortex Minerals Pty Ltd
 Faith At Work (Pty) Ltd
 Geotech Mining Solutions plc
 Vulcan International Limited
 Kidepo Associates
 GKY Mining
 Alkimy SARL
 Double A Trading
 GemSprout Metals Limited
 Qader Group
 Ileys General Trading
 SG Gold Mining LLC
 VRV Global Pte Ltd
 Omsri International FZE
 G.I.T.T.
 Jaunita Erss Ltd
 Almosi SARL
 SRK Consulting
 Berks Gold Limited
 Mwerezi Minerals Company Limited
