

Reviewed August 2026 against USGS Mineral Commodity Summaries and De Beers Group production reports.
Try it: Estimated polished output and value will appear here. →
Meta Description: The diamond mining market size measured in carats, not just dollars: Russia alone produced 37,322,794 carats in 2024 per USGS, while De Beers sold 20.946 million carats in 2025 — here’s how to read the real production data and what ethical sourcing verification actually requires.
There is no single, official “diamond mining market size in dollars” published by USGS, the body that tracks global mineral production most rigorously. What USGS and producers like De Beers Group do publish is carat volume — and that’s the number that actually moves prices, jobs, and sourcing policy. Russia produced 37,322,794 carats in 2024, according to USGS Mineral Commodity Summaries data. De Beers Group sold 20.946 million carats of rough diamonds in 2025. Lab-grown diamond output, by contrast, is estimated at 15+ million carats globally as of 2024 per industry analysis — a volume now large enough to reshape how buyers and miners think about “market size” altogether.
This guide works from carat and unit data actually published by USGS and industry sources, explains why a single dollar figure for “the diamond mining market” is hard to source credibly, and gives you a repeatable method to pull the current numbers yourself before making a sourcing or investment decision. It also covers where diamond mining techniques and ethical-sourcing verification stand today.
Table of Contents
- Introduction: What “Market Size” Actually Means for Diamonds
- Diamond Production Data: Countries, Carats, and Companies
- Comparison Table: Production Volumes by Source and Year
- Lab-Grown Diamonds and the Natural-Diamond Supply Squeeze
- Ethical Diamond Sourcing: Challenges and Verification
- Sustainable Mining Practices Shaping the Industry
- Regulatory Role & Industry Initiatives
- Technological Advancements Powering Responsible Mining
- Calculator: Estimating Rough-to-Polished Carat Yield
- Farmonaut: Satellite Technology Supporting Sustainable Mining
- Outlook: What Would Change These Numbers
- FAQ: Diamond Mining Market Size & Ethical Sourcing
- Try it: Estimated polished output and value will appear here.
Introduction: What “Market Size” Actually Means for Diamonds
Search for “diamond mining market size” and you’ll find a wide spread of dollar figures from different market-research vendors, most without a transparent primary source. USGS — the agency responsible for tracking mineral commodity production in the United States and reporting on global mineral output — does not publish a consolidated global diamond market valuation in dollars. It publishes production volumes: carats mined, by country, by year. That is the credible, checkable number, and it’s what this article builds from.
For context on scale: 37,322,794 carats from Russia alone in 2024 (USGS) is roughly 7.5 metric tons of rough diamond material from one country in one year. De Beers Group’s 20.946 million carats sold in 2025 covers a mix of gem-quality and lower-value goods across its full production and trading operation. These are the figures a buyer, investor, or sourcing manager can actually verify against a primary source — unlike a “$100 billion market by 2025” headline figure that traces to no checkable dataset.
Focus Keywords: diamond mining market size, ethical diamond sourcing, production volume, carats, USGS, De Beers, lab-grown diamonds, sustainable mining, traceability, Kimberley Process.
Diamond Production Data: Countries, Carats, and Companies
Where the Verifiable Numbers Come From
Three primary sources anchor any credible read of diamond mining volume:
- USGS Mineral Commodity Summaries: The US Geological Survey publishes an annual gemstones and diamond summary. The 2024 edition reports Russia’s production at 37,322,794 carats — the largest single national figure in the dataset. USGS updates this survey annually; the current edition is available directly from USGS at USGS Mineral Commodity Summaries 2024 (Gemstones).
- US industrial diamond production: The USGS Mineral Commodity Summaries 2026 diamond report puts US domestic industrial diamond production at 160 million carats in 2025, valued at $52 million. That per-carat value — about $0.33/carat — reflects industrial-grade material used in cutting, grinding, and drilling tools, not gem-quality stones, which is why the dollar figure looks small against the carat count. See USGS Mineral Commodity Summaries 2026 (Diamond).
- De Beers Group: As the largest vertically integrated diamond company, De Beers publishes its own rough diamond sales volumes. In 2025, De Beers sold 20.946 million carats. This is a company-level figure, not a national or global total, but because De Beers historically accounts for a substantial share of global rough supply, it’s a useful cross-check against USGS country data. De Beers publishes its results directly at De Beers Group.
Why There’s No Single Dollar Figure
Rough diamonds are sold in a wide range of qualities — from gem-quality stones destined for jewelry, priced anywhere from a few hundred to tens of thousands of dollars per carat depending on the 4Cs (cut, color, clarity, carat), down to industrial bort worth well under a dollar per carat. A single “market size in dollars” figure has to make an assumption about the blend of quality across all production worldwide, and neither USGS nor De Beers publishes that blended valuation. Market-research firms that publish a headline dollar total are making that blend assumption themselves, often without disclosing it — which is why those figures vary so widely from source to source and why this article does not repeat one.
If your work requires a specific valuation — for financial modeling, an investment memo, or procurement budgeting — the reliable path is to pull the current carat volume from USGS or De Beers, then apply your own price-per-carat assumption for the specific quality grade you’re sourcing, rather than relying on an unsourced aggregate figure.
Extraction Methods: Alluvial vs. Kimberlite Pipe Mining
Diamonds are extracted primarily by two methods, and the method used affects both cost structure and environmental footprint:
- Alluvial Mining: Involves retrieving diamonds from riverbeds and ocean shorelines. This method collects diamonds naturally transported by water systems over geological time, often with less capital-intensive machinery than hard-rock mining, but with a distinct set of water-management and sediment-disturbance concerns.
- Kimberlite Pipe Mining: Diamonds are mined from volcanic rock formations (pipes) deep beneath the earth’s surface. This is the primary method behind Russia’s 37,322,794-carat 2024 output and requires sophisticated machinery, blasting, and excavation infrastructure — a much larger upfront capital commitment than alluvial operations.

Market Dynamics: Opportunities and Challenges
-
Opportunities:
- Verifiable production data (USGS, De Beers) increasingly replacing unsourced market-size estimates in buyer due diligence
- Technological innovation in sorting and monitoring lowering per-carat operating costs
- Traceability infrastructure creating a price premium for verifiably ethical stones
-
Challenges:
- Growing scrutiny over sourcing ethics and labor rights industry-wide
- Environmental impact and pressure to adopt measurable, auditable sustainable practices
- Competition from lab-grown supply, now estimated above 15 million carats/year globally, compressing prices for comparable natural stones
Comparison Table: Production Volumes by Source and Year
| Metric | Volume | Year | Source |
|---|---|---|---|
| Russia total diamond production | 37,322,794 carats | 2024 | USGS Mineral Commodity Summaries |
| US domestic industrial diamond production | 160,000,000 carats | 2025 | USGS Mineral Commodity Summaries 2026 |
| US industrial diamond production value | $52 million | 2025 | USGS Mineral Commodity Summaries 2026 |
| De Beers Group rough diamond sales | 20,946,000 carats | 2025 | De Beers Group |
| Global lab-grown diamond production (estimate) | 15,000,000+ carats | 2024 | Statista / industry analysis |
This table deliberately mixes national production, company sales, and category estimates rather than forcing them into one misleading total — each row is independently checkable at its source link. To refresh any row, go to the cited source directly: USGS reissues its Mineral Commodity Summaries annually (typically in the first quarter of the calendar year), and De Beers reports sales figures on its own results calendar.
Lab-Grown Diamonds and the Natural-Diamond Supply Squeeze
Global lab-grown diamond production is estimated at over 15 million carats annually as of 2024, according to industry analysis compiled by Statista. Set against De Beers’ 20.946 million carats of rough sales in 2025 and Russia’s 37,322,794-carat national output in 2024, lab-grown supply is no longer a rounding error — it’s a volume comparable to a major single producing country. That has two direct effects on the natural-diamond market: downward price pressure on lower-clarity natural stones that compete directly with lab-grown equivalents, and a widening price and provenance premium for natural stones that carry verified, traceable origin documentation.
For sourcing and investment decisions, the practical implication is that “diamond market size” increasingly needs to be read as two separate markets — natural and lab-grown — rather than one blended figure. USGS production data covers natural stones only; lab-grown volumes are tracked by industry analysts rather than a geological survey, since lab-grown diamonds are manufactured, not mined.

Ethical Diamond Sourcing: Challenges and Verification
Issues with Conflict Diamonds and Social Responsibility
The diamond industry’s most persistent reputational challenge is the legacy of conflict diamonds, also called blood diamonds — stones mined in war zones and sold to finance armed conflict, historically tied to severe human rights abuses and a near-total absence of transparency.
- International Efforts: The Kimberley Process Certification Scheme (KPCS) was introduced to curb the trade in conflict diamonds by requiring certification before export. It has measurably reduced conflict-diamond flows since its adoption, but enforcement consistency and full supply-chain traceability remain acknowledged gaps — the certification covers rough-diamond export, not every step from mine to retail.
- Demand for Transparency: Buyers increasingly ask where a diamond was mined and whether it was ethically sourced before purchase. Meeting that demand requires documentation that goes beyond the KPCS certificate — mine-of-origin records, chain-of-custody logs, and increasingly, independent verification of the physical mine site itself.
Innovations in Traceability and Provenance Verification
- Blockchain-based Digital Ledgers: Leading companies now offer blockchain-based traceability solutions for tracking diamonds through the supply chain. Each stone receives a tamper-evident digital record confirming its origin, mining method, and transfer history, reducing fraud and building buyer confidence.
- Satellite & AI-Driven Audits: Some operators adopt AI-powered environmental monitoring tools to verify compliance with sustainable mining commitments, including emissions tracking and water stewardship, independent of self-reported figures.
- Due Diligence Documentation: Modern operators use geotagged site records, third-party audits, and external certifications to strengthen sourcing claims and make conflict-diamond laundering harder to disguise.

Certification Schemes & Consumer Assurance
Third-party certification and transparent reporting play a major role in ethical sourcing claims. The current schemes worth knowing:
- Kimberley Process Certification Scheme (KPCS): Certifies that exported rough diamonds are conflict-free at the point of export.
- Responsible Jewellery Council (RJC): Certifies responsible business practices across the jewellery supply chain, from mine to retail.
- Blockchain-based Traceability: Increasingly integrated alongside KPCS and RJC certification to provide end-to-end, tamper-evident record-keeping beyond what either scheme alone requires.
For digital compliance workflows, sourcing teams are adopting API-based monitoring and reporting systems that streamline regulatory filings and reduce manual data-entry error in provenance records.
Sustainable Mining Practices Shaping the Industry
- Environmental Impact Reduction: Operators invest in water management systems, biodiversity conservation, and land reclamation to reduce long-term site impact.
- Carbon Footprint Management: Emissions-tracking analytics support carbon footprinting initiatives aimed at reducing greenhouse gas output from extraction and processing.
- Responsible Water Use: Monitoring and recycling systems improve water-use efficiency and reduce contamination risk at both alluvial and kimberlite sites.
- Community Engagement: Operators investing in local healthcare, education, and infrastructure share economic benefit and support social stability around mine sites.
- Waste Reduction: Improved processing and sorting reduce tailings volume and strengthen waste-containment compliance.

Regulatory Role & Industry Initiatives
Governments, industry bodies, and international organizations shape ethical sourcing and sustainable mining standards through several channels:
- National Mining Codes: Major producing countries are strengthening environmental and social governance (ESG) frameworks, with tighter enforcement of reclamation and reporting obligations.
- International Standards: Bodies including the OECD and the KPCS develop supply-chain due-diligence guidance and conflict-diamond avoidance frameworks.
- Certification & Audit Programs: Industry participants use third-party audits incorporating blockchain records and satellite monitoring for independent transparency verification.
- Growing Role of Technology: Digital platforms and APIs increasingly provide real-time compliance tooling that simplifies alignment with evolving regulation.

Technological Advancements Powering Responsible Mining
- Automated Excavation & AI-Powered Sorting: Automated equipment increases output and safety, while AI-driven sorting improves yield and reduces waste at the processing stage.
- Satellite-Based Monitoring: Regular satellite imaging helps environmental managers detect land-use changes, unauthorized extraction, or unplanned environmental impact around a mine footprint.
- Blockchain Traceability: Digital ledgers record the origin, movement, and processing history of each stone, supporting a tamper-evident digital supply chain from mine to retail.
- Energy Optimization: Newer systems integrate renewable energy into mine power supplies, reducing the carbon footprint per carat produced.
- Water Purification & Recycling: Closed-loop filtration systems reduce both water consumption and downstream contamination risk.
- Remote Resource Management: Satellite monitoring and mobile apps let site managers optimize equipment allocation remotely, lowering operational cost and emissions per unit of output.

Calculator: Estimating Rough-to-Polished Carat Yield
Rough diamonds lose a substantial share of their weight during cutting and polishing. Use the calculator below with your own rough-carat volume and expected yield ratio to estimate polished output and its approximate market value at a price-per-carat you set — rather than relying on a blended industry average that may not match your quality grade.
Estimated polished output and value will appear here.
Farmonaut: Satellite Technology Supporting Sustainable Mining
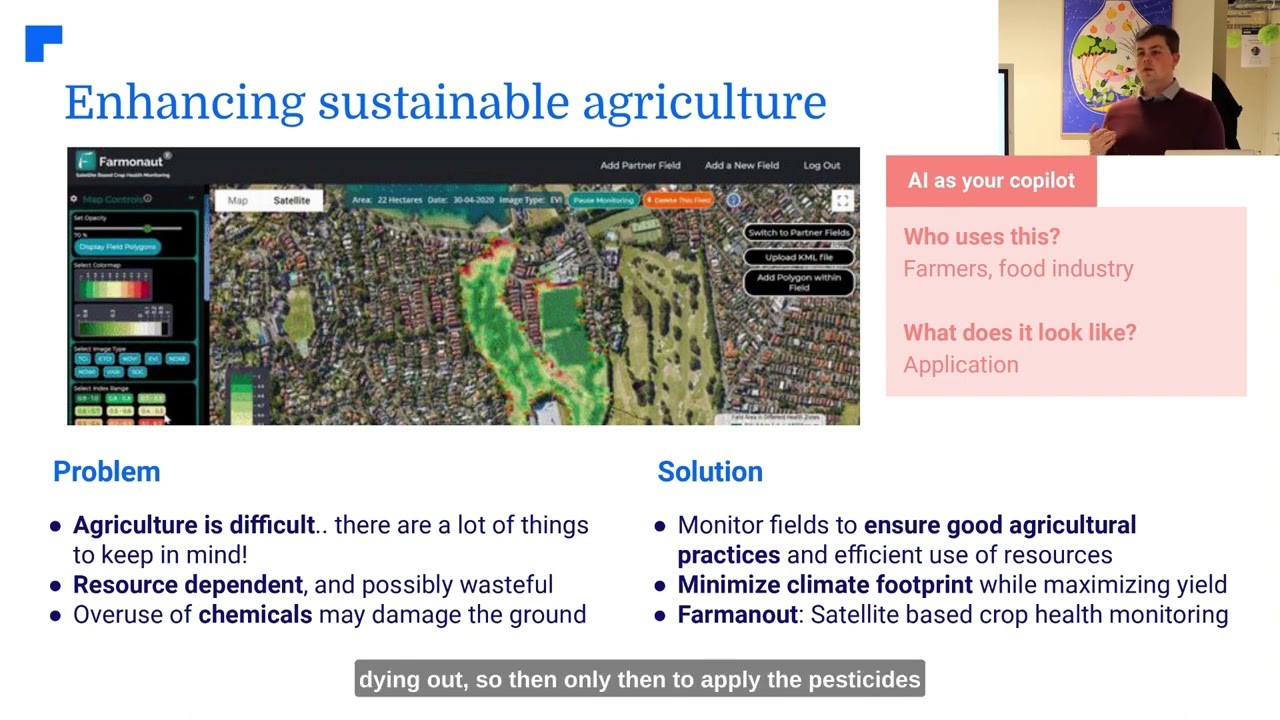
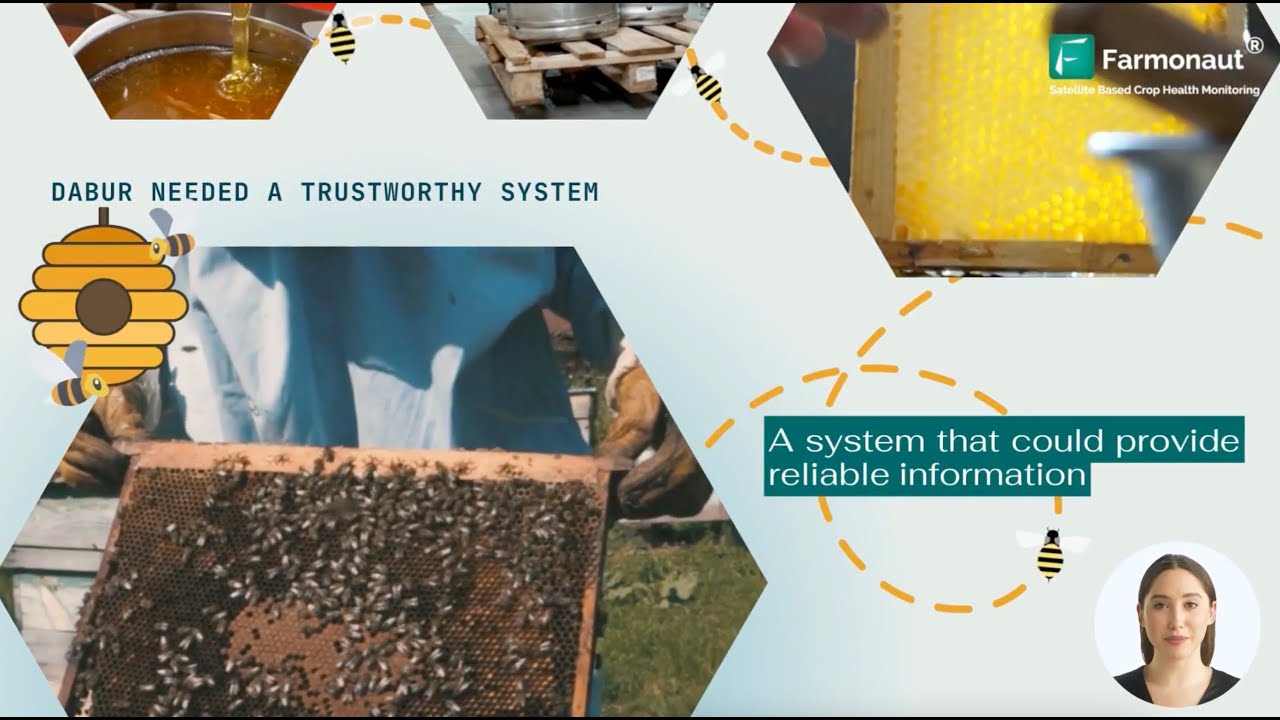
Farmonaut brings advanced, affordable satellite solutions to industries worldwide, mining included. Our technologies support the shift to ethical diamond sourcing, sustainable mining practices, and improved supply chain transparency:
-
Satellite-Based Site Monitoring: Our app, available via
 , delivers imagery to monitor mining activity, assess land-use change, track deforestation, and flag unauthorized extraction near a permitted footprint.
- AI Advisory & Environmental Tracking: Our Jeevn AI system provides real-time advisory on operational efficiency, environmental impact, and compliance status for mining decision-makers.
-
Blockchain-based Traceability: We integrate blockchain tracing for mining supply chains, giving buyers an end-to-end digital identifier for each diamond’s origin and sustainability credentials.
Learn more about Farmonaut’s Traceability. - Carbon Footprint Monitoring: Farmonaut’s Carbon Footprinting platform tracks, analyzes, and reports mining-related emissions to help operators meet regulatory and voluntary sustainability targets.
-
Fleet & Resource Management: Our fleet management tools improve asset utilization, optimize routes, and improve safety for mining equipment and vehicles.
Explore our Fleet Management Solutions. - Developer API for Integration: Integrate near-real-time satellite insight into mining and supply chain systems via Farmonaut APIs. View developer docs.
-
Mobile Accessibility: Access data and monitoring via


Our goal is cost-effective, high-impact digital tools that lower the barrier to entry for small operators while enhancing reporting, traceability, and sustainability practice for the industry’s largest players.
We also offer satellite-based verification for mining loans and insurance, streamlining processes for financial institutions and improving miners’ access to capital.
Outlook: What Would Change These Numbers
The diamond mining sector sits at an inflection point where verifiable production data, lab-grown competition, and ethical-sourcing verification are converging into a single due-diligence question for buyers: not “what is the market worth” but “can this specific stone’s origin be proven.” Several factors will move the numbers in this article, and a reader coming back in a year should check each one:
- Annual USGS revisions: USGS reissues its Mineral Commodity Summaries every year, typically in the first quarter. Russia’s 37,322,794-carat 2024 figure and the US 160-million-carat 2025 industrial figure will both be superseded — check USGS’s current diamond summary for the latest release.
- De Beers sales cycles: De Beers reports rough diamond sales figures on its own results calendar throughout the year; the 20.946 million-carat 2025 total will be followed by updated cycle figures at De Beers Group.
- Lab-grown production growth: The 15+ million carat 2024 estimate for lab-grown output is likely to rise; because lab-grown diamonds are manufactured rather than mined, USGS does not track this figure, so industry analysis sources such as Statista are the practical way to monitor it going forward.
- Continued Demand Shifts: Jewelry demand and industrial diamond use (electronics, optics, cutting tools) will keep shifting the balance between gem-quality and industrial output — the US 2025 industrial figure is a useful baseline to track year over year.
- Stricter Standards & Regulations: Expect continued expansion of traceability, ESG reporting, and environmental compliance requirements tied to mining rights allocation and renewal.
- Supply Chain Resilience: Broader adoption of digital chain-of-custody records will keep reducing sourcing risk and improving buyer trust across markets, independent of any single year’s production total.
The durable takeaway is method, not a number: pull carat volumes directly from USGS and De Beers rather than an unsourced market-size headline, and verify ethical-sourcing claims against a documented chain of custody rather than a certificate alone.
Summary: Diamond Mining Market Size & Ethical Sourcing, By the Numbers
The credible way to size the diamond mining market is by production volume, not an unsourced dollar headline: Russia’s 37,322,794 carats in 2024, De Beers’ 20.946 million carats sold in 2025, US industrial output of 160 million carats worth $52 million in 2025, and lab-grown supply estimated above 15 million carats globally in 2024 — all figures traceable to USGS, De Beers, and industry analysis rather than to a single unverifiable aggregate. Alongside that volume, the sector’s real transformation is in verification: buyers increasingly demand documented chain-of-custody, not just a Kimberley Process certificate, and operators leveraging digital tools — carbon tracking, blockchain traceability, and satellite site monitoring — are the ones building buyer trust fastest.
Farmonaut provides accessible, high-impact satellite solutions helping mining stakeholders of every size build toward a future where verifiable data, transparency, and planetary stewardship reinforce each other rather than compete.
Beyond Diamonds: How Two Other Markets Get Measured
The same “what counts as market size” question shows up in wildly different sectors, and looking at how those are actually measured is instructive.
US Houseplant and Foliage Market
USDA’s National Agricultural Statistics Service (NASS) reported US foliage plant sales at $932 million in 2024, part of $18.3 billion in total US horticulture operation sales that year. Foliage plant sales grew 35% between 2019 and 2024, per the same USDA NASS release. At the state level, California led with $3,067 million in total horticultural sales in 2024, followed by Florida at $2,151 million — together illustrating how concentrated US ornamental horticulture production is in a handful of states. NASS runs its Floriculture Crops survey annually, typically releasing results in February; the current release is available at USDA NASS Newsroom, and the state-level breakdown is in the USDA NASS Horticultural Specialties 2024 report. German-specific houseplant market figures were not located in English-language official sources for this article; readers needing German data should check Destatis (Germany’s federal statistics office) or Eurostat’s horticulture statistics directly, as neither publishes a figure that could be verified here.
European Softwood Market
On the timber side, the European Timber Trade Federation reported European sawn softwood consumption at 42.8 million cubic meters in 2024, forecast to rise to 43.5 million cubic meters in 2025 — a 2.1% increase over the 2023–2024 period. As with diamonds, a monetary “market size” in dollars or euros was not published alongside these volume figures in the available industry reporting; the federation’s tracked metric is consumption volume, not blended market value. Readers needing a dollar or euro valuation should apply current regional softwood lumber pricing (available from national timber trade associations or commodity price services) to these consumption volumes directly, since no consolidated valuation exists in the source data. Full detail is at Fast Markets: European softwood sawn timber market.
The pattern across all three markets — diamonds, houseplants, and softwood — is the same: the trustworthy number is the one a named agency actually publishes and updates on a known schedule, not the one that sounds most impressive in a headline.





FAQ: Diamond Mining Market Size & Ethical Sourcing
What is the diamond mining market size?
There is no single official dollar figure published by USGS or De Beers for global diamond market size. The verifiable data is production volume: Russia produced 37,322,794 carats in 2024 (USGS), De Beers sold 20.946 million carats in 2025, and US industrial diamond production reached 160 million carats worth $52 million in 2025 (USGS). Apply your own price-per-carat assumption to these volumes for a dollar estimate specific to your quality grade.
How big is the softwood market?
European sawn softwood consumption was 42.8 million cubic meters in 2024, forecast to reach 43.5 million cubic meters in 2025 — a 2.1% year-over-year increase, according to the European Timber Trade Federation. No consolidated dollar or euro market valuation was published alongside these volumes; apply current regional lumber pricing to estimate value.
How big is the houseplant market?
US foliage plant sales reached $932 million in 2024, up 35% from 2019, according to USDA NASS. Total US horticulture operation sales were $18.3 billion in 2024. California ($3,067 million) and Florida ($2,151 million) are the two largest producing states. German or EU-specific figures were not found in available official sources.
Why is ethical diamond sourcing important?
Ethical sourcing helps prevent trade in conflict diamonds, supports fair labor practices, reduces environmental harm, and meets rising buyer demand for verifiable transparency — a Kimberley Process certificate alone no longer satisfies most institutional buyers’ due-diligence requirements.
What sustainable practices are being adopted in diamond mining?
Modern diamond mining companies use sustainable water management, reduced energy consumption, blockchain-based traceability, mined-land restoration, and community investment programs.
How does technology improve transparency in the diamond mining industry?
Satellite monitoring, AI-based analytics, and blockchain digital ledgers give stakeholders real-time, tamper-evident insight into mining activity, supply-chain origin, and regulatory compliance — independent of self-reported claims.
How does lab-grown diamond production compare to natural diamond mining?
Lab-grown diamond production is estimated at over 15 million carats globally in 2024, compared to De Beers’ 20.946 million carats sold in 2025 and Russia’s 37,322,794-carat 2024 national output. Lab-grown volume is now large enough to affect pricing on comparable natural stones, particularly at lower clarity grades.
Does Farmonaut help with ethical sourcing and sustainable practices in mining?
Yes. Farmonaut offers satellite-based site monitoring, blockchain traceability, carbon tracking, and fleet/resource management tools to support transparency, efficiency, and sustainability for mining stakeholders of any size.

 Berks Gold Limited
 Mwerezi Minerals Company Limited
 Congo Mining Solutions
 Mining SARL
 SenGold Invest SAS
 Sania Corporation
 Sean Mining Limited
 NTS Group (Pty) Ltd
 Mine4Africa
 Lithspo Minerals Limited
 Tintina Mining Group
 Dalgety Minerals Pty Ltd
 Vortex Minerals Pty Ltd
 Faith At Work (Pty) Ltd
 Geotech Mining Solutions plc
 Vulcan International Limited
 Kidepo Associates
 GKY Mining
 Alkimy SARL
 Double A Trading
 GemSprout Metals Limited
 Qader Group
 Ileys General Trading
 SG Gold Mining LLC
 VRV Global Pte Ltd
 Omsri International FZE
 G.I.T.T.
 Jaunita Erss Ltd
