

Exploration targeting · How-to guide
Exploration Targeting: How Drill Targets Get Ranked
Exploration targeting scores ground against a deposit model and ranks drill targets by chance and cost. Only 21% of 2025 exploration budgets (US$2.57 billion) went to grassroots work, so each hole has to be chosen with care (S&P Global, 2026).
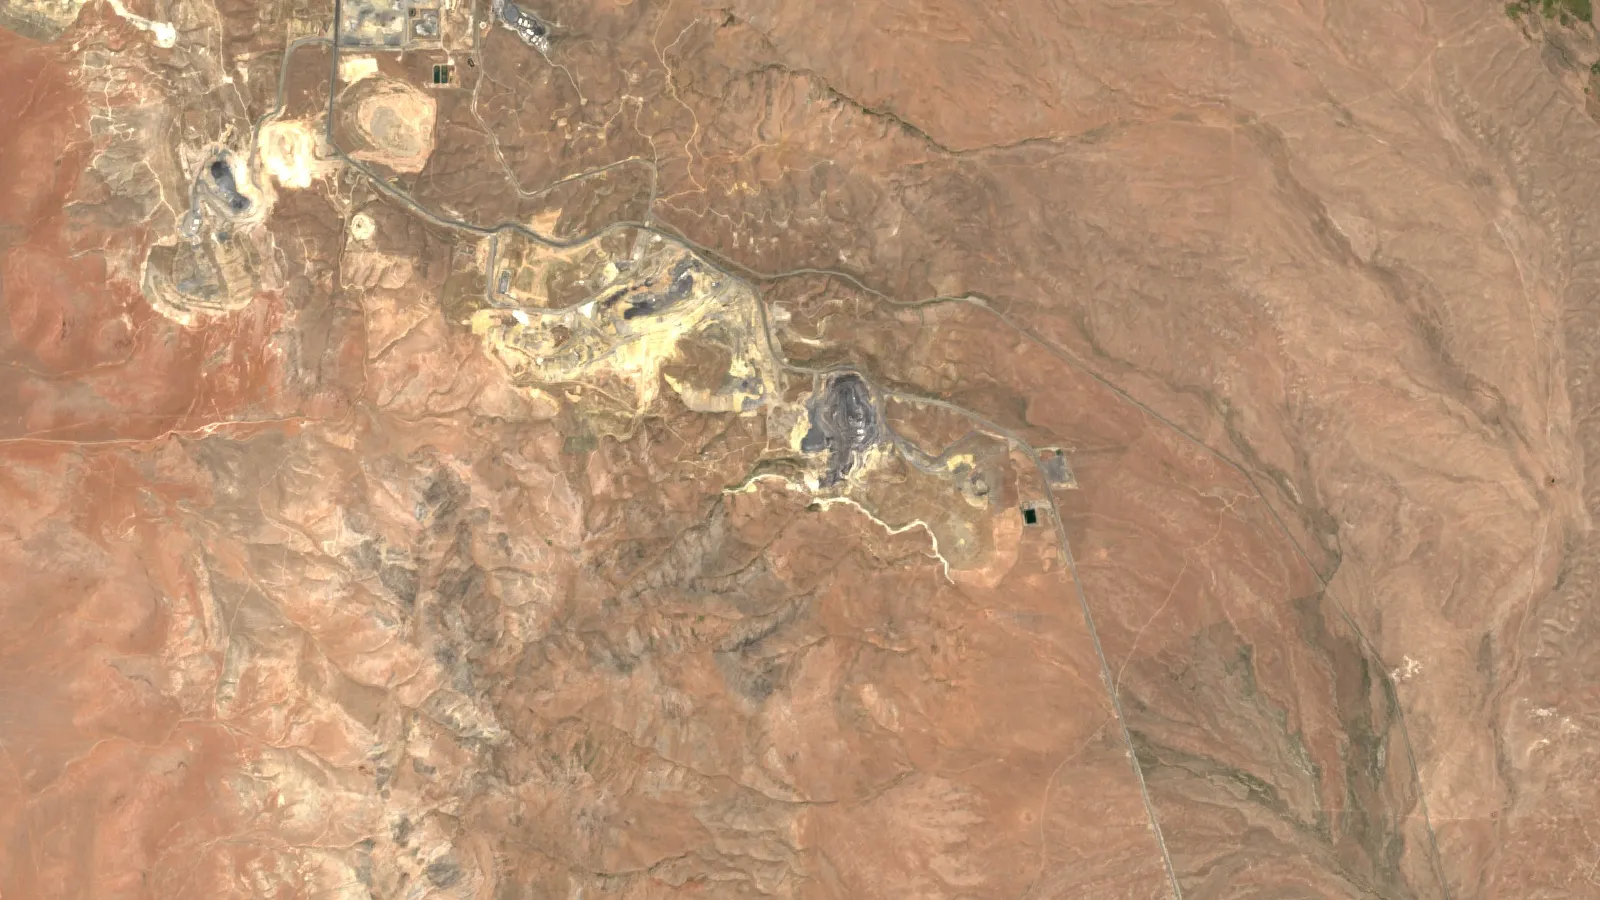
Key takeaways
- Targeting follows five steps: pick a deposit model, collect layers, score, rank by chance and cost, then check on the ground before drilling.
- Grassroots exploration was 21% of 2025 budgets (US$2.57 billion) and minesite work 45% (US$5.63 billion), per S&P Global Market Intelligence.
- Base drilling rates run from 12-20 a metre (rotary air blast) to 110-250 (diamond core), currency not stated by the source, and the all-in cost can double (Novo Resources).
- AI is showing results in data preparation (DARPA reports USGS assessment workflows cut to two and a half days in hackathon pilots, against about two years for a typical assessment) and uneven for scoring new ground (GSA Bulletin, 2024).
- Less than half of all discoveries become mines, so a target list needs stated chances and costs, not scores alone (MinEx Consulting).
In this article
- How exploration targeting works: five steps from model to drill order
- Targeting scales: from region to drill hole
- Evidence layers that go into a target score
- Knowledge-driven and data-driven targeting compared
- AI-driven drilling decisions: what the evidence shows
- Top AI solutions for geological targeting, grouped by job
- Where satellite data fits in target scoring
- What drill targets cost: ranking by chance and cost
- Why ranking matters: where exploration money goes
- Mistakes that make a target list misleading
- Checklist before the first hole
- Frequently asked questions
Exploration targeting is the step that turns geological evidence into a ranked list of places to drill. A geologist or a model scores each candidate area on how well it matches a deposit model, then sorts the list by chance of success and cost to test. The step matters because early-stage work is thin: of the US$12.4 billion that explorers budgeted worldwide in 2025, only US$2.57 billion (21%) went to grassroots exploration, the lowest share in the S&P Global dataset (BusinessDay, reporting S&P Global Market Intelligence, April 2026). Every hole has to count.
This guide is written for licence owners, consultants and investors who need to judge a target list. It explains the workflow, the evidence layers, the difference between expert-driven and data-driven scoring, what AI actually does in drilling decisions, and how to check a ranking before money is spent. A few terms first. A target is a specific place where a drill hole could test a geological idea. Prospectivity is the likelihood that an area hosts a deposit of a chosen type. Grassroots exploration is the search for entirely new deposits in untested ground, and minesite exploration is drilling at or next to a known deposit.
How exploration targeting works: five steps from model to drill order
Most target lists, whether built by hand or by software, follow the same five steps. The order matters, because each step limits what the next one can claim.
Infographic
Targeting in 5 steps
- 1Pick the modelChoose the deposit type and the rocks, fluids and structures it needs.
- 2Collect layersMaps, geochemistry, geophysics, satellite and old drill data in one frame.
- 3Score the groundTurn each layer into a number and combine them with stated weights.
- 4Rank by chance and costSort targets by chance of success and the cost to test them.
- 5Check, then drillWalk and sample the top targets before a rig is booked.
- Pick the deposit model. Decide what you are looking for: a porphyry copper system, an orogenic gold vein, a lithium pegmatite. The model sets which rocks, fluids and structures count as evidence. Geologists call the whole recipe a mineral system, and a two-page paper by McCuaig and Hronsky calls that concept the key to exploration targeting (Transactions of the Institutions of Mining and Metallurgy B, 2017).
- Collect the evidence layers. Geological maps, rock and soil geochemistry, magnetic and radiometric surveys, satellite alteration maps and old drill holes all go into one map frame.
- Score each cell or polygon. Every layer is turned into a number: close to a fault bend, inside an alteration halo, over a magnetic low. Scores are combined with weights.
- Rank by chance and cost. A target with a good score that sits under 200 metres of cover costs more to test than one at surface. The ranking should show both.
- Check on the ground, then drill. Mapping, sampling and sometimes a ground geophysical line confirm or kill a target cheaply before a rig is booked.
The same logic applies to a hand-drawn overlay on a paper map and to a machine-learning model. The tool changes the speed and the number of layers it can hold. It does not change the need for a deposit model, honest weights and a ground check. For the wider programme around these steps, see the stage-by-stage guide in mineral exploration stages, methods, costs and timelines.
Targeting scales: from region to drill hole
Targeting is done at several scales, and the evidence that works at one scale often fails at the next. The Geological Survey of Western Australia organised its Yilgarn gold targeting atlas the same way, with part one at regional scale, part two at district scale and part three at deposit scale (Witt and others, GSWA Report 125, 2014).
- Region or belt (hundreds of kilometres): which greenstone belt, volcanic arc or basin is worth a licence at all. Evidence is geological maps, regional magnetics, gravity and published deposit counts.
- District (tens of kilometres): which part of a licence holds the right structure and alteration. Evidence is detailed mapping, stream sediment surveys, airborne geophysics and satellite alteration maps.
- Prospect (kilometres): which anomaly to test first. Evidence is soil grids, trenching, ground geophysics and the first drill holes.
- Drill hole (metres): where to place the collar, at what angle and to what depth. Evidence is structural measurements and the cross-section.
A common mistake is to use a district-scale layer for a hole-scale decision. A satellite pixel covers tens of metres of ground, so it can say where an alteration halo sits but not which side of a quartz vein to start on.
Evidence layers that go into a target score
Each layer answers a different question, and each has a known blind spot. The table lists the layers most scoring workflows use. Where a layer has its own Farmonaut guide, the link points to it.
| Evidence layer | What it shows | Main limit |
|---|---|---|
| Geological map | Rock units, faults, contacts and known mineral occurrences | Only as good as the mapping scale and the outcrop; see geological mapping methods and scales |
| Soil, stream and rock geochemistry | Metal anomalies at or near surface | Transported cover can move or hide the signal; see geochemical survey design |
| Magnetic survey | Buried intrusions, faults and magnetite-bearing or magnetite-destroyed rock | Several rock types share a magnetic response; see geomagnetic survey specifications |
| Satellite alteration maps | Surface clay, mica and iron-oxide patterns that mark altered rock | Blind to ground under thick soil, vegetation or cover |
| Radiometrics | Potassium, thorium and uranium in the top tens of centimetres | Shallow signal; weathering changes it |
| Old drill and trench data | Real grades and depths | Held in scattered formats; often not digitised |
The deposit type decides how much weight each layer gets. A porphyry copper system shows wide clay and mica alteration around an intrusion, so satellite alteration maps and magnetics carry weight. A narrow gold vein may show almost nothing from orbit and lean on soil geochemistry and structure instead. The grades, sizes and surface signs of each type are in the guide to types of ore deposits, and the clues for one style are in the guide to epithermal gold deposits.
Knowledge-driven and data-driven targeting compared
There are two ways to turn layers into a score. In a knowledge-driven method, geologists decide the criteria and weights from their understanding of the deposit type. In a data-driven method, the weights are learned from where known deposits sit relative to the layers. Most real projects mix the two.
The Yilgarn atlas is a good worked example of the knowledge-driven side. The Yilgarn Craton holds more than 324 million ounces of gold. The authors tested 18 targeting criteria against known gold, picked the four most effective (proximity to intrusions of Mafic Group granites, higher fault density, proximity to regional fault bends and location in greenstone belts) and combined them with fuzzy logic, a method that gives each cell a score between zero and one instead of a yes or no. Correlation between the resulting prospectivity values and gold endowment ranged from 0.38 to 0.78, depending on the endowment measure. Adding two more criteria, domes and late-stage basins, made the correlation worse, a reminder that more layers do not always help (Witt and others, 2014).
The data-driven side has a different problem: known deposits are few, so models trained on them can learn the quirks of those sites. The positive-unlabeled study described in the next section was built for exactly that case. A model score is also a measure on known deposits, not a drilling success rate, and it needs calibration before it can be read as a chance.
AI-driven drilling decisions: what the evidence shows
AI in exploration is mostly three jobs: reading and organising old data, scoring ground against known deposits, and helping people decide what to test next. The evidence is stronger for the first two than for the third.
Data preparation is where AI is showing the clearest results. The US Geological Survey and the US defence research agency DARPA ran the CriticalMAAS project to speed up mineral assessments. The USGS lead said a typical assessment takes about two years for one deposit type, one commodity and one area, and project hackathons cut the workflow to two and a half days. AI results still have to pass USGS scientific standards and peer review (DARPA, January 2025).
Scoring ground works best where there are many known deposits. A study in the GSA Bulletin used positive-unlabeled learning, a method that trains on known deposits only and treats everything else as unlabelled. It was applied to porphyry copper across the American Cordillera. Several high-scoring zones had no known deposit, which the authors flag as possible targets. The method matched or beat conventional classifiers in North America but scored relatively poorly in South America, so results differ by region (Alfonso and others, GSA Bulletin, 2024).
Operators describe a mix of AI and human judgement. KoBold Metals, a company that explores with its own models, says its project at Mingomba in Zambia began in late 2022 and that its shaft construction started on 29 April 2026, with an estimated investment above US$2 billion and a target of about 300,000 tonnes of copper a year, first output expected in the early 2030s. KoBold calls its approach AI-and-HI-driven, meaning artificial and human intelligence together (KoBold Metals, May 2026). These are company statements. A public hit rate for AI-picked drill targets across the industry has not been published in the sources reviewed for this page.
The practical reading is simple. AI shortens the time to a first ranked list and can hold more layers than a person. It does not remove the need for a deposit model, a field check and a drill result. Three questions test any AI claim: what labelled deposits trained it, how was it tested on ground it had not seen, and what did the highest-ranked targets actually return when drilled.

▶ What AI does in mineral exploration, where it fails, and how to check a claim. · 4:37
Top AI solutions for geological targeting, grouped by job
The table groups the kinds of AI targeting tools by the job they do. It is not a ranking: no public, independent test compares them on the same ground, so there is no single metric to sort by.
| Kind of solution | Job it does | Example from published sources | Watch for |
|---|---|---|---|
| Public-sector assessment tools | Extract data from maps and reports, build national or regional mineral potential maps | USGS and DARPA CriticalMAAS (DARPA, 2025) | Built for survey-scale assessment, not single licences |
| Operator-built exploration models | Rank ground for the company’s own drilling | KoBold Metals, which describes an AI-and-HI model (company statement, 2026) | Results are proprietary; the model is not sold as a report |
| Academic prospectivity models | Learn from known deposits to score new ground | Positive-unlabeled learning for porphyry copper (GSA Bulletin, 2024) | Accuracy is measured on known deposits, not on new discoveries |
| Satellite alteration mapping | Map clay, mica and iron-oxide patterns over a licence and flag areas that match the target style | ASTER shortwave-infrared methods described in the peer-reviewed literature; Farmonaut Mining Pro delivers satellite reports with high-potential zones and prospectivity maps, typically in 5 to 20 business days depending on area size and mineral | Shows the surface only; needs a ground check |
| GIS weights-of-evidence and fuzzy tools | Combine layers with expert or statistical weights | The GSWA Yilgarn gold atlas (2014) | Weights are only as good as the geology behind them |
A buyer of any of these should ask for the same things: the deposit model assumed, the layers used and their dates, the score for every target (not only the top few), and a list of what the method cannot see.
Where satellite data fits in target scoring
Satellite imagery is one layer, and for early screening it is a cheap one. Shortwave-infrared bands on instruments such as ASTER can pick out hydroxyl-bearing minerals, the clays and micas that form around porphyry copper and epithermal gold systems, and a review in the National Library of Medicine’s PMC archive describes this use for ore mineral exploration and lithological mapping (ASTER, ALI and Hyperion review, PMC). Visible and near-infrared bands can highlight iron oxides.
The layer is strongest on bare or sparsely vegetated ground where the alteration reaches the surface, and weakest under thick soil, dense forest or transported cover. It also shows the footprint a deposit leaves, not the metal itself, so every result is an exploration target to be tested, not a resource estimate. Satellite results do not follow JORC or NI 43-101 reporting codes, and they are not a clearance for land access or the environment.
Used well, satellite alteration maps do two jobs in a ranking. They shrink a large licence to a few areas worth walking, and they flag outcrops that earlier explorers may have missed. A buyer screening a claim before purchase can use the same layer to see whether the ground matches the seller’s story.
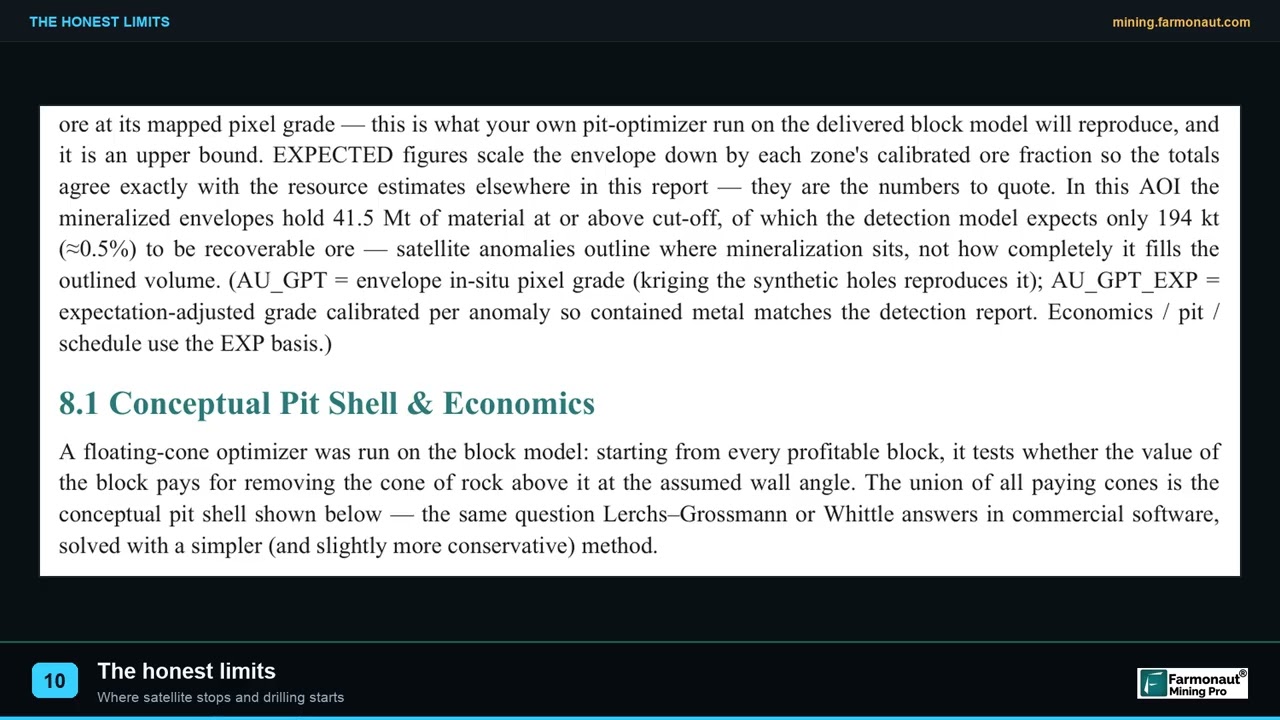
▶ The three limits of satellite exploration that matter in due diligence. · 2:08
What drill targets cost: ranking by chance and cost
A ranking only makes sense with a price attached. Novo Resources lists base rates per metre for common drilling methods, and notes that consumables, standby time, mobilisation and water cartage can double the all-in cost (Novo Resources, drilling techniques and costs). Rotary air blast is cheapest at $12 to 20 a metre and diamond core is dearest at $110 to 250 a metre in the company’s table (the table does not state a currency), which is why first-pass holes on early targets are usually shallow and cheap, and core is saved for targets that have already shown something.
Chart
Drilling base rate by method
Per metre (the source does not state a currency), base rate before consumables, standby and mobilisation
Two numbers drive the order of a drill list: the cost to test each target and the chance it holds ore-grade rock. A cheap target with a modest chance can beat an expensive one with a better chance. The calculator below turns your own inputs into a cost per expected hit. The chance is an input on purpose. It comes from your geological judgement or from a calibrated model, and no public benchmark fits every project.
Keep the odds in view. MinEx Consulting reports that, on average, less than half of all discoveries become mines, that mined deposits typically take 15 to 20 years from discovery to development, and that Tier 1 and Tier 2 discoveries are about twice as likely to reach production as Tier 3 or unclassified ones (MinEx Consulting). A drill hit is the first step on that path, not the end of it.
Calculator
What does each expected drill hit cost?
Enter your own programme and your own chance of success.
- Programme cost (US$): $405,000
- Cost to test one target (US$): $40,500
- Expected hits: 1.0
- Metres drilled: 4,500
Example values only, not a benchmark. Chance of success is your own judgement or a calibrated model’s output. Cost per metre is an example in US$, use today’s quote; Novo Resources lists a base rate of 30-55 a metre for reverse circulation (currency not stated).
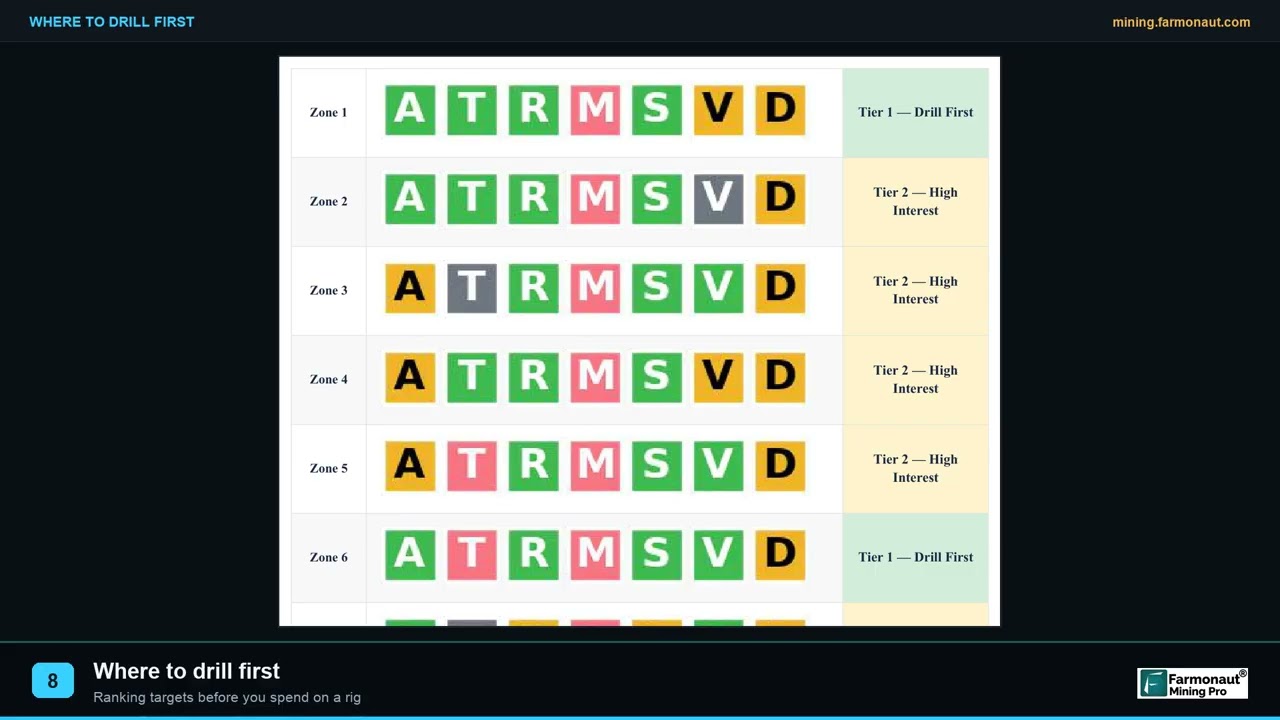
▶ How thirteen satellite targets are ranked into a drill order. · 2:19
Why ranking matters: where exploration money goes
The industry spends most of its exploration money near known deposits. S&P Global Market Intelligence’s 2026 report found minesite exploration rose 13% to a record US$5.63 billion, 45% of all budgets, while grassroots budgets fell 8% to US$2.57 billion. Junior explorers’ budgets fell 13% to US$4.39 billion. Gold took half of the global total at US$6.15 billion, and copper reached US$3.27 billion, a 12-year high. Lithium fell 46% to US$595 million, nickel fell 37% to US$332 million and cobalt fell 41% to US$31 million (BusinessDay, April 2026).
Chart
Where 2025 exploration money went
US$ billion; juniors cut across all stages, so bars overlap
Chart
Exploration budgets by metal
US$ billion, selected metals, global nonferrous budgets for 2025
The same report counted 56,015 drill holes across 1,244 projects in 2025, up 30% in holes and 1% in projects. With about 45 holes per project on average, each project’s target list drives a lot of metres. The prior year’s report, covering 2024, put global spending at US$12.5 billion, down 3%, and warned that less grassroots work could shrink the pipeline of new deposits (The Northern Miner via MINING.COM, February 2025). When money for grassroots work is scarce, a licence owner with a defensible target list stands out.
Mistakes that make a target list misleading
- Ranking on a single layer. A bright alteration map with no structure or geochemistry behind it is a lead, not a target.
- Training on too few deposits. A model fed a handful of known deposits learns the quirks of those sites. Ask how many it saw and how it was tested.
- Confusing a score with a probability. A model that scores 0.9 on a map is not saying there is a 90% chance of ore. Calibration against known results is what turns a score into a chance.
- Ignoring cover. Transported soil, laterite or glacial till can hide the signal or move it sideways. State how deep the evidence can see.
- Hiding the weights. If the scoring cannot be reproduced from stated layers and weights, it cannot be checked.
- Skipping the ground check. Hand-mapping and a soil line cost far less than a diamond hole.
- Mixing scales. A district layer cannot place a collar.
Checklist before the first hole
- Name the deposit model and the reason it fits this ground.
- List each evidence layer with its date, resolution and depth of view.
- Show the score for every target, not just the top five.
- State the chance and the cost for each target, and the order that follows.
- Record what would change the order: a new soil result, a cleared access route, a better cover model.
- Walk the top targets and sample them before drilling.
- Confirm permits, landowner permission and the licence terms in writing. Never use mercury in any sampling or processing.
A target list built this way can be shown to a partner, a lender or a buyer and defended line by line. For the next stage, porphyry copper alteration and discovery is a good example of how one deposit type’s layers translate into targets.
Frequently asked questions
What is exploration targeting?
It is the process of combining geological, geochemical, geophysical and remote-sensing evidence to rank places to drill. The output is a ranked list of targets with the evidence, the chance of success and the cost for each.
How do geologists rank drill targets?
They score each area against a deposit model, weight the layers by how well they predict that deposit type, and sort by chance and cost. Ranking by score alone ignores depth and access, which change the cost of testing each target.
What is mineral prospectivity mapping?
It is a map that shows how likely each part of an area is to host a deposit of a chosen type. It can be built from expert rules, as in the GSWA Yilgarn gold atlas, or learned from known deposits with machine learning.
What is the difference between a target and a prospect?
In common usage a prospect is an area with enough evidence to justify more work, and a target is a specific spot within it that a drill hole will test. Companies differ in how they use the words, so ask for the definition used in any report.
Can AI decide where to drill?
AI can rank ground and shorten the time to a first target list. The decision still rests on a deposit model, a field check and a budget. Published sources show strong results for data preparation and for scoring in regions with many known deposits, and uneven results elsewhere.
What data does an AI targeting model need?
It needs labelled examples of known deposits of the chosen type, plus layers such as geology, geophysics, geochemistry and satellite data, covering both the training area and the new ground. Few labelled deposits is the common weak point, which is why methods such as positive-unlabeled learning, which trains on known deposits only, were developed.
How accurate are AI prospectivity maps?
Accuracy is usually reported as area under the curve (AUC) on known deposits, where 0.5 is a coin toss and 1.0 is perfect separation. That measures how well a model separates known deposits from the rest, not how often a new drill target will find ore. In the GSA Bulletin copper study, performance in South America was relatively poor, so a good score in one region does not carry over.
How much does it cost to test a target?
It depends on method and depth. Novo Resources lists base rates of 12 to 20 a metre for rotary air blast, 30 to 55 for reverse circulation and 110 to 250 for diamond core (the table does not state a currency), and notes that the all-in cost can reach double the base rate. Multiply by holes and metres, or use the calculator above.
Can satellite data replace geophysics or geochemistry?
No. Satellite data maps the surface. Magnetic surveys see buried rock and geochemistry measures metal in samples. They answer different questions, and a strong target usually has support from at least two layers.
How much of exploration spending goes to new areas?
S&P Global Market Intelligence reported that grassroots exploration was 21% of global budgets in 2025, at US$2.57 billion, the lowest in its dataset, while minesite exploration was 45%.
What share of discoveries become mines?
MinEx Consulting reports that, on average, less than half of all discoveries become mines. A discovery is a drill result, not a feasibility study, so even a good target is only the start.
Exploration targets, prospectivity scores and costs on this page are examples to help you plan work. They are not a resource estimate, and drilling results can differ widely from any ranking.
This page is for information only. It is not investment advice. Targets, scores and costs are examples to help plan exploration, not a resource estimate. Always get landowner permission and a licence before prospecting, and never use mercury.
Farmonaut mining
Rank targets on your own licence
Send a licence boundary and request a quote for a satellite screening report that maps surface alteration and high-potential zones.
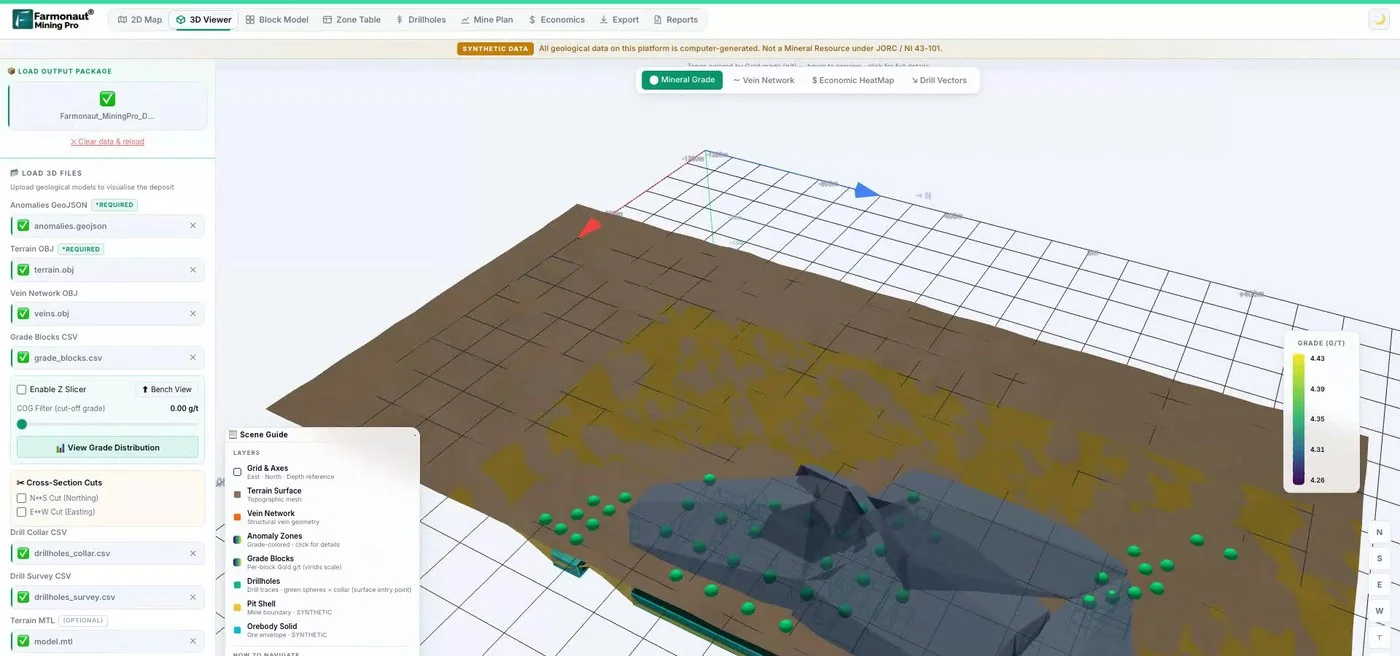
Mining Pro sample view, synthetic data
Sources
- BusinessDay, Gold drives mining exploration as global budgets fall (S&P Global, April 2026): businessday.co.za
- The Northern Miner via MINING.COM, Global exploration budgets fall as juniors tighten belts (February 2025): mining.com
- MiningVisuals, 2025 Global Exploration Budget by Commodity (March 2026): miningvisuals.com
- MinEx Consulting, The fingerprint of a successful discovery: minexconsulting.com
- Witt and others, Yilgarn Gold Exploration Targeting Atlas part 1, GSWA Report 125 (2014): researchonline.jcu.edu.au
- Alfonso and others, Copper prospectivity in the American Cordillera, GSA Bulletin (2024): earthbyte.org
- DARPA, USGS and DARPA collaborate to accelerate critical mineral assessment (January 2025): darpa.mil
- KoBold Metals, Breaking ground at Mingomba (May 2026): koboldmetals.com
- Novo Resources, Drilling techniques and costs: novoresources.com
- PMC, ASTER, ALI and Hyperion sensors data for lithological mapping and ore minerals exploration: pmc.ncbi.nlm.nih.gov
- McCuaig and Hronsky, The mineral systems concept: the key to exploration targeting (2017): researchers.mq.edu.au
Discussion
Questions, corrections or field experience? Share them below. First-time comments are reviewed before they appear, and your email is never published.
No comments yet. Be the first to add a question or your experience.

 Klusetic Mining Investments
 Mine4Africa
 Lithspo Minerals Limited
 Tintina Mining Group
 Dalgety Minerals Pty Ltd
 Vortex Minerals Pty Ltd
 Faith At Work (Pty) Ltd
 Geotech Mining Solutions plc
 Vulcan International Limited
 Kidepo Associates
 GKY Mining
 Alkimy SARL
 Double A Trading
 GemSprout Metals Limited
 Qader Group
 Ileys General Trading
 SG Gold Mining LLC
 VRV Global Pte Ltd
 Omsri International FZE
 G.I.T.T.
 Jaunita Erss Ltd
 Almosi SARL
 SRK Consulting
 Berks Gold Limited
 Mwerezi Minerals Company Limited











