

Gold ore grades · Data guide
How Much Gold Is Extracted per Ton of Rock Ore?
Working mines recover about 0.4 to 8 grams of gold from each tonne of ore. Newmont’s 2025 mine grades ran from 0.52 to 8.29 g/t, and its mills recovered 64% to 98% of the gold. Real grades, value per ton and a break-even calculator follow.
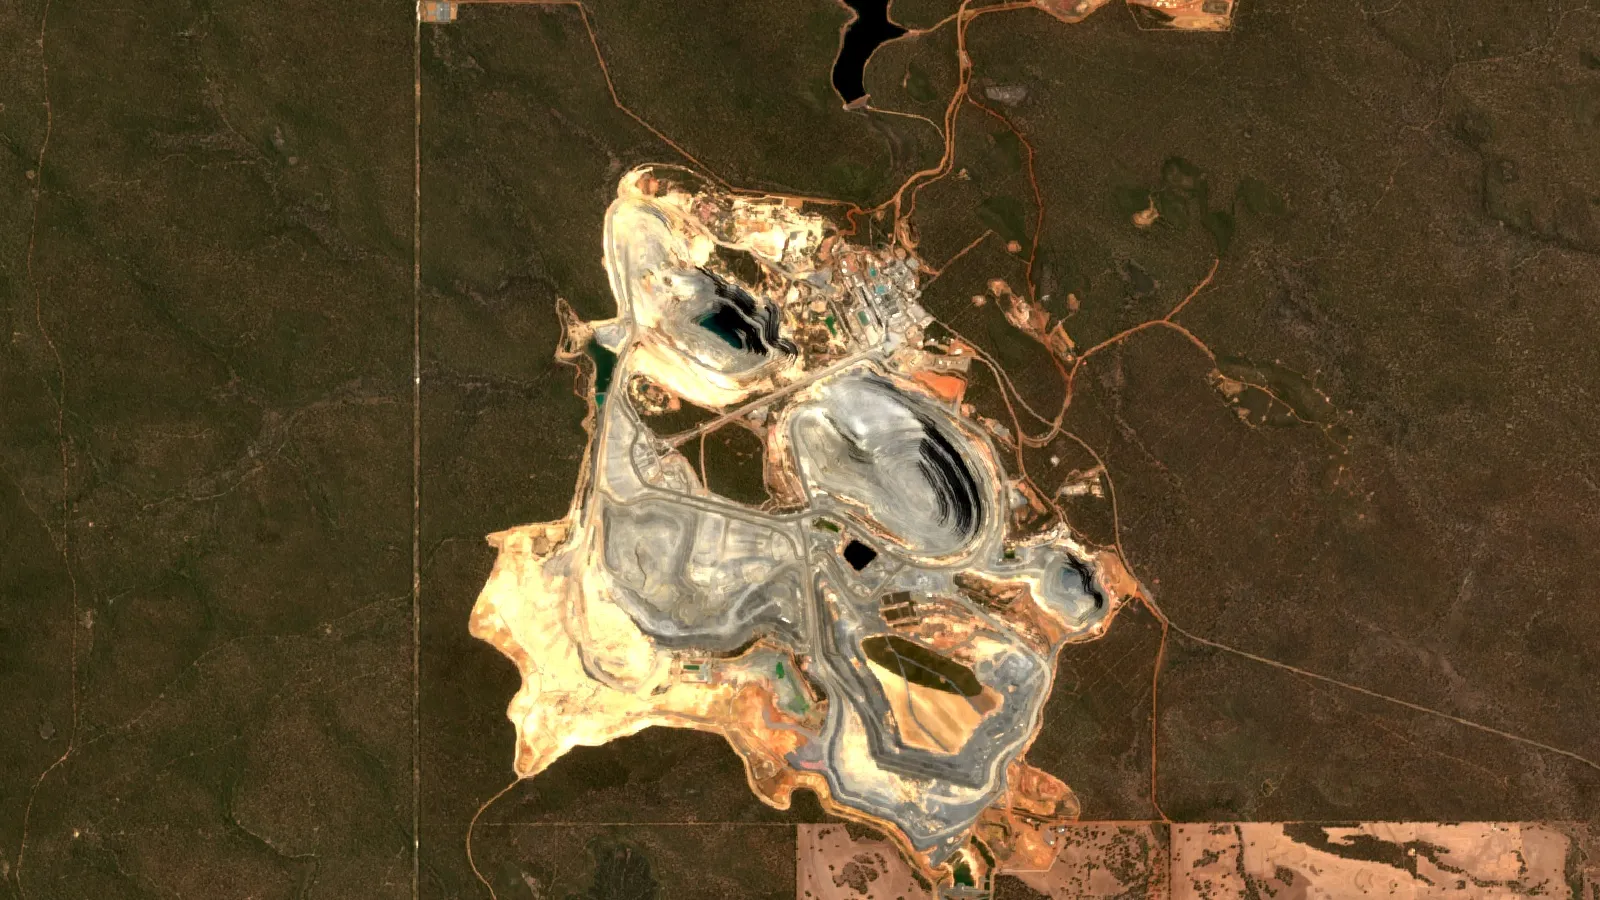
Key takeaways
- Newmont’s 2025 head grades ran from 0.52 g/t (Cadia) to 8.29 g/t (Cerro Negro), with mill recovery from 64.2% to 97.9% (Newmont operating statistics, February 2026).
- Tanami recovered about 5.08 g per tonne, worth roughly US$658 per tonne at Kitco spot of US$4,028.10 per oz on 29 October 2026, before costs.
- Break-even depends on cost per tonne: US$10.52 at the DeLamar open-pit heap-leach study (about 0.11 g/t at spot) against a 4.30 g/t cut-off at the Madsen underground plan.
- The USGS puts average crust at 0.004 g/t and ore at roughly 0.2 to 30 g/t; US ore mined in 1998 averaged 1.5 g/t recoverable (USGS, 2002).
- A 240-tonne truck of 1 g/t ore at 90% recovery holds about 216 g (6.9 oz), worth about US$27,973 before any cost at the 29 October 2026 price.
In this article
- Gold extracted per ton of ore at eight working mines
- Gold grades chart: from crustal rock to bonanza ore
- Why recovery changes how much gold you actually get
- How much gold per ton is profitable?
- Gold value per ton of ore at today's price
- How much is a truckload of ore worth once the gold is extracted?
- How much gold per ton does an underground mine produce?
- From rock to bar: how the gold is extracted
- How grade is measured: sampling and assay
- What a satellite can and cannot tell you about grade
- What happens to the rest of the rock
- Frequently asked questions
How much gold is extracted per ton of rock ore? At working mines the answer runs from about 0.4 to 8 grams of gold per tonne (1,000 kg) of ore. Newmont’s mills in 2025 were fed ore grading from 0.52 g/t at Cadia in Australia to 8.29 g/t at Cerro Negro in Argentina, and they recovered between 64% and 98% of the gold in it (Newmont operating statistics, full year 2025). In US units that is roughly 0.01 to 0.23 troy ounces of gold from each short ton of ore.
Two units cause most of the confusion. A tonne is the metric ton of 1,000 kg. A short ton, the US ton, is 907 kg. One gram per tonne (g/t) equals one part per million (ppm), according to the USGS gold commodity profile, and one troy ounce per short ton equals 34.29 g/t. The grade of the ore as it enters the mill is called the head grade. Recovery is the share of that gold that ends up in the final gold-silver bar, called doré.
This page puts real mine data next to the questions people ask: what a ton of ore holds, what grade is worth mining, what a ton or a truckload of ore is worth at today’s price, and why the gold you extract is always less than the gold in the rock. Spot gold was about US$4,028.10 per troy ounce at 29 October 2026 (Kitco). Every value below uses that price and is revenue before any cost. Prices move daily, so use the calculator with the price on the day you read this.
Gold extracted per ton of ore at eight working mines
Newmont publishes the tonnes milled, head grade and mill recovery for each of its mines every quarter. The table below uses the full-year 2025 figures. Gold recovered per tonne is head grade multiplied by recovery. The result agrees with Newmont’s reported output: Tanami’s 5.19 g/t at 97.9% recovery gives 5.08 g/t, and 2.39 million tonnes milled at that rate is the 391,000 ounces Newmont reported for the mine.
Chart
Average ore grade at eight Newmont mines
Head grade, g/t of gold, full year 2025
| Mine (country) | Ore milled (million tonnes) | Head grade (g/t) | Mill recovery (%) | Gold recovered (g per tonne) | Gold recovered (troy oz per short ton) |
|---|---|---|---|---|---|
| Cerro Negro (Argentina) | 0.79 | 8.29 | 95.5 | 7.91 | 0.231 |
| Tanami (Australia) | 2.39 | 5.19 | 97.9 | 5.08 | 0.148 |
| Ahafo South (Ghana) | 9.66 | 2.29 | 93.6 | 2.14 | 0.063 |
| Lihir (Papua New Guinea) | 10.07 | 2.34 | 77.1 | 1.81 | 0.053 |
| Merian (Suriname) | 12.82 | 0.64 | 92.0 | 0.59 | 0.017 |
| Boddington (Australia) | 36.53 | 0.57 | 85.0 | 0.49 | 0.014 |
| Peñasquito (Mexico) | 34.90 | 0.64 | 64.2 | 0.41 | 0.012 |
| Cadia (Australia) | 29.52 | 0.52 | 79.0 | 0.41 | 0.012 |
Source: Newmont, Fourth Quarter 2025 Operating Statistics (19 February 2026); recovered grade and ounces per short ton calculated from them.
Three patterns stand out. First, the richest ore is mined underground. Newmont reports Tanami and Cerro Negro as underground operations, while Lihir and Boddington are open pits. Second, the biggest mills run on the leanest ore: Boddington treated 36.5 million tonnes at about half a gram per tonne. Third, gold is not always the main product. Newmont’s statistics list copper at Cadia and Boddington, and silver, lead and zinc at Peñasquito, so a low gold grade there is paid for by other metals.
The eight mines are a sample from one company, not a world average. For US mines, the USGS profile puts the average recoverable gold content of ore mined in 1998 at about 1.5 g/t, with a mill head grade of at least 1.8 g/t. That is old data, but it sits in the same range as the mid-table mines above.
Gold grades chart: from crustal rock to bonanza ore
Ore is rock that holds enough metal to pay for its own removal. Gold is rare in ordinary rock. The USGS gives the average crustal concentration as 0.004 g/t, or 4 parts per billion, and says deposits that can be mined at the gold price of the day are typically 100 to 1,000 times richer. The chart-style table below ranks the grades that matter, in both metric and US units.
| Grade (g/t, same as ppm) | Troy oz per short ton | What it means |
|---|---|---|
| 0.004 | 0.0001 | Average of the Earth’s crust (USGS) |
| 0.2 | 0.006 | About the lowest content USGS says can be extracted by cyanide leaching, when mixed with richer ore |
| 0.34 | 0.01 | Ore-to-waste cut-off for the lowest-cost mining and milling (US EPA, 1994) |
| 0.69 to 1.37 | 0.02 to 0.04 | Content EPA gave in 1994 for ore that could be recovered at the gold price of the time |
| 1.5 to 1.8 | 0.044 to 0.052 | Recoverable and mill-head grade of US ore mined in 1998 (USGS) |
| 3.4 to 6.9 | 0.1 to 0.2 | What EPA called high grade in 1994 (more than 0.1 or 0.2 oz/t) |
| 5.9 | 0.17 | Homestake ore in 1999 (USGS) |
| 8.29 | 0.24 | Cerro Negro head grade, 2025 (Newmont) |
| Up to 30 | Up to 0.88 | Richest South African mines (USGS) |
The USGS profile and the US EPA technical resource document on gold supply the older rows. Both were written when gold cost far less than it does now, so the cut-offs they quote have moved down. The conversion for any row is simple: multiply ounces per short ton by 34.29 to get g/t, so 0.01 oz/t is 0.34 g/t, 0.1 oz/t is 3.43 g/t and 0.25 oz/t is 8.57 g/t.
Quartz-hosted gold ore is graded the same way, by assay in g/t. What changes is the geology and how the gold sits in the rock, which is covered in our guide to types of gold deposits. For the element itself, see Au on the periodic table.
Why recovery changes how much gold you actually get
Head grade is what is in the rock. Recovery decides what reaches the bar. Newmont’s 2025 mills ranged from 97.9% at Tanami to 64.2% at Peñasquito, so a mine with a modest grade and high recovery can out-produce a richer mine that loses more gold in the plant.
Chart
Mill gold recovery at the same eight mines
Share of gold in the ore that is recovered, full year 2025
The gap comes from how the gold is locked in. In some ores the gold is tied up inside sulfide minerals such as pyrite and arsenopyrite. A paper on pressure oxidation in the journal REM – International Engineering Journal classes an ore as refractory when cyanide leaching recovers less than 80% of the gold, and describes oxidation pre-treatment to open the sulfides first. Heap leaching, where crushed ore is stacked on a lined pad and sprayed with weak cyanide, recovers less. The EPA document gives 60% to 80% for heap and valley-fill leaching, and the DeLamar feasibility study in Idaho, covered below, plans a life-of-mine average of 72.3%. Our guide to oxidized gold ore explains why oxide ore leaches more easily than sulfide ore.
The practical rule: ask for the recovery figure before comparing two grades. An ore grading 2.3 g/t with 93.6% recovery (Ahafo South) delivers more gold per tonne than a 2.3 g/t ore with 77% recovery (Lihir), a difference of about a third of a gram on every tonne milled.
How much gold per ton is profitable?
There is no single grade. A tonne of ore is profitable when the gold recovered from it is worth more than the cost of mining, crushing, leaching, overheads and royalties. That gives a formula you can use on any project:
Chart
Gold needed per 100 tonnes of ore falls as the price rises
Grams of gold per 100 tonnes of ore (22.6 g = 0.226 g/t) to cover site operating cost of US$10.52 per tonne at 72.3% recovery
Break-even grade (g/t) = cost per tonne of ore, divided by (gold price per gram multiplied by recovery). The price per gram is the price per troy ounce divided by 31.1035.
The break-even grade falls as the gold price rises. The chart shows it for the DeLamar open-pit heap-leach project, using the operating cost and recovery from its feasibility study.
Two real cost cases, 0.33 g/t versus 8 g/t
Integra Resources’ feasibility study technical report (effective December 2025) for DeLamar in Idaho is a large, low-grade open-pit oxide and transitional heap-leach plan. It mines 120 million tonnes of ore containing 1,259,000 ounces of gold, an average grade of 0.33 g/t. Life-of-mine gold recovery is 72.3%, and the study puts total site operating cost at US$10.52 per tonne processed: US$3.95 mining, US$5.02 processing and US$1.54 general and administrative.
West Red Lake Gold’s pre-feasibility study for the Madsen mine in Ontario (January 2025) is the opposite case: underground stopes, an average diluted head grade of 8.16 g/t, recovery of 95.7% and a total operating cost of C$322.67 per tonne, of which C$212.93 is mining.
| Project | Method | Head grade (g/t) | Recovery | Operating cost per tonne | Cut-off or break-even grade |
|---|---|---|---|---|---|
| DeLamar, Idaho (feasibility study) | Open pit, heap leach | 0.33 | 72.3% | US$10.52 | About 0.11 g/t at US$4,028.10 per oz; 0.23 g/t at US$2,000 (calculated, operating cost only) |
| Madsen, Ontario (pre-feasibility study) | Underground | 8.16 | 95.7% | C$322.67 | 4.30 g/t for longhole stopes at the study’s US$1,680 price |
Total operating cost per tonne is more than 20 times higher at Madsen than at DeLamar, even after allowing for the Canadian-US dollar difference, so the grade needed is far higher. Heap-leach pits live on fractions of a gram. Underground mines need several grams. Neither number includes the up-front capital: DeLamar’s study lists US$347.0 million of pre-production capital and an all-in sustaining cost of US$1,142 per ounce net of silver.
How many grams of gold per ton is worth mining?
Use cost per tonne to pick the range for your method. The EPA’s 1994 report is a good snapshot of how far the range stretches. It said the lowest-cost mining and milling methods could average 0.03 to 0.04 oz/t (1.0 to 1.4 g/t) with a 0.01 oz/t (0.34 g/t) ore-to-waste cut-off, while high-cost methods needed bulk averages of 0.25 oz/t (8.6 g/t) or more, at cut-offs of 0.15 oz/t (5.1 g/t) or higher. Gold sold for US$360 to US$400 an ounce then. Because break-even grade scales inversely with price, every one of those thresholds is lower at today’s price.
A second check is the industry cost curve. The World Gold Council, using Metals Focus data, tracks the global average all-in sustaining cost (AISC) of gold production on its production costs page. AISC rose to US$1,785 per ounce in the first quarter of 2026, up 16% on a year earlier, as reported by Skillings Mining Review. For more on margins by metal, see Is mining a good business?
Gold value per ton of ore at today’s price
This table turns a grade into money. It assumes 90% recovery, which suits ore that leaches or grinds easily, and the Kitco spot price of US$4,028.10 per troy ounce on 29 October 2026. Gold is worth about US$129.51 per gram at that price. The figures are revenue before mining, processing, royalty and tax costs.
| Ore grade (g/t) | Gold recovered per tonne (g) | Value per tonne (US$) | Value per short ton (US$) | Tonnes of ore for one troy oz |
|---|---|---|---|---|
| 0.5 | 0.45 | 58 | 53 | 69.1 |
| 1 | 0.90 | 117 | 106 | 34.6 |
| 2 | 1.80 | 233 | 211 | 17.3 |
| 3 | 2.70 | 350 | 317 | 11.5 |
| 5 | 4.50 | 583 | 529 | 6.9 |
| 10 | 9.00 | 1,166 | 1,057 | 3.5 |
The last column answers the question “how much ore does it take to make gold”. At 1 g/t and 90% recovery, about 35 tonnes of ore produce one troy ounce, the weight of a coin. At 0.5 g/t the same ounce needs 69 tonnes. The Newmont grades above give real versions of the same sum: Tanami recovers 5.08 g per tonne, worth about US$658 per tonne at the Kitco price, while Boddington’s 0.49 g per tonne is worth about US$63.
The calculator below uses your own inputs. It shows the value of a tonne and of a truckload, the margin after your operating cost, and the break-even grade. The defaults are examples only; enter today’s price and your own costs.
Calculator
What is a tonne or a truckload of my ore worth?
Enter your own grade, recovery, price and cost per tonne.
- Gold recovered per tonne (g): 1.80
- Margin per tonne after your cost (US$): $191
- Break-even grade (g/t): 0.35
- Gold in one truckload (troy oz): 13.9
- Value of one truckload before costs (US$): $55,556
Example values only, not a benchmark. 1 troy ounce = 31.1035 g. The gold price and cost per tonne are inputs: example, use today’s price and your own costs. Values are revenue and margin before royalties, tax and capital.
How much is a truckload of ore worth once the gold is extracted?
A large mine haul truck such as the Caterpillar 793 is built on a 240-tonne (266-short-ton) frame, according to a Cat dealer specification page. Using a 240-tonne load, a full truck of ore carries the following value at the 29 October 2026 Kitco price, assuming 90% recovery unless stated.
| Ore in the truck | Gold recovered (g) | Gold recovered (troy oz) | Value before costs (US$) |
|---|---|---|---|
| 0.5 g/t | 108 | 3.5 | 13,987 |
| 1 g/t | 216 | 6.9 | 27,973 |
| 2 g/t | 432 | 13.9 | 55,947 |
| 5 g/t | 1,080 | 34.7 | 139,867 |
| Tanami 2025 average (5.19 g/t, 97.9%) | 1,219 | 39.2 | 157,839 |
| DeLamar plan (0.33 g/t, 72.3%) | 57 | 1.8 | 7,416 |
A truckload of ore is worth far less than it looks once the rest of the chain is counted. The truck itself, the drilling and blasting, the crusher, the leach pad or mill, the power, the labour and the royalty all come out of that figure, and so does the waste rock hauled to reach the ore. DeLamar’s study carries a strip ratio of 0.54 tonnes of waste for each tonne of ore, so even a low-waste pit moves more rock than the ore alone.
How much gold per ton does an underground mine produce?
Underground mines pay a high price to reach and lift each tonne, so they only work on rich ore. Newmont’s Cerro Negro averaged 8.29 g/t in 2025 and its Tanami mine 5.19 g/t, and both reported that they mined underground ore. The USGS profile notes that in the United States underground mining is restricted to higher-grade ores and cites Homestake at 5.9 g/t in 1999 against a national mill-head average of about 1.8 g/t. The Madsen plan above assumes 8.16 g/t.
The result per ton of earth is about 5 to 8 grams recovered, or 0.15 to 0.23 troy ounces per short ton. That is roughly 10 times or more the output per tonne of a large open pit, but the underground mine moves only a few hundred thousand to a few million tonnes a year, while the big pits move tens of millions. Cerro Negro milled 0.79 million tonnes in 2025, and Boddington milled 36.5 million. Total ounces depend on both numbers.
From rock to bar: how the gold is extracted
The steps differ by ore type, but most gold ore follows the same chain. The EPA’s technical document reports that cyanidation, which dissolves the gold in a weak cyanide solution so it can be caught on activated carbon, produced 90 percent of US lode gold in 1991. The USGS profile describes the heap-leach pad in detail, from the liner to the smelting of the recovered gold into doré bullion.
Infographic
Gold from rock to bar in 5 steps
- 1Mine and haulTrucks or underground hoists bring ore to the plant.
- 2CrushRock is broken down, or stacked on a lined pad for heap leaching.
- 3LeachA weak cyanide solution dissolves the gold from the rock.
- 4Catch the goldActivated carbon or zinc removes the gold from the solution.
- 5SmeltThe gold is melted into doré bars, then refined.
Heap leaching is the cheapest way to treat low-grade oxide ore, which is why DeLamar uses it. Our guide to heap leaching techniques for gold covers pad design and solution flow. The EPA describes heap leaching as a relatively inexpensive way to treat low-grade gold ore, while tank leaching is used for higher-grade ore.

▶ Follows a small gold nugget from rock to ring: found, drilled, crushed, dissolved, caught on carbon, melted and refined. · 5:27
How grade is measured: sampling and assay
No one knows the grade of a deposit until rock has been sampled and analysed. Samples come from drill core, trenches and blast-hole cuttings, and a lab reports the result in g/t or ppm. The standard method for gold is fire assay, in which a 30 g or 50 g portion of the crushed sample is melted with fluxes and the gold is measured from the bead. Actlabs’ 2026 Canadian fee schedule lists a 30 g fire assay with an atomic-absorption finish at C$23.00 per sample, and an ore-grade version with a range of 0.01 to 100 ppm at C$25.25 (prices dated 10 February 2026).
How you sample matters as much as the assay. A single drill hole can miss a vein, and one coarse gold grain can distort a small sample. Read our guides to choosing a gold assay lab and its costs and to core sampling before you commission work.
What a satellite can and cannot tell you about grade
A satellite cannot read grams per tonne. It sees the surface and maps minerals, such as iron oxides and clays, and structures, such as faults, that often travel with gold systems. That is useful for deciding where to take the first samples, not for stating how much gold is in the ground. Only assays from drilled or sampled rock give a grade, and only a qualified resource estimate turns grades into ounces.
For licence owners and consultants, the practical use is to narrow the ground before spending on sampling. Farmonaut’s satellite-based mineral detection works from a licence boundary supplied as a KML, KMZ or polygon, and delivers target zones in 5 to 20 business days. Results are exploration targets, not a resource estimate and not a grade per ton. You can send a boundary and a target mineral through the mining query form for a quote.
▶ The honest answer on satellites and gold: they map the alteration around a gold system, not the gold itself. · 2:00
What happens to the rest of the rock
At 5 g/t, gold is 0.0005% of the ore by weight. At 1 g/t it is 0.0001%. Everything else leaves the mill as tailings, the ground waste rock left after the gold is taken out. Mines store tailings in engineered storage facilities. The size of that stream is the reason low-grade mines are so large and why water, power and land use are decisions as important as the grade itself.
Mining is not the only source of gold: US refineries made about 90 tonnes from scrap in 2025 against 170 tonnes from mined material. The USGS estimates world mine production at about 3,300 tonnes in 2025, with China, Russia, Australia and Canada among the largest producers (USGS Mineral Commodity Summaries 2026).

▶ Explains the seven environmental impacts of mining in plain words, with satellite maps. · 2:31
Frequently asked questions
How much gold is in one ton of mined rock?
At working mines, a tonne of ore holds between about 0.5 and 8 grams of gold. Newmont’s 2025 mine grades ran from 0.52 g/t at Cadia to 8.29 g/t at Cerro Negro. Ordinary crustal rock holds only 0.004 g/t (USGS), so ore is hundreds of times richer than average rock. A short ton is 907 kg, so multiply a per-tonne figure by 0.907 to get grams per short ton.
How many grams of gold per ton is worth mining?
It depends on method and price. In the DeLamar feasibility study, an open-pit heap-leach operation with a cost of US$10.52 per tonne breaks even at about 0.11 g/t on operating cost at the 29 October 2026 Kitco price. The Madsen underground plan uses a 4.30 g/t cut-off for longhole stopes. Capital, royalties and tax raise both numbers.
How much gold per ton is profitable?
Gold is profitable when the recovered gold is worth more than every cost of getting it. Divide your cost per tonne by the price per gram and your recovery to get the break-even grade, then add a margin. The calculator on this page does the sum, and the World Gold Council’s AISC figure of US$1,785 per ounce for the first quarter of 2026 gives the industry-wide benchmark.
How much is each truckload of ore worth once the gold is extracted?
A 240-tonne truckload at 1 g/t and 90% recovery holds about 216 g, or 6.9 troy ounces, worth about US$27,973 at the 29 October 2026 Kitco price before any cost. At 5 g/t the same load holds about 34.7 ounces.
How much gold is harvested per ton of earth from an underground mine?
Newmont’s underground Tanami and Cerro Negro mines recovered about 5.1 and 7.9 grams per tonne of ore in 2025. In US units that is 0.15 to 0.23 troy ounces per short ton.
How many tons of ore does it take to make one ounce of gold?
At 1 g/t and 90% recovery, about 35 tonnes. At 5 g/t it is about 7 tonnes, and at 0.5 g/t it is about 69 tonnes. The formula is 31.1035 divided by (grade multiplied by recovery).
How do I convert ounces per ton to grams per tonne?
Multiply troy ounces per short ton by 34.29. So 0.1 oz/t is 3.43 g/t. Going the other way, divide g/t by 34.29. If a report uses metric tons and troy ounces, divide by 31.1035 instead.
What is high-grade gold ore?
The EPA called ore above 0.1 to 0.2 oz/t (3.4 to 6.9 g/t) high grade in 1994, and Newmont’s underground Tanami and Cerro Negro mines averaged 5.19 and 8.29 g/t in 2025. Grades up to about 30 g/t have been reported in the richest South African mines (USGS). Grade is judged against method: 3 g/t is high for an open pit and ordinary for a narrow-vein mine.
How much is a gold mine worth?
A mine is worth the value of its future margin, not the spot value of the gold in it. The Madsen study shows the gap: C$1,480 million of gross revenue over the mine life produces a post-tax net present value of C$315 million at a 5% discount rate. Read how to sell a mine for valuation methods and buyer types.
Can a satellite measure how much gold is in the rock?
No. Satellites map surface minerals and structures that point to where gold may be. Grade comes only from assaying samples, and a resource estimate needs drilling.
What does “Au ore” mean?
Au is the chemical symbol for gold, from the Latin aurum, so Au ore is simply gold ore. Its grade is reported in g/t Au or oz/t Au.
Gold values and prices on this page were checked on 29 October 2026 and change daily. Mine data are company statistics and study figures for the periods named.
This page is for information only. It is not investment advice. Gold prices, costs and study figures change, so confirm them at the source before you act. Sampling and assay results, not a calculator, decide whether ground is worth developing.
Farmonaut mining
Screen your ground before you sample it
Send a licence boundary and a target mineral for a quote on a satellite mineral detection report; results are exploration targets, not a resource estimate.

Mining Pro sample view, synthetic data
Keep reading

Sources
- Newmont, Fourth Quarter 2025 Operating Statistics (19 February 2026): s24.q4cdn.com
- USGS, Mineral Commodity Profiles: Gold, Open-File Report 02-303 (2002): pubs.usgs.gov
- US EPA, Technical Resource Document: Extraction and Beneficiation of Ores and Minerals, Volume 2, Gold (1994): archive.epa.gov
- Integra Resources, DeLamar Project feasibility study technical report (effective 8 December 2025): minedocs.com
- West Red Lake Gold, Madsen pre-feasibility study (7 January 2025): westredlakegold.com
- Kitco, gold price (29 October 2026): kitco.com
- World Gold Council, AISC gold cost curve (Metals Focus): gold.org
- Skillings Mining Review, gold AISC and World Gold Council first-quarter data: skillings.net
- REM – International Engineering Journal, recovery of gold from refractory ore by pressure oxidation: scielo.br
- Actlabs, Geochemistry Schedule of Services and Fees, Canadian (10 February 2026): actlabs.com
- Western States Cat, Cat 793 mining truck: westernstatescat.com
- USGS, Mineral Commodity Summaries 2026: Gold: pubs.usgs.gov
Discussion
Questions, corrections or field experience? Share them below. First-time comments are reviewed before they appear, and your email is never published.
No comments yet. Be the first to add a question or your experience.

 CIMISCO SARL
 Mining SARL
 SenGold Invest SAS
 Sania Corporation
 Sean Mining Limited
 NTS Group (Pty) Ltd
 Mine4Africa
 Lithspo Minerals Limited
 Tintina Mining Group
 Dalgety Minerals Pty Ltd
 Vortex Minerals Pty Ltd
 Faith At Work (Pty) Ltd
 Geotech Mining Solutions plc
 Vulcan International Limited
 Kidepo Associates
 GKY Mining
 Alkimy SARL
 Double A Trading
 GemSprout Metals Limited
 Qader Group
 Ileys General Trading
 SG Gold Mining LLC
 VRV Global Pte Ltd
 Omsri International FZE











