

Iron ore and gold · Comparison
Iron Ore vs Gold Mining: Grades, Costs and Output
Iron ore is graded in percent and sold by the million tonnes; gold is graded in grams per tonne and sold by the ounce. This page compares grade, output, unit cost and margin from 2026 filings, and shows where gold sits inside iron formations.
Key takeaways
- World mine output in 2025 was an estimated 2,600 million tonnes of usable iron ore and 3,300 tonnes of gold, about 790,000 tonnes of ore per tonne of gold (USGS, 2026; our division).
- Large gold pits mill ore near 1 g/t (Detour Lake 0.97, Canadian Malartic 1.06 in the second quarter of 2026), while the Macassa underground mine reached 10.96 g/t (Agnico Eagle).
- Rio Tinto’s Pilbara unit cash cost was US$25.0 per wet tonne against a realised US$85.2 in the first half of 2026; Onslow Iron cost US$52 per wet tonne in the year to June 2026.
- Banded iron formations host gold at Homestake in South Dakota and at Meadowbank, Meliadine and Musselwhite in Canada (US EPA; Laurentian University, 2016).
- At 20 and 77 years of reserves at 2025 output, gold and iron ore are depleted at very different speeds (USGS, 2026; simple division).
In this article
- Iron ore vs gold mining at a glance
- How much rock must be mined for iron ore and for gold
- Gold grade at working mines
- How iron ore mining works
- How gold mining works
- Iron ore vs gold mining costs and margins
- Where iron formations and gold occur together
- Iron oxide at the surface: a clue, not a result
- Compare the value of a tonne of iron ore and gold ore
- Reserves and how long they last
- Frequently asked questions
Iron ore and gold are mined with similar machines but run on opposite economics. Iron ore is a bulk commodity: Rio Tinto’s Pilbara mines sold ore at an average of US$85.2 per wet tonne in the first half of 2026 and shipped 157.7 million tonnes (Rio Tinto, half-year results to 30 June 2026). Gold is a precious metal: Agnico Eagle’s Detour Lake mine milled ore at 0.97 grams of gold per tonne in the second quarter of 2026 (Agnico Eagle, Q2 2026 report). This page compares the two on grade, volume, cost and risk, then shows where they sit in the same rock.
It is written for consultants, licence holders and investors who need to judge a project in either metal. Prices are dated and sourced, never forecast, and every figure comes from a filing or a geological survey that we opened.
Iron ore vs gold mining at a glance
The table sets the two side by side. Grade means the amount of metal in the rock. Gold grade is quoted in grams per tonne (g/t); one g/t is one part per million. Iron grade is quoted as percent iron (Fe). A unit cash cost is what it costs to mine, process and load one tonne at the mine gate or port, before tax and interest.
| Measure | Iron ore | Gold |
|---|---|---|
| World mine output (USGS, 2025 estimate) | 2.6 billion tonnes of usable ore, holding 1.6 billion tonnes of iron | 3,300 tonnes of gold |
| Typical grade quoted | Rio Tinto compares its Pilbara prices with the Platts 61% Fe index; Simandou sales averaged 65.8% Fe | 0.97 to 10.96 g/t across seven Agnico Eagle mines |
| Reference price | US$92.6 per dry tonne realised by Rio Tinto in the Pilbara, first half of 2026 | US$4,026 per troy ounce, spot price as of 30 June 2026 |
| Unit cost example | US$25.0 per wet tonne at Rio Tinto Pilbara; US$52 per wet tonne at the MinRes Onslow Iron mine in the year to June 2026 | All-in sustaining cost guidance of US$1,400 to US$1,550 per ounce at Agnico Eagle |
| Who buys it | Steel mills, mostly through contracts and index prices | Refiners, jewellers, central banks and investors |
| Main risk | Price and freight; margin per tonne depends on mine cost | Grade, recovery and cost per ounce |
Sources for the table: USGS Mineral Commodity Summaries 2026 for iron ore and for gold, the Rio Tinto half-year results, the Agnico Eagle second-quarter report and the MinRes quarterly report of 29 July 2026. The links are in the text and in the list of sources below.
How much rock must be mined for iron ore and for gold
The biggest difference is grade. A tonne of 61% Fe iron ore holds about 610 kilograms of iron. A tonne of ore at Agnico Eagle’s Canadian Malartic mine holds about 1.06 grams of gold. By weight the iron ore is roughly 600,000 times richer. That one fact explains why high-grade iron ore such as Pilbara hematite is shipped after little more than crushing, while gold ore is crushed, ground fine and chemically treated to extract a few grams.
Chart
Iron ore mine production, selected countries, 2025
Million tonnes of usable ore (USGS estimates); selected countries, not a full ranking
The scale of output goes the other way. In 2025 the world mined an estimated 2,600 million tonnes of usable iron ore and 3,300 tonnes of gold, according to USGS Mineral Commodity Summaries 2026 for iron ore and for gold. That is about 790,000 tonnes of iron ore for every tonne of gold (our division of the two rounded USGS totals).
The chart below shows how concentrated iron ore output is. Australia mined an estimated 980 million tonnes in 2025, more than the next three countries shown combined.
Gold grade at working mines
People often think of gold ore as rich. At large open pits it is not. Detour Lake and Canadian Malartic, two of Agnico Eagle’s biggest mines, milled ore at about 1 g/t in the second quarter of 2026. Narrow underground veins carry far more: Macassa averaged 10.96 g/t in the same quarter. High grade means fewer tonnes per ounce, so lower mining and milling cost per ounce, but usually less tonnage and more geological risk.
Chart
Gold grade at seven Agnico Eagle mines
Grams of gold per tonne of ore milled, second quarter of 2026
A quick conversion helps. A troy ounce is 31.1035 grams. At 0.97 g/t you need about 32 tonnes of ore for one ounce before recovery losses. At 10.96 g/t you need under 3 tonnes. At the spot price of US$4,026 per ounce as of 30 June 2026 (Rio Tinto), a tonne of 0.97 g/t ore holds about US$126 of gold before recovery and costs, about 1.5 times the US$85.2 per wet tonne that Rio Tinto’s Pilbara iron ore earned in the first half of 2026. The difference is that the iron ore leaves the mine whole, while the gold ore still has to be processed.
Scale in iron ore is set by a few Pilbara operators. Rio Tinto’s Pilbara operations shipped 326.2 million tonnes in 2025 on a 100% basis (Rio Tinto, fourth quarter 2025 production results), and BHP reported record iron ore production from its Western Australia Iron Ore business in its financial year to June 2026 (BHP, FY2026 results presentation).
How iron ore mining works
Most iron ore is mined from open pits. In the United States, eight open pit mines in Michigan, Minnesota and Utah shipped 98% of US usable iron ore products for the steel industry in 2025, the rest going to non-steel uses (USGS, 2026). The usual sequence is below.
- Drill and blast. Holes are drilled in a pattern and loaded with explosive to break the rock.
- Load and haul. Shovels fill trucks, which carry ore to crushers and waste to dumps.
- Crush and screen. The ore is crushed and sorted by size into lump and fines.
- Upgrade if needed. Rich hematite ore can ship after crushing. Low-grade ores such as the taconite of the Lake Superior district need beneficiation (grinding and separating the iron minerals) and agglomeration into pellets before use, as USGS describes.
- Rail and port. Ore travels by rail to a port and by ship to steel mills.
Pellet making is its own topic; see our guide to iron ore pelletizing, or our note on the Australian market in the iron ore mining Australia outlook.
How gold mining works
Gold is mined from open pits, underground workings and, in the case of placer deposits, from gravel in rivers and benches. Lode ore is crushed and ground, then gold is dissolved with cyanide solution and captured on carbon, or recovered from a gravity circuit, before smelting into doré bars. Some ores are leached on pads instead of ground in a mill. The US Environmental Protection Agency’s 1994 technical review of gold mining describes these routes, including heap leaching and cyanide use. It is an older document, so check current rules with your regulator (US EPA, Technical Resource Document: Extraction and Beneficiation of Ores and Minerals, Gold).
Gold is also a by-product. About 7% of US gold mined in 2025 was recovered from base-metal ores, mainly copper, and Nevada produced about 64% of the 160 tonnes of US mine output (USGS, 2026).
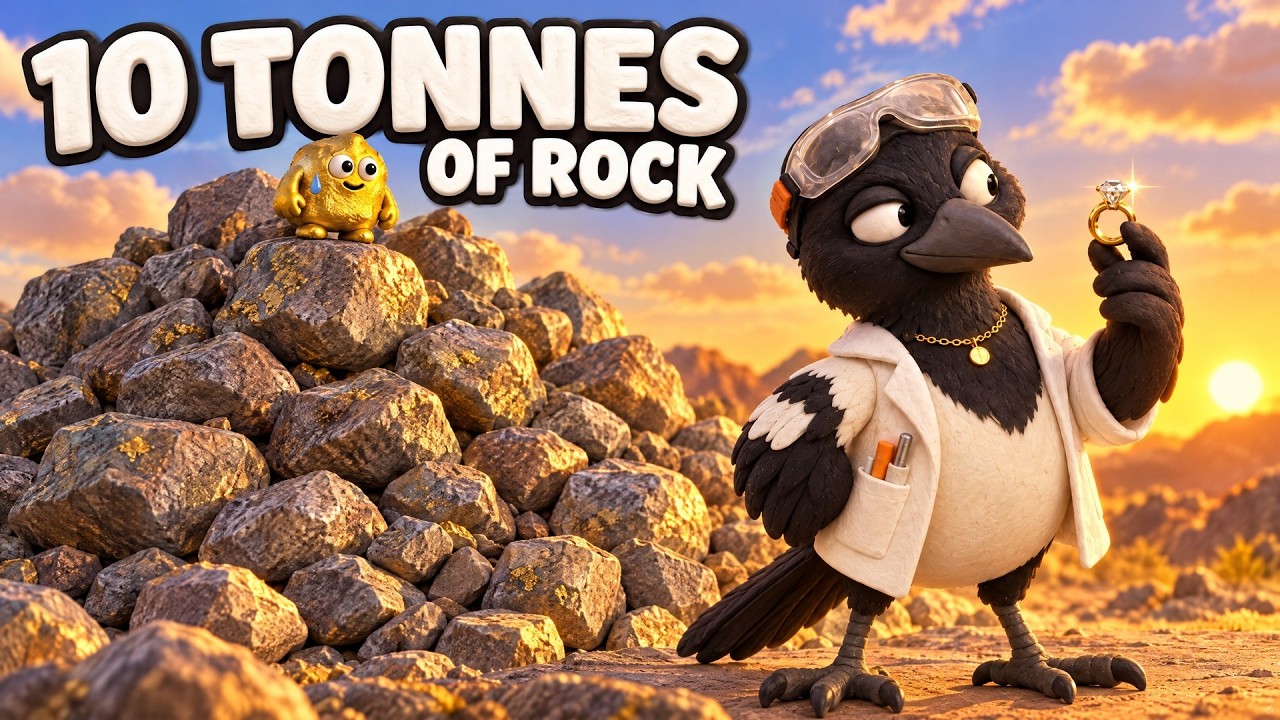
▶ Follows a small gold nugget from rock to ring through drilling, crushing, leaching, carbon capture and refining. · 5:27
Iron ore vs gold mining costs and margins
Cost per tonne and cost per ounce are not comparable numbers, so the useful comparison is margin against price. Rio Tinto reported a Pilbara unit cash cost of US$25.0 per wet tonne in the first half of 2026 against a realised price of US$85.2 per wet tonne. It also warned that a US$10 per barrel rise in diesel adds about US$0.15 per tonne over a full year, so fuel moves costs but not by much.
Chart
US iron ore: average unit value reported by mines
US$ per metric tonne, 2021 to 2025 (2025 estimate)
Not every iron ore miner has that margin. Mineral Resources reported a cost at the port of loading (FOB) of US$52 per wet tonne for its Onslow Iron mine in the year to June 2026 and a quarterly realised price of US$87 per dry tonne, 82% of the Platts 61% Fe index (Mineral Resources, June 2026 quarterly report). Costs differ by site, so the Rio Tinto figure is one example of a very large, low-cost operation, not an industry average.
For gold, Agnico Eagle guides 2026 all-in sustaining costs (AISC, the cash cost of keeping a mine running including sustaining capital and overheads) of US$1,400 to US$1,550 per ounce, a measure defined in the World Gold Council guidance note. Against the US$4,026 spot price as of 30 June 2026, that is a gap of about US$2,476 to US$2,626 per ounce before tax and growth spending. Costs also move with events: Agnico Eagle raised its 2026 total cash cost expectation for Canadian Malartic to about US$1,260 per ounce after a rock mass movement at the Barnat open pit on 1 July 2026.
US iron ore shows how fast bulk prices move. The average unit value reported by US mines fell from US$156.42 per tonne in 2022 to an estimated US$89 in 2025 (USGS, 2026), and the estimated value of US production fell 25% in 2025 to US$3.38 billion.
Where iron formations and gold occur together
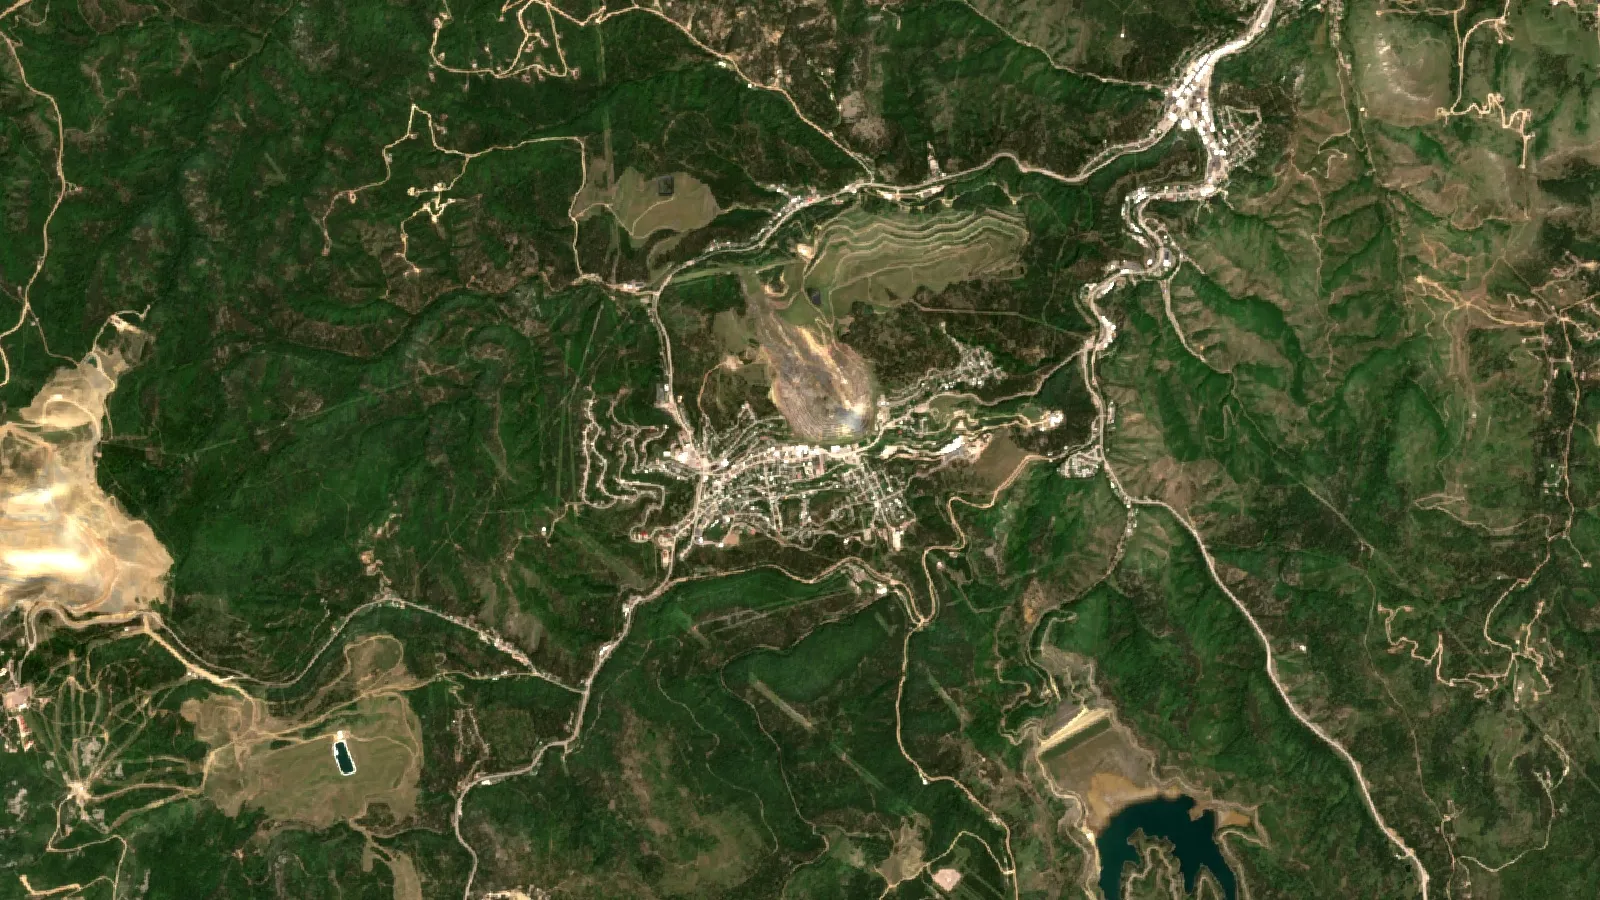
Iron and gold are not always separate. Some of the world’s gold sits inside iron-rich rock. Banded iron formation, a sedimentary rock of alternating iron mineral and chert layers, can host gold when hot fluids move through it during mountain building. A Laurentian University thesis on four Canadian examples (Meadowbank, Meliadine, Musselwhite and Beardmore-Geraldton) describes Algoma-type banded iron formations as a favourable host rock for orogenic gold in several Archean cratons (Gourcerol, Laurentian University, 2016).
The US example is the historic Homestake mine in Lawrence County, South Dakota, which closed in 2002 (US Department of Energy). The 1994 EPA review lists it as a deposit hosted in an Archean iron formation, with gold in quartz veinlets in distinct horizons of the rock (US EPA). The point for a project owner is that the iron is not the prize here. It is the host rock and the guide. The ore grade is set by the gold, which is why Meadowbank (3.41 g/t) and Meliadine (4.77 g/t) report in grams, not percent.
For Canadian gold camps, see our guide to the Abitibi greenstone belt, and the public data to check before staking is in our note on Ontario Geological Survey and MINFILE data.
Iron oxide at the surface: a clue, not a result
Rust-coloured iron oxide at the surface shows up clearly in satellite images, because iron minerals reflect light in distinct bands. Explorers use it as one clue among several, with clay minerals, silica and faults, to rank ground for follow-up. It does not mean there is gold, and it does not mean there is a minable iron deposit. Both need drilling. Satellite work screens a licence area and produces exploration targets that sit ahead of any resource estimate; it does not replace sampling.
If you hold a licence and want that screen, Farmonaut’s satellite mineral detection page explains the method, and a quote request or a message to the team starts a scoping conversation. For a Canadian example of reading satellite signals against a claim map, see our Golden Triangle survey.
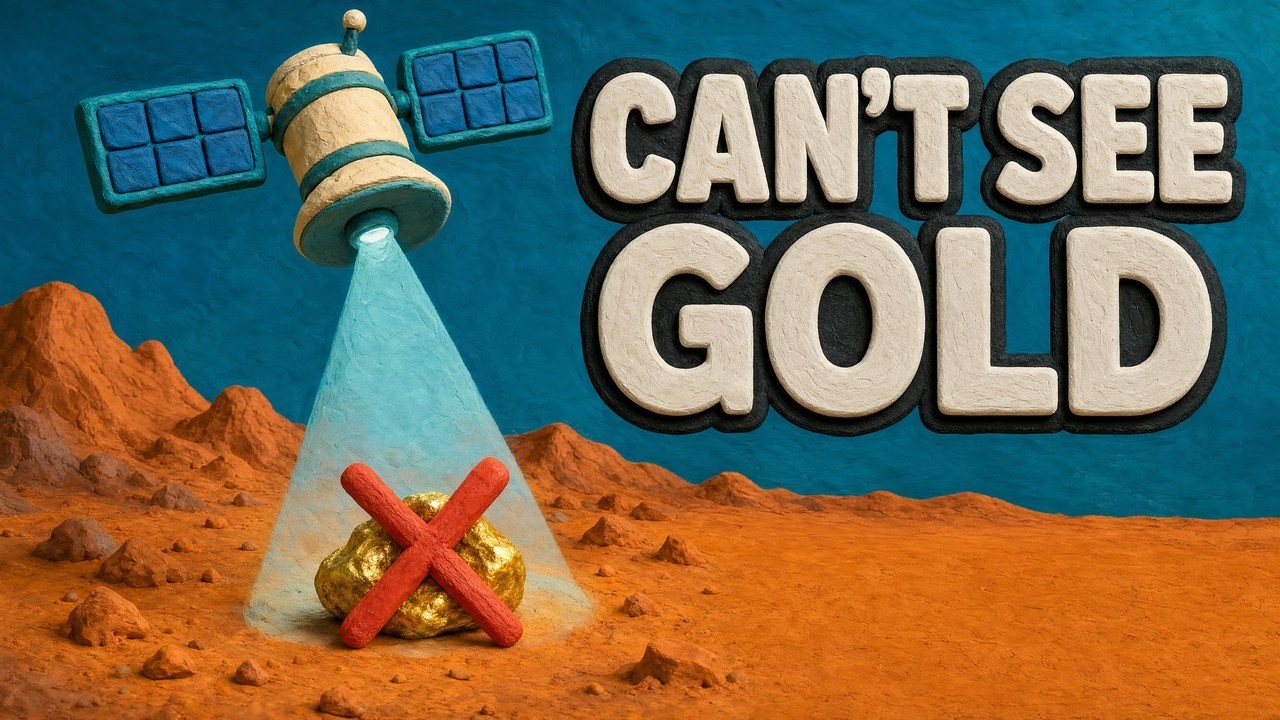
▶ Explains how satellites map the rusty iron stains, clay minerals and faults that sit around a gold system. · 4:25
Compare the value of a tonne of iron ore and gold ore
Use the calculator to compare what a tonne of each is worth before costs. It uses your own grade and price inputs. The default values are round examples, not benchmarks.
Calculator
What is a tonne of gold ore worth next to a tonne of iron ore?
Enter your own grade, recovery and prices. Results are before any mining, processing or freight cost.
- Iron ore value per tonne mined (US$): $81 US$/t
- Tonnes of gold ore per ounce recovered: 34.6 t/oz
- Gold value as a multiple of iron value: 1.43 x
Example values only, not benchmarks or forecasts. Both prices are inputs: example, use today’s price (US$). One troy ounce is 31.1035 grams. Iron ore value is price times the saleable share of each tonne mined.
Reserves and how long they last
USGS estimates world iron ore reserves at 200,000 million tonnes of crude ore, holding 87,000 million tonnes of iron, and world gold reserves at 66,000 tonnes. Dividing reserves by 2025 output gives about 77 years for iron ore and 20 years for gold. This is a simple ratio. Reserves are what can be mined at today’s prices and costs, and they change as new ore is found or prices move, so it is not a forecast of depletion.
The USGS also estimates world iron ore resources at more than 900 billion tonnes of ore. Resources are a wider category than reserves: they include ore that is not yet economic.
We cover a connected topic in Gold vs Copper Mining: Costs, Grades and Margins.
Frequently asked questions
Is iron ore mining more profitable than gold mining?
Neither is better on its own. Iron ore earns a modest margin per tonne at most mines, on a huge tonnage. Rio Tinto’s Pilbara is the low-cost end: US$25.0 per wet tonne against US$85.2 realised in the first half of 2026, a gap of about US$60 before royalties and tax. Mineral Resources’ Onslow Iron cost US$52 per wet tonne. Gold earns a large margin per ounce on a small tonnage, but it needs a mill and tight cost control.
What is the typical grade of gold ore compared with iron ore?
Gold ore at large mines is about 1 g/t: Detour Lake 0.97 g/t and Canadian Malartic 1.06 g/t in the second quarter of 2026. Iron ore is graded in percent: the Platts 61% Fe index is the price reference Rio Tinto uses for the Pilbara, and its first Simandou sales averaged 65.8% Fe.
Which countries mine the most iron ore?
Australia and Brazil lead among the countries USGS lists, at an estimated 980 and 420 million tonnes in 2025. The chart on this page shows selected countries, not a full ranking.
Can gold and iron ore be found in the same deposit?
Yes, but usually as host rock and metal, not as two ores. Banded iron formations host gold at Homestake in South Dakota and at Meadowbank, Meliadine and Musselwhite in Canada.
How many tonnes of ore make one ounce of gold?
Divide 31.1035 by the grade in g/t, then adjust for recovery. At 1 g/t and 90% recovery that is about 35 tonnes of ore per ounce.
Why is iron ore so much cheaper per tonne than gold?
Gold is far rarer in rock. The world mines about 790,000 times more iron ore than gold by weight, so each tonne of iron ore sells for tens of dollars, while an ounce of gold was priced at about US$4,026 as of 30 June 2026.
Is gold a by-product of iron ore mining?
Not usually. Gold is more often a by-product of copper: about 7% of US gold in 2025 came from base-metal ores, mainly copper (USGS).
What does it cost to run an iron ore mine?
It depends on scale and location. Rio Tinto reported US$25.0 per wet tonne at its Pilbara operations; Mineral Resources reported US$52 per wet tonne at Onslow Iron for the year to June 2026.
Can satellites find iron ore or gold?
Satellites map surface minerals such as iron oxide and clay, and structures such as faults. They cannot see through thick cover or measure grade. Results are exploration targets that need ground sampling.
Where can I check the legal rules for a licence?
Use the mining regulator or cadastre in your country, and a lawyer. Rules differ widely between regions.
This page is for information only. It is not investment advice. Prices are dated and sourced, not forecasts. Rules for licences and claims differ by region: confirm them with the regulator.
Farmonaut mining
Map your mining site from space
Consultants can screen a licence area for iron oxide, clay and structure, giving exploration targets that sit ahead of a resource estimate.

Mining Pro sample view, synthetic data
Keep reading
Sources
- USGS, Mineral Commodity Summaries 2026: Iron Ore: pubs.usgs.gov
- USGS, Mineral Commodity Summaries 2026: Gold: pubs.usgs.gov
- Rio Tinto, Half-year results to 30 June 2026: riotinto.com
- Rio Tinto, Fourth quarter 2025 production results (ASX, 21 January 2026): announcements.asx.com.au
- BHP, FY2026 results presentation (ASX, 18 August 2026): announcements.asx.com.au
- Mineral Resources, June 2026 quarterly report (ASX, 29 July 2026): announcements.asx.com.au
- Agnico Eagle, Second quarter 2026 report: s205.q4cdn.com
- US EPA, Technical Resource Document: Extraction and Beneficiation of Ores and Minerals, Gold: archive.epa.gov
- Gourcerol, Characterization of banded iron formations associated with gold mineralization (Laurentian University, 2016): laurentian.scholaris.ca
- World Gold Council, Guidance note on non-GAAP metrics: all-in sustaining costs and all-in costs: gold.org
- US Department of Energy, Group of scientists walk the Homestake mine: energy.gov
Discussion
Questions, corrections or field experience? Share them below. First-time comments are reviewed before they appear, and your email is never published.
No comments yet. Be the first to add a question or your experience.

 Southbridge & Wess PDC Ltd
 Qader Group
 Ileys General Trading
 SG Gold Mining LLC
 VRV Global Pte Ltd
 Omsri International FZE
 G.I.T.T.
 Jaunita Erss Ltd
 Almosi SARL
 SRK Consulting
 Berks Gold Limited
 Mwerezi Minerals Company Limited
 Mining SARL
 SenGold Invest SAS
 Sean Mining Limited
 NTS Group (Pty) Ltd
 Mine4Africa
 Lithspo Minerals Limited
