

Public geoscience data · Canada
Ontario Geological Survey, MINFILE and SIGÉOM Before Staking
The Ontario Geological Survey, the BC Geological Survey, Geoscience BC, Quebec’s SIGÉOM and the Saskatchewan and Manitoba surveys publish free occurrence, drill-hole, assessment-report and geochemistry data that let a junior see what is known about a block, and what has never been tested, before it registers a single cell.
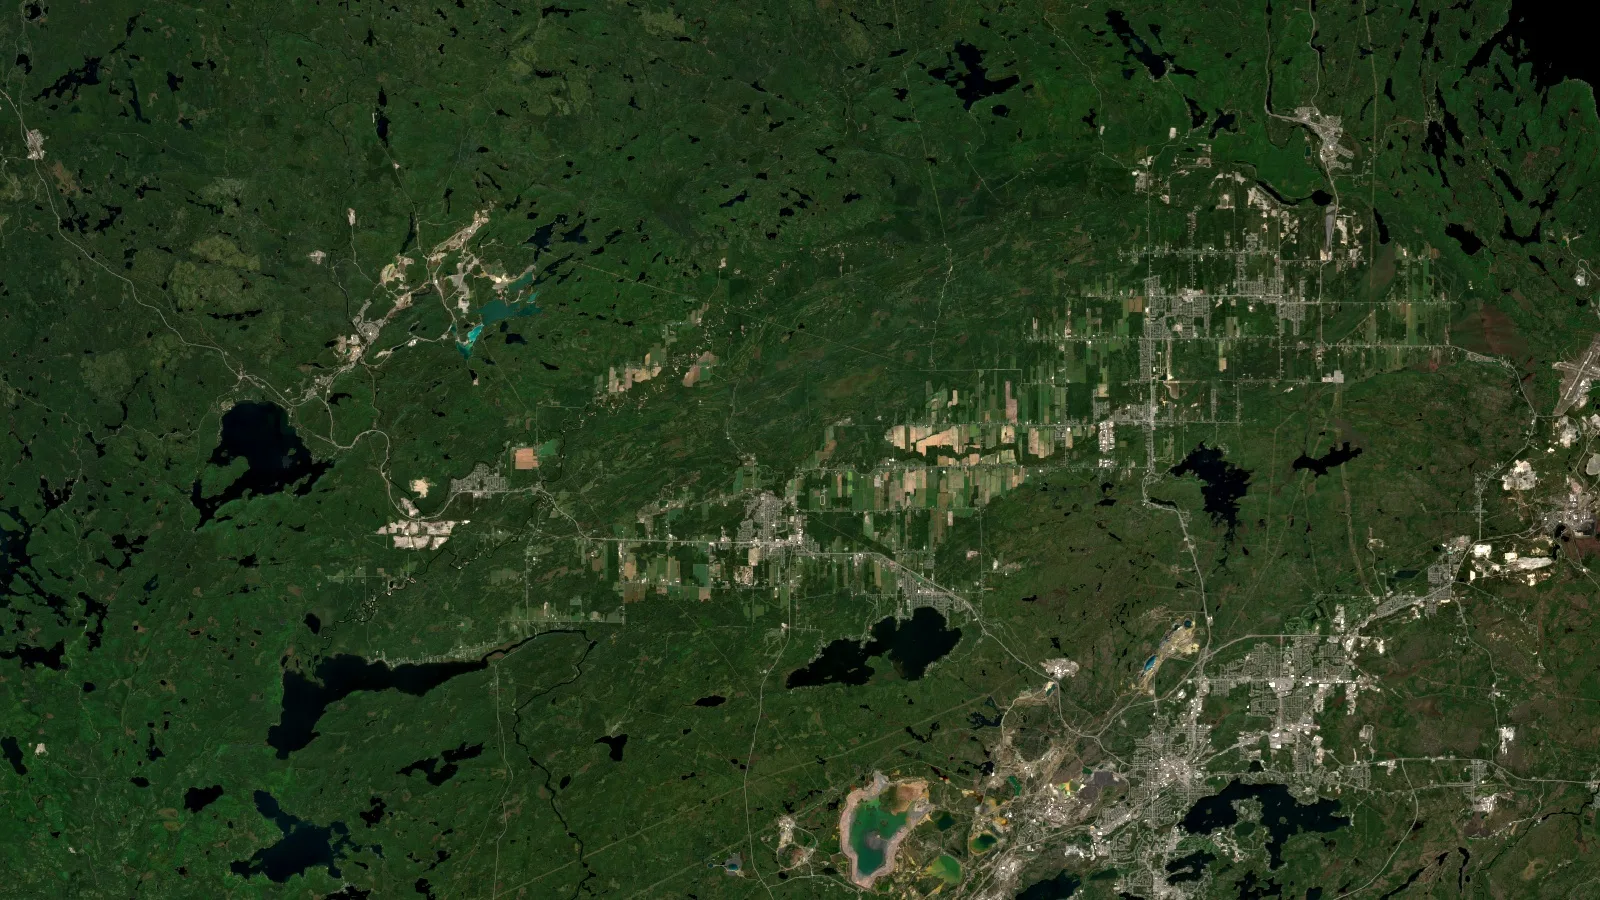
Key takeaways
- The Ontario Geological Survey publishes its maps, reports and digital data free through GeologyOntario, and OGSEarth turns the main layers into KML files for Google Earth Pro.
- Ontario’s Mineral Inventory holds more than 19,000 occurrence records and its Drill Hole Database more than 158,000 holes.
- Our count of BC MINFILE on 15 October 2026 found 16,261 records: two in three are showings, and only 98 are recorded producers.
- Quebec’s SIGÉOM holds geoscience data gathered since 1875; Saskatchewan’s Mineral Deposit Index lists 6,012 occurrences.
- Public data shows where people have looked. The gaps between their work, read against open ground and satellite screening, are where new claims usually start.
In this article
- Why the Ontario Geological Survey and its peers come before staking
- Ontario Geological Survey data: GeologyOntario, OGSEarth and the drill-hole file
- British Columbia: BC MINFILE, MapPlace 2 and Geoscience BC
- Quebec: SIGÉOM, EXAMINE and GESTIM
- Saskatchewan and Manitoba: SMDI, GeoAtlas and the Map Gallery
- The systems compared, and a density check for your block
- A pre-staking workflow using Ontario Geological Survey, BC and Quebec data
- Limits of public geoscience data, and how to work around them
- Questions juniors ask about Ontario Geological Survey and BC MINFILE data
The Ontario Geological Survey is usually the first stop for a junior looking at Ontario ground, and its counterparts in British Columbia, Quebec, Saskatchewan and Manitoba play the same role in their provinces. Each one publishes, free, the occurrence records, drill holes, old company reports and regional surveys that tell you what is already known about a piece of land. This guide is about using that material in the weeks before staking: which system answers which question, what the numbers inside them actually say, and where the public record runs out.
We have already written a broad tour of survey agencies in Canada, Australia and elsewhere, with a calculator for when confidential reports go public: see BC Geological Survey and other agencies: free geology data. This page goes further on the Canadian systems a TSX, TSXV or CSE-listed explorer uses every week, and adds our own count of the BC databases. For the wider picture of claims and gold districts across the country, see our overview of gold exploration in Canada.
Only 98 of 16,261 BC MINFILE records are listed as producing mines.
Why the Ontario Geological Survey and its peers come before staking
What does a land manager actually need to know before registering cells? Three things: whether the ground is open, whether anyone has found anything on it, and how well they tested it. The first answer comes from the claim registry. The other two come from the provincial geological surveys, and they are the cheapest information an exploration company will ever buy, because they cost nothing but time.
The provinces own their mineral rights, so each one runs its own survey, its own occurrence inventory and its own archive of the technical reports companies file to keep claims in good standing. Ontario, British Columbia and Quebec have the deepest archives. Saskatchewan and Manitoba are smaller but well organized. A desk study that pulls from the right system for each province can rule out a block in an afternoon, or move it to the top of the list.
There is a commercial reason too. Investors in a junior’s next financing will ask what the company knew when it picked the ground. A geologist who can point to the Ontario Geological Survey occurrence record, the historical drill holes and the gaps between them has a stronger answer than one who staked because a neighbour made a discovery. Public data is also where the qualified person for a future technical report will start; our page on NI 43-101 rules for qualified persons and resources explains why historical numbers found there cannot simply be repeated as resources.
Ontario Geological Survey data: GeologyOntario, OGSEarth and the drill-hole file
The province describes the Ontario Geological Survey as the steward of Ontario’s public geoscience data. Its work falls into three parts: geological mapping and surveys, geoservices (the Geo Labs in Sudbury, cartography and publishing, and the library and archives) and local expertise through the Resident Geologist Program, which runs eight regional offices and publishes monthly reports on mining and exploration activity. Maps, reports and digital data are published online and are free to download.
For an explorer, the survey’s output reaches you through two doors. GeologyOntario is the search and download site for the databases. OGSEarth packages the same material as map layers you can open in Google Earth Pro. Most people need both: GeologyOntario to find and read a specific report, OGSEarth to see everything around a target at once.
GeologyOntario: search, read and download
GeologyOntario is where the Ontario Geological Survey publishes its maps, reports and data, and where its databases are searched. Each database can be downloaded as a packaged product. The Ontario Mineral Inventory (OMI, the renamed Mineral Deposit Inventory) holds more than 19,000 records on metallic and industrial mineral occurrences, with location, geological setting, exploration history and, where available, production and resource data. It is maintained by the Resident Geologist Program and draws on survey publications, assessment files, company press releases and NI 43-101 reports.
The OMI ranks each record into eight status classes, from occurrence and discretionary occurrence through prospect and developed prospect (with or without reserves or resources), to past-producing and producing mines. That ladder matters more than the point count. A block with forty “occurrences” may have less behind it than a block with one developed prospect that has a historical resource.
The Ontario Drill Hole Database is the second file every land manager should pull. It holds more than 158,000 percussion, overburden, sonic and diamond-drill holes, with collar location, company, hole number, orientation, depth and overburden depth. It also notes whether assays exist for gold, silver, copper, zinc, lead, nickel and platinum-group elements, and it carries the assessment file number so each hole can be traced to the report it came from. Both databases download as a relational database or an ESRI shapefile.
OGSEarth: the Ontario Geological Survey in Google Earth
OGSEarth delivers Ontario Geological Survey data as KML files, many with GIS downloads alongside. The mining and exploration set covers mining claims, the Ontario Assessment File Database, the drill-hole database, the Mineral Inventory, abandoned mines and mineral exploration activity reports. The page recommends the free Google Earth Pro desktop or mobile versions and warns that the browser version does not display all data.
The regional layers are what make OGSEarth more than a viewer. LakeGeochemON compiles more than 65,000 lake-sediment sample locations and 5.7 million analytical values from 45 publications released between 1995 and 2018. A specific-gravity file holds more than 26,000 georeferenced records. There are aeromagnetic and gravity layers, bedrock geology at 1:250,000, Quaternary geology, geochronology and a critical-minerals layer. The OGSFocus index is refreshed every two weeks.

▶ How satellite imagery and soil geochemistry are combined to look for copper and gold in BC before claims and crews are committed. The same logic applies to Ontario lake-sediment data. · 3:11
Lake-sediment geochemistry suits much of northern Ontario, where glacial cover and forest hide bedrock. A cluster of high gold, arsenic or base-metal values in lakes draining a block is a reason to look harder; a block with no samples at all is a gap, not a negative. Read the survey’s own notes on sample density before you draw a conclusion either way.
From the Ontario Geological Survey map to the claim map
Data tells you what is there; tenure tells you whether you can have it. Ontario registers claims online through the Mining Lands Administration System (MLAS). Anyone can use the MLAS Map Viewer to see active unpatented claims, but registering a claim needs an MLAS account and a valid prospector’s licence. Before any early exploration on a claim, the exploration plans and permits regulation, O. Reg. 308/12, sets notice duties to surface rights owners and to the Indigenous communities the Director identifies. General information, not legal advice; confirm with the Ministry of Energy and Mines and the Provincial Mining Recorder.
Read the Ontario Geological Survey layers and the MLAS map side by side. Claims that have lapsed over a known occurrence are worth a second look. Withdrawn areas, parks and alienated land are not. For the costs of registering and holding Ontario cells, our Canada claims overview has a calculator; for the gold camps themselves, see gold deposits in Ontario by camp and belt.
British Columbia: BC MINFILE, MapPlace 2 and Geoscience BC
British Columbia has two public sources that work side by side. The BC Geological Survey, inside government, runs BC MINFILE, the ARIS assessment report index and the MapPlace 2 web map. Geoscience BC, a separate not-for-profit society, funds and publishes new regional surveys. A junior working the Golden Triangle, the Quesnel trough or the Kootenays will use all of them.
BC MINFILE by the numbers: our count
The MINFILE search page showed 16,261 records when we checked on 15 October 2026. To see what sits behind that total, we downloaded every record’s attributes from the province’s MINFILE open data layer on the same day and counted them by status, commodity and tectonic belt. Our total matched the search page exactly.
The result is a useful reality check. Two in three MINFILE records (10,848) are showings: mineralization seen at surface, in a trench or in a hole, with little or no follow-up. A further 2,634 are prospects and 616 are developed prospects. There are 2,009 past producers, many of them small historic workings, and just 98 records listed as producers.
Chart
What 16,261 BC MINFILE records are
Count of mineral occurrence records by status, all of British Columbia
Status is not the only filter. MINFILE flags 1,688 records with production data and 979 with reserve or resource figures, though any of those numbers may be historical and pre-date NI 43-101. By tectonic belt, 7,029 records sit in the Intermontane Belt, 4,117 in the Omineca, 2,401 in the Insular, 1,860 in the Coast Crystalline and 852 in the Foreland Belt. That spread reflects both geology and a century of access by road and rail.
Commodities tell a similar story. Counting every record that names a metal among its first five commodity codes, copper appears on 9,264, silver on 8,233 and gold on 7,977, followed by zinc, lead and molybdenum. BC MINFILE is a porphyry and polymetallic-vein inventory first, which is why so many gold targets in the province are copper-gold systems.
Chart
Which metals BC MINFILE records list most
Occurrences naming the metal among their first five commodity codes
What 42,067 BC assessment reports show about exploration cycles
ARIS indexes the technical reports filed to keep BC claims in good standing. Our download of the ARIS layer on 15 October 2026 returned 42,067 reports. We counted them by report year and by general work type only; we did not download or rank any operator or owner names.
The yearly counts trace the exploration cycle. Reporting climbed through the 1970s, peaked at 1,334 reports in 1986, and fell to 249 in 2003, the lowest since 1966. It recovered to 962 in 2008 and reached 940 in 2022. The most recent years will keep rising as reports filed for them are processed and released, so read the right-hand end of any yearly chart with care.
Chart
BC assessment reports indexed in ARIS, by report year
Reports per year, selected years at five-year steps (42,067 reports in all)
Work types show what juniors actually spend on. Geochemistry appears in 27,336 reports, geology in 12,956 and geophysics in 12,808. Drilling appears in only 7,137, about one report in six. And 19,252 reports, close to half, cite at least one MINFILE number, which is the quickest way to move from an occurrence to the work done on it. Our guides to geophysical survey methods and exploration drilling explain how to judge the quality of what you find.

▶ A southern BC program combining soil sampling, induced polarization and lidar, the kind of work that ends up as a public assessment report in ARIS. · 2:47
MapPlace 2: the BC data on one map
MapPlace 2 is the BC Geological Survey’s web map, built in-house on open-source software. The survey’s paper on its development says the original MapPlace went public in 1997, and that MapPlace 2 lets users browse, search, report on and analyze data from geoscience, mineral resource and tenure databases in any browser without plug-ins. At the time of writing, its till geochemistry layer held nearly 10,500 samples from 39 surveys, and its publication catalogue reached back to 1874.
Use MapPlace 2 the way you use OGSEarth in Ontario: put MINFILE points, ARIS report footprints, geochemistry, geophysics and current mineral titles on one screen, then decide which reports to download. The tenure layer comes from the Mineral Titles Online registry, so it shows open and held ground in the same view.
Geoscience BC: regional surveys a junior cannot afford alone
Geoscience BC describes itself as a not-for-profit society that manages and co-funds independent geoscience research with partners in industry, government, communities and Indigenous groups. It reports more than 235 public research projects completed since 2005, and says each dollar invested in minerals research influences more than seven dollars of exploration investment (its own figure). Its Earth Science Viewer brings together project and report data from Geoscience BC and its partners, with more than 200 projects searchable.
For a junior, Geoscience BC matters most for regional airborne geophysics and geochemistry that cover whole districts. Those surveys are released publicly, so the company that reads them first and stakes the anomaly nobody has followed up gets the advantage. In Ontario, the aeromagnetic, gravity and geophysical-survey layers on OGSEarth do a similar job. Our page on airborne geophysical surveys explains what those datasets can resolve.
Ontario’s Drill Hole Database lists more than 158,000 holes, each traceable to its source report.
Where should new cells go once the archive is read? Our satellite-based mineral detection service maps alteration, structure and spectral anomalies over a whole area of interest, so the gaps between old report footprints can be ranked before any money is spent on ground. You can Map Your Mining Site at mining.farmonaut.com by drawing or uploading the boundary you are considering.
Quebec: SIGÉOM, EXAMINE and GESTIM
Quebec keeps its geoscience in one system. The government describes SIGÉOM as a free spatial information system holding geoscience data gathered since 1875. Through it you can view geoscience and mining-activity data on an interactive map, download data as shapefile, FGDB and other formats, connect web map services to your own GIS, and search reports in the EXAMINE document bank. The themes cover bedrock and Quaternary geology, geophysics, geochemistry, descriptions of mineralization, diamond-drill-hole data, exploration activity, mines and mining projects.
EXAMINE is where the statutory reports filed by companies (the “GM” series) and government reports live. For a junior, SIGÉOM does in one place what Ontario splits between GeologyOntario and OGSEarth, and what BC splits between MINFILE, ARIS and MapPlace 2. The trade-off is that much of the interface and report text is in French, which is worth planning for if your team is not bilingual.
Tenure in Quebec runs through GESTIM, the mining title management system. Its members apply online for a map designation of an exclusive exploration right (EER), renew titles, pay fees and file annual work reports. Note the term: the government’s GESTIM page speaks of an exclusive exploration right rather than a claim. Non-members can browse the public register and the interactive map, so a land manager can check open ground against SIGÉOM layers before designating. General information, not legal advice; confirm with the Ministère des Ressources naturelles et des Forêts.

▶ How satellite and geochemical methods are being applied to Canadian critical-mineral targets, the kind of ground SIGÉOM and OGSEarth layers help you screen first. · 2:25
Saskatchewan and Manitoba: SMDI, GeoAtlas and the Map Gallery
Saskatchewan’s occurrence file is the Saskatchewan Mineral Deposit Index (SMDI), which the Saskatchewan Geological Survey describes as a dataset of all known mineral occurrences in the province. The May 2024 release holds 6,012 points and is maintained annually. Each record carries primary and associated commodities, discovery type, status (for example “Deposit: Production” or “Anomaly: Geochemical”) and flags for production and reserve or resource data. The data come under the province’s Standard Unrestricted Use Data Licence, which asks users to cite the layers and the date used.
The SMDI is viewed and downloaded through the Saskatchewan Mining and Petroleum GeoAtlas, alongside geology and geophysics. Tenure sits in MARS, the Mineral Administration Registry Saskatchewan. For uranium explorers in the Athabasca Basin, the SMDI’s status field is the fastest way to separate drilled deposits from geochemical anomalies.
Manitoba’s GIS Map Gallery lets users query mining claims, exploration licences, mineral leases, assessment files, disposition history, drill-hole locations, geology, geophysics, geochronology, mineral occurrences and kimberlite indicator minerals in one viewer. The Mineral Deposits Database is updated through GeoFiles: GeoFile 5-2025, “Updates to the Manitoba Mineral Deposits Database”, was released on 12 November 2025. The Bibliography of Manitoba Geology covers more than 14,900 publications.

▶ A look at newer soil-based methods being tested in Manitoba's critical-mineral districts, next to the occurrence and drill-hole layers in the Manitoba Map Gallery. · 2:38
The systems compared, and a density check for your block
Which system answers which question? The table below lines up the main public tools by province. Counts are each agency’s own figures or our download on 15 October 2026, so check the source for a newer number.
| Province | Occurrences | Reports and drill holes | Map viewer | Claim registry |
|---|---|---|---|---|
| Ontario | Ontario Mineral Inventory, 19,000+ records | Assessment files; Drill Hole Database, 158,000+ holes | OGSEarth (KML), GeologyOntario | MLAS |
| British Columbia | BC MINFILE, 16,261 records | ARIS, 42,067 reports | MapPlace 2; Geoscience BC Earth Science Viewer | Mineral Titles Online |
| Quebec | SIGÉOM mineralization data | EXAMINE statutory reports; SIGÉOM drill holes | SIGÉOM interactive map | GESTIM (EER) |
| Saskatchewan | SMDI, 6,012 points (May 2024) | Production and resource flags in each SMDI record | Mining and Petroleum GeoAtlas | MARS |
| Manitoba | Mineral Deposits Database (GeoFile updates) | Assessment files and drill holes in the Map Gallery | GIS Map Gallery | Map Gallery tenure layers |
How busy is your block compared with the province? Divide each province’s record count by its land area and you get a crude average density: about 17.6 MINFILE records per 1,000 km² in BC, 20.7 Ontario Geological Survey inventory records and about 172 drill holes per 1,000 km² in Ontario. A block with far more records than the average has been looked at hard; one with none may be under cover, remote or simply ignored. The calculator does the arithmetic.
Calculator
Is your area under-explored compared with the provincial average?
Enter the area you are reviewing, the occurrence records you counted inside it and the provincial average density.
- Your density (per 1,000 km²): 30.0
- Your area against the average (times): 1.70
- Ontario drill holes expected at the average: 17.2 holes
Averages are province-wide record counts divided by land area. BC: 16,261 MINFILE records (Farmonaut count, 15 October 2026) over 925,186 km², about 17.6 per 1,000 km². Ontario: 19,000+ Ontario Mineral Inventory records (about 20.7 per 1,000 km²) and 158,000+ Drill Hole Database holes (about 172.2 per 1,000 km²) from the Ontario Geological Survey, over 917,741 km² (Statistics Canada Table 15.6). Saskatchewan’s SMDI works out at about 10.2 per 1,000 km². Real densities vary enormously by belt and access; a ratio is a prompt to read the reports, not a measure of prospectivity. Confirm counts on the agency sites.
With the defaults, a 100 km² block in BC would hold about 1.8 MINFILE records at the provincial average. Three records puts it at 1.7 times the average: busy enough to have reports worth reading, not so busy that every outcrop has been sampled. In Ontario the same block would average about 17 drill holes in the Ontario Geological Survey file, so a block with none is a gap worth explaining.
A pre-staking workflow using Ontario Geological Survey, BC and Quebec data
The order matters more than the tools. The infographic sets out six steps we see experienced land managers follow, whichever province they are in.
Infographic
Six steps from public data to a claim application
- 1Check open groundMLAS Map Viewer, Mineral Titles Online, GESTIM or MARS show what is held today.
- 2Pull occurrencesOMI, MINFILE, SIGÉOM or SMDI points for the block and a buffer around it.
- 3Read the historyAssessment files and drill holes: what was tested, how deep, and the gaps.
- 4Layer surveysLake and till geochemistry, airborne magnetics and bedrock geology from OGSEarth or MapPlace.
- 5Screen and rankSatellite alteration and structure maps over the gaps rank the cells worth holding.
- 6Register, then planClaim or EER online; then exploration plans or permits and community notice.
Step one is a quick look at the claim map, because there is no point studying ground that is held, withdrawn or in a park. Steps two and three are the Ontario Geological Survey, BC Geological Survey or SIGÉOM work described above: occurrences, then the reports and drill holes behind them. Step four layers the regional surveys, such as OGSEarth lake geochemistry or Geoscience BC airborne magnetics, to see whether the known occurrences sit on a larger trend.
Step five is where satellite screening earns its place. Public data is dense where people have worked and thin where they have not. Our satellite analysis looks at multispectral and hyperspectral signatures for alteration halos, faults and fractures across the whole block, including the gaps between old report footprints. We have scanned more than 100,000 hectares for over 20 mineral types in more than 25 countries, usually reducing early-exploration timelines from months to days and lowering early-exploration cost by up to 80 to 85%. Results arrive in 5 to 20 business days as PDF and georeferenced GIS files, and they are exploration targets to test, not resources. Get a quote for your area, or see a sample of our satellite-driven 3D mineral prospectivity mapping.
Step six registers the ground and starts the permit clock. In Ontario that means MLAS and then an exploration plan or permit under O. Reg. 308/12; in BC a Mineral Titles Online application; in Quebec a GESTIM designation; in Saskatchewan MARS. For portals elsewhere, our mining cadastre guide by country lists the official systems.
Limits of public geoscience data, and how to work around them
Every archive has blind spots, and knowing them is part of the job. First, coverage follows access. Records cluster along roads, rivers and old mining camps, and thin out in the Far North of Ontario, northern Quebec and the BC Coast Mountains. A low count can mean poor ground or no visits.
Second, statuses are not resources. An Ontario Geological Survey “developed prospect with reserves or resources” or a MINFILE record with reserve figures may quote numbers that pre-date current standards. Treat them as history, and never present them as current resources in a disclosure.
- ✔ Use the original reports. Inventories summarize; assessment files, ARIS reports and EXAMINE documents hold the maps, sample sites and assays.
- 📊 Check the vintage. Note the year of every survey you rely on. A 1970s soil grid and a recent multi-element survey are not the same evidence.
- ⚠ Watch glacial cover. Much of Ontario, Quebec and Manitoba sits under till, swamp and lakes, so surface data can miss what lies beneath.
- Read the licence terms. Saskatchewan’s data licence asks you to cite layers and dates; record them in your own reports too.
- Re-download before you decide. The OMI is updated monthly on the Ontario Data Catalogue and claim layers change daily.
Third, cover hides geology. Satellites see the surface, and so do most geochemical surveys. In forested and glaciated terrain, satellite screening works best on outcrop, burns, clear-cuts and alteration in exposed ridges, and it should be read with geophysics. We say this plainly to clients: a satellite target is a reason to go and look, not a discovery.
Questions juniors ask about Ontario Geological Survey and BC MINFILE data
What does the Ontario Geological Survey do?
Is Ontario Geological Survey data free?
What is OGSEarth and how do I open it?
What can I search in GeologyOntario?
What is BC MINFILE?
How many MINFILE records are producing mines?
What is Geoscience BC?
Where are Quebec drill holes and company reports?
Does an occurrence record mean there is a deposit?
Can I stake straight from these maps?
How does satellite data fit with Ontario Geological Survey data?
General information only, not legal, tax or investment advice. Record counts change as agencies update their databases; check each source for the current figure. Farmonaut results are exploration targets that sit ahead of any resource estimate and are not NI 43-101 disclosure.
Farmonaut mineral detection
Screen the gaps before you stake
Send the area you are considering as KML, KMZ or a polygon. Farmonaut returns ranked satellite exploration targets for it, so you can read them against the public occurrence and assessment data before you register ground.

Keep reading
Sources
- Government of Ontario, Ontario Geological Survey (2026): ontario.ca
- Ontario Geological Survey, OGSEarth: geoscience data for Google Earth (2026): geologyontario.mndm.gov.on.ca
- Ontario Geological Survey, Ontario Mineral Inventory description (2026): geologyontario.mndm.gov.on.ca
- Ontario Geological Survey, Ontario Drill Hole Database description (2026): geologyontario.mndm.gov.on.ca
- Ontario Data Catalogue, Mineral Deposit Inventory of Ontario (updated 7 August 2026): data.ontario.ca
- Government of Ontario, Mining Lands Administration System (2026): ontario.ca
- O. Reg. 308/12, Exploration Plans and Exploration Permits, Ontario e-Laws (2026): ontario.ca
- BC Geological Survey, MINFILE mineral occurrence database (2026): minfile.gov.bc.ca
- DataBC, MINFILE Mineral Occurrence Database open data layer (2026): catalogue.data.gov.bc.ca
- DataBC, ARIS Mineral Assessment Reports open data layer (2026): catalogue.data.gov.bc.ca
- BC Geological Survey, Cui et al., MapPlace 2, Paper 2018-1 (2018): cmscontent.nrs.gov.bc.ca
- Geoscience BC, About Geoscience BC (2026): geosciencebc.com
- Geoscience BC, Earth Science Viewer and projects (2026): geosciencebc.com
- Gouvernement du Québec, SIGÉOM geoscience information system (updated 27 August 2026): quebec.ca
- Gouvernement du Québec, Mining title management system GESTIM (updated 2 October 2026): quebec.ca
- Government of Saskatchewan, Mineral Deposit Index metadata (2024): gisappl.saskatchewan.ca
- Government of Saskatchewan, Mineral Administration Registry Saskatchewan (MARS) (2026): saskatchewan.ca
- Manitoba Geological Survey, GIS Map Gallery and databases (2026): gov.mb.ca
- Manitoba Geological Survey, 2025 publications incl. GeoFile 5-2025 (2025): gov.mb.ca
- Statistics Canada, Land and freshwater area by province, Table 15.6 (2012): www150.statcan.gc.ca
Discussion
Questions, corrections or field experience? Share them below. First-time comments are reviewed before they appear, and your email is never published.
No comments yet. Be the first to add a question or your experience.

 CIMISCO SARL
 Mining SARL
 SenGold Invest SAS
 Sania Corporation
 Sean Mining Limited
 NTS Group (Pty) Ltd
 Mine4Africa
 Lithspo Minerals Limited
 Tintina Mining Group
 Dalgety Minerals Pty Ltd
 Vortex Minerals Pty Ltd
 Faith At Work (Pty) Ltd
 Geotech Mining Solutions plc
 Vulcan International Limited
 Kidepo Associates
 GKY Mining
 Alkimy SARL
 Double A Trading
 GemSprout Metals Limited
 Qader Group
 Ileys General Trading
 SG Gold Mining LLC
 VRV Global Pte Ltd
 Omsri International FZE
