

Gold · Ranked list
Top 10 Countries With Most Gold Reserves, Ranked by Tonnes
The United States leads with about 8,133 tonnes, ahead of Germany, Italy, France and China. Every row below carries its data month, and mine reserves get a separate ranking.
Key takeaways
- The United States holds about 8,133 tonnes, more than Germany and Italy combined (September 2026).
- China, at 2,410 tonnes, is 27 tonnes behind France after adding 63 tonnes in the third quarter (World Gold Council).
- Poland entered the top 10 with 673 tonnes after leading reported buying in 2026.
- About 63% of estimated central bank demand in the third quarter was unreported (World Gold Council).
- Gold in the ground ranks differently: Australia 13,000 tonnes and Russia 12,000 tonnes (USGS, 2026).
In this article
- Top 10 countries with the most gold reserves
- Countries ranked 11 to 20 by gold holdings
- Who is buying and selling gold reserves
- Notes on each country in the top 10
- Why gold reserve lists disagree
- How to check gold reserves by country yourself
- United States gold reserves and mine output
- Where the leading holders keep their gold
- Gold reserves in the ground: USGS mine reserves by country
- Size up any holding in tonnes, ounces and US dollars
- Where satellite data fits, and where it does not
- Frequently asked questions
The United States has the most official gold, with about 8,133 tonnes, followed by Germany (3,349), Italy (2,452), France (2,437) and China (2,410), according to central bank figures compiled by Trading Economics for data months up to September 2026. These are the vault holdings of central banks and treasuries. Gold still in the ground gives a very different ranking, led by Australia and Russia.
The top four places rarely change. The places below them do. China has moved within 27 tonnes of France, Russia has been selling, and Poland has climbed into the top ten by buying more than any other central bank in 2026. This page gives the ranking with a date on every row, the three reasons lists disagree, and a five-minute way to check any figure yourself.
Top 10 countries with the most gold reserves
The table ranks countries by official gold holdings in tonnes, the measure used by the World Gold Council reserves table, which is compiled from International Monetary Fund (IMF) statistics. One tonne here is a metric ton of 1,000 kg, or about 32,151 troy ounces. Countries report on different schedules, so read the data month with each row.
Chart
Official gold holdings, largest eight countries
Tonnes, latest data month per country (June or September 2026)
| Rank | Country | Official gold (tonnes) | Data month |
|---|---|---|---|
| 1 | United States | 8,133 | Sep 2026 |
| 2 | Germany | 3,349 | Sep 2026 |
| 3 | Italy | 2,452 | Jun 2026 |
| 4 | France | 2,437 | Jun 2026 |
| 5 | China | 2,410 | Sep 2026 |
| 6 | Russia | 2,264 | Sep 2026 |
| 7 | Switzerland | 1,040 | Jun 2026 |
| 8 | Another Asian holder | 881 | Sep 2026 |
| 9 | Japan | 846 | Sep 2026 |
| 10 | Poland | 673 | Sep 2026 |
Two institutions are left out here because they are not countries. The IMF holds about 2,814 tonnes according to its gold factsheet, which would place it third. The euro area figure of 507 tonnes (December 2025, Trading Economics) is the European Central Bank’s own stock and sits apart from the national holdings of its members.
Two independent checks support the moving rows. The World Gold Council reports that China added 63 tonnes and Poland 40 tonnes in the third quarter, while Russia fell 19 tonnes. Those changes match the difference between the June and September figures in the table within a tonne.
What the top 10 tells you
- The United States holds more than the next two countries combined. Germany and Italy total 5,801 tonnes against 8,133.
- Italy and France are 15 tonnes apart, and neither reported a change between the two latest readings shown by Trading Economics.
- China is the country most likely to change rank soon. At its third-quarter pace of 63 tonnes, the 27-tonne gap to France is less than one quarter of buying. That is arithmetic on past data, not a forecast.
- There is a large step after Russia. Switzerland, in seventh place, holds less than half of Russia’s total.
Countries ranked 11 to 20 by gold holdings
Readers comparing a wider list often need the next ten as well. Several of these countries are active buyers or sellers, so positions here change more often than at the top.
| Rank | Country | Official gold (tonnes) | Data month |
|---|---|---|---|
| 11 | Netherlands | 612 | Sep 2026 |
| 12 | Turkey | 532 | Sep 2026 |
| 13 | Uzbekistan | 446 | Sep 2026 |
| 14 | Taiwan | 424 | Jun 2026 |
| 15 | Portugal | 383 | Jun 2026 |
| 16 | Kazakhstan | 382 | Sep 2026 |
| 17 | Saudi Arabia | 323 | Jun 2026 |
| 18 | United Kingdom | 310 | Sep 2026 |
| 19 | Lebanon | 287 | Mar 2025 |
| 20 | Spain | 282 | Jun 2026 |
Lebanon’s row is older than the others, which is a good example of why the data month matters. Austria (280 tonnes) and Thailand (235 tonnes) come next after Spain in the same list. In this range, gold can make up most of a country’s reserves: the World Gold Council put Uzbekistan at about 90% and Kazakhstan at about 79% of total reserves in August 2026, against about 9% for China.
Who is buying and selling gold reserves
Central banks reported 61 tonnes of net purchases in September 2026, the highest monthly total of the year so far, and 228 tonnes for the year to date, 7% less than a year earlier. Poland and China led the month. Uzbekistan, Kazakhstan, Jordan, the Czech Republic and Bolivia also bought.
Chart
Selected holdings: June to September 2026
Tonnes, selected countries reporting in September
Reported buying is only part of the picture. The World Gold Council estimates total central bank demand at 321 tonnes in the third quarter, against 120 tonnes reported, which means about 63% of the quarter’s demand was unreported. So a ranking built on disclosed holdings can understate some countries. No public table shows who holds the undisclosed part, and any list that assigns it to named countries is guessing.
- Poland had bought 98 tonnes by August, the most of any central bank, towards a 700-tonne target.
- China reported its 22nd straight month of buying in August and had added 80 tonnes by then.
- Russia had sold 56 tonnes by August.
- Turkey had net sales of 82 tonnes by August, most of them in the first quarter.
The motive for buying is also surveyed. In the World Gold Council 2026 central bank survey, with 76 responses, 89% expected global central bank gold reserves to rise over the next 12 months, and a record 45% expected their own holdings to rise. That is what the respondents expected, not a measure of what they later did.
Notes on each country in the top 10
United States. The stock has barely changed for years: USGS shows 8,130 tonnes at every year end from 2021 to 2025. The country is also a working producer, at about 160 tonnes a year.
Germany. Holdings are steady at about 3,349 tonnes. Germany is known for its repatriation programme, covered in the storage section below.
Italy and France. Both hold large stocks with no reported change between the latest two readings, at 2,452 and 2,437 tonnes. Their order would flip only if one of them sold or bought more than 15 tonnes.
China. Gold is still only about 9% of its total reserves, according to the World Gold Council, even after 22 straight months of reported buying to August 2026. It is also the largest mine producer, and it is closing on France.
Russia. It is both the second-largest producer and the largest reported seller among the top 10 this year. Holdings fell from 2,283 tonnes in June to 2,264 tonnes in September.
Switzerland. It held 1,040 tonnes at June 2026, with no change between the two latest readings.
Japan. Its 846 tonnes were unchanged between the June and September readings, which leaves it just below eighth place and 173 tonnes above Poland.
Poland. It reached 673 tonnes in September from 632 in June. Gold was approximately 28% of its total reserves in July 2026, and the World Gold Council reports a target of 700 tonnes.
Just outside. The Netherlands has 612 tonnes and Turkey 532. Poland now sits above the Netherlands by 61 tonnes, which shows how far steady buying can move a country in this part of the table.
Why gold reserve lists disagree
Search for this ranking and you will find totals that differ by tens of tonnes, or lists that look entirely different. Three causes explain nearly all of it.
- Two meanings of “reserves”. Central bank reserves are refined gold owned by a state. Mine reserves are gold in rock that can be mined at a profit. A page that mixes the two can put Australia first and the United States first in the same article.
- Different data months. The World Gold Council table of October 2026 shows most holdings as of June 2026 because IMF data arrive about two months late or more. Trading Economics and central bank websites can be newer. A monthly buyer such as Poland can differ by 40 tonnes between two honest sources.
- Who gets counted. Some lists include the IMF, the European Central Bank or the Bank for International Settlements, which moves every country below them down a place. That is why the World Gold Council described China as the sixth largest reported holder in July 2026, while it is fifth among countries here.
A fourth, smaller cause is rounding between units. The US Treasury reports troy ounces, and most lists report tonnes.
How to check gold reserves by country yourself
This takes about five minutes and works for any country on the list.
- Open the master table. The World Gold Council gold reserves page offers a spreadsheet of official holdings, and its note states the IMF edition and data month.
- Read the latest monthly note. The World Gold Council monthly statistics show who bought and sold since that table was built.
- Go to the primary source for the country. For the United States, that is the US Treasury gold dataset, which is updated monthly and gives fine troy ounces by storage location.
- Convert the units. Divide troy ounces by 32,150.7 to get tonnes.
- Write the date beside the number. Compare two countries only after noting both data months.
Consultants quoting these figures in a report should cite the data month and the publisher together, for example “2,410 tonnes, September 2026, as compiled by Trading Economics”. A tonnage without a date cannot be checked by the reader.
United States gold reserves and mine output
The Treasury gold reserve was about 261.5 million fine troy ounces, or 8,133 tonnes, as of 31 October 2026. The USGS Mineral Commodity Summaries 2026 list the same stock as 8,130 tonnes every year from 2021 to 2025, which shows how little it moves. The Treasury values it at a legal book price of US$42.222 per ounce, set in 1973, so its balance-sheet value bears no relation to the market price.
At the LBMA Gold Price PM of US$3,913 per ounce on Friday 30 October 2026, reported by the World Gold Council, 8,133 tonnes would be worth roughly US$1.02 trillion. Gold prices move daily, so treat that as a dated illustration.
Mining is a separate matter. US mines produced 163 tonnes in 2024 and an estimated 160 tonnes in 2025, according to USGS. Nevada produced about 64% of that and Alaska about 22%. USGS puts US mine reserves at 3,000 tonnes, well below the amount held in vaults.
▶ How gold is mined and refined, from rock to finished metal · 5:27
Where the leading holders keep their gold
Owning gold does not always mean storing it at home. The Bundesbank stated in 2017 that more than half of Germany’s gold was in Germany, after it finished moving metal from New York and Paris to Frankfurt in 2017, ahead of schedule. Storage is also changing elsewhere: in September 2026 the Dutch central bank announced a move of 86 tonnes from New York and Ottawa to London to improve liquidity. These moves change location, not ownership, so they do not alter the ranking.
Gold reserves in the ground: USGS mine reserves by country
If you work in exploration or mining, this is the list that matters. A mine reserve is gold in rock that can be extracted at a profit under current conditions. The figures below come from the USGS Mineral Commodity Summaries 2026, published in early 2026. The final column is our own division of reserves by 2025 output, not a USGS figure.

▶ How gold forms and collects in veins, the geology behind mine reserves · 4:16
Chart
Mine reserves, largest eight countries
Tonnes of gold in the ground, USGS estimates
| Country | Mine reserves (tonnes) | 2025 mine output, estimated (tonnes) | Years of output in reserves |
|---|---|---|---|
| Australia | 13,000 | 280 | 46 |
| Russia | 12,000 | 310 | 39 |
| South Africa | 5,000 | 90 | 56 |
| Indonesia | 3,600 | 90 | 40 |
| Canada | 3,200 | 200 | 16 |
| China | 3,200 | 380 | 8 |
| United States | 3,000 | 160 | 19 |
| Brazil | 2,500 | 80 | 31 |
| Kazakhstan | 2,300 | 130 | 18 |
| Peru | 2,200 | 110 | 20 |
| Uzbekistan | 2,200 | 130 | 17 |
| Mexico | 1,400 | 140 | 10 |
| Ghana | 1,000 | 150 | 7 |
| World total | 66,000 | 3,300 | 20 |
USGS notes that Australia’s reserves compliant with the JORC reporting code, or equivalent, were 4,500 tonnes, so the 13,000-tonne figure includes less strictly reported estimates. World mine output of about 3,300 tonnes in 2025 equals about 20 years of the 66,000 tonnes in reserves. That does not mean gold runs out in 20 years, because reserves grow when exploration succeeds or prices rise, and they shrink when costs rise.
Only China and Russia rank near the top of both lists. Germany, Italy and France hold large stocks and are not listed by USGS as named producers. China is the largest producer at about 380 tonnes, yet has only about 8 years of output in reserves. For the full producer ranking, see our guide to the top gold producing countries and the map of gold mines in the world. Investors comparing jurisdictions can read our list of the best countries for gold mining investment, and those comparing operators can use the largest gold mining companies.
Size up any holding in tonnes, ounces and US dollars
The calculator below turns any tonnage into ounces and market value at the price you enter, and shows how many years of a mine output figure it equals. Use it to compare a vault stock with a country’s mines, or a mine reserve with its yearly output.
Calculator
What is this gold holding worth?
Enter a tonnage, a gold price and a yearly mine output.
- Troy ounces: 32,150,700
- Years of that mine output: 10.0
Example values only, not a benchmark. Uses 32,150.7 troy ounces per tonne. Gold price is an input: example, use today’s price. Ignores purity, costs and any effect on the market of a sale this size.
Where satellite data fits, and where it does not
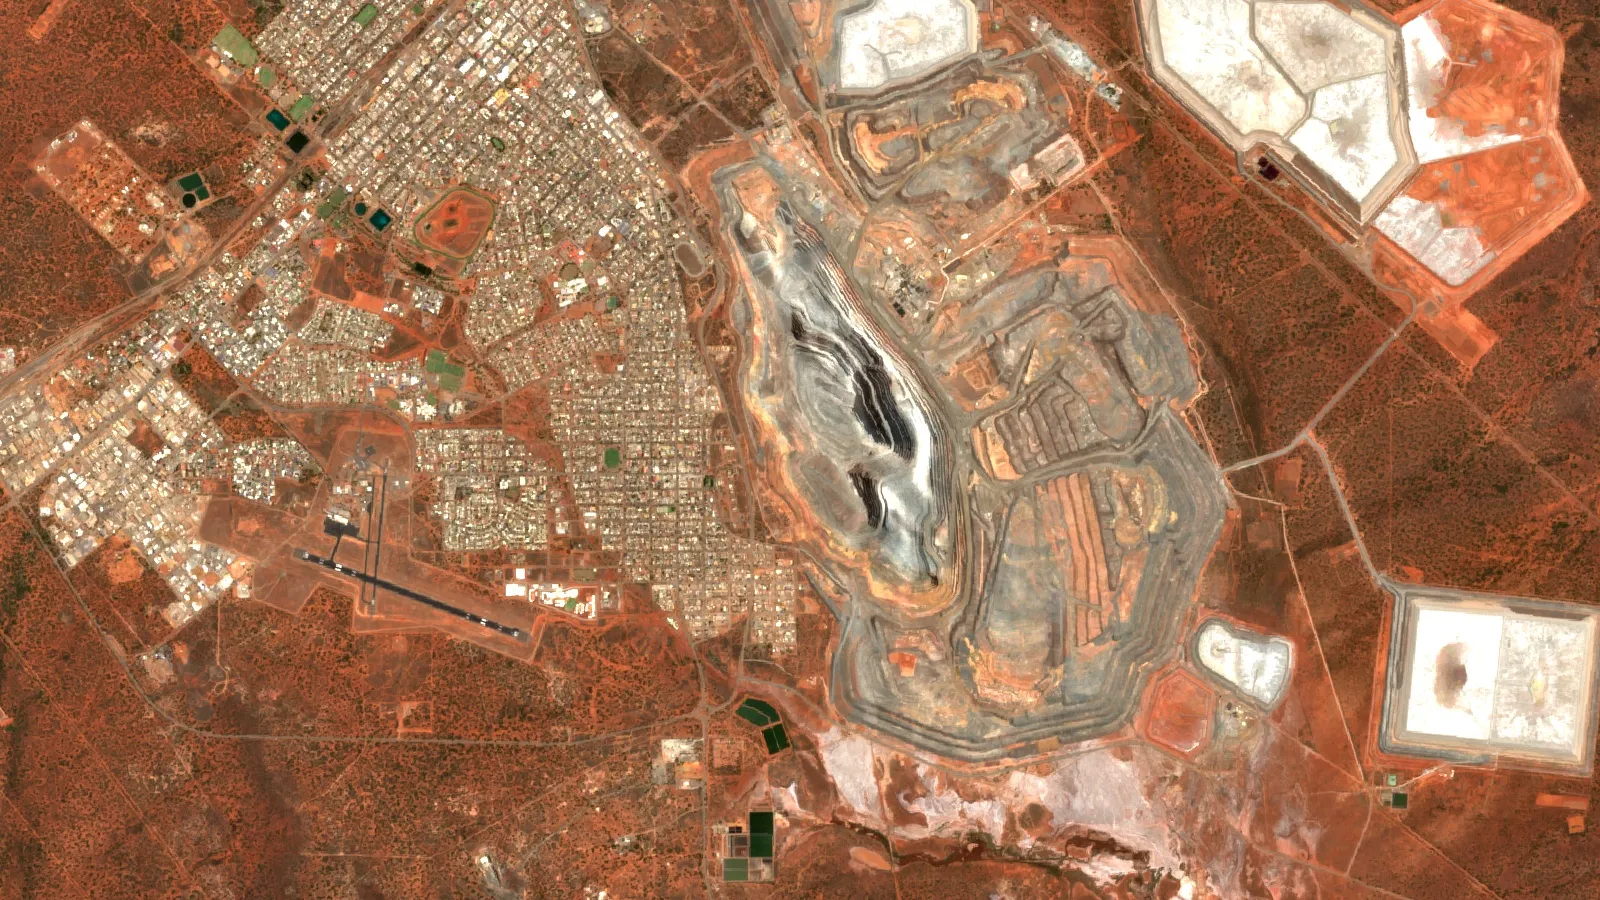
Satellites have no part in central bank accounting. They are useful on the other list, for early work that may later add to mine reserves. Farmonaut’s satellite-based mineral detection screens a licence area for gold targets ahead of field crews. Its results are exploration targets that come before a resource estimate and do not replace drilling. To discuss a site, use the mining query form or contact the team.
▶ What a satellite gold map shows and how to read one · 4:18
Frequently asked questions
Which country has the largest gold reserves?
The United States, with about 8,133 tonnes of official gold (September 2026, Trading Economics). If you mean gold in the ground, Australia leads at 13,000 tonnes on the USGS list, of which 4,500 tonnes meet the JORC code or equivalent.
What are the top 10 gold reserve countries?
By reported central bank holdings, the first seven are the United States, Germany, Italy, France, China, Russia and Switzerland. Japan is ninth and Poland tenth. The table above gives eighth place and the data month for each row.
How much gold does the United States hold?
About 261.5 million fine troy ounces, or roughly 8,133 tonnes, reported by the US Treasury. USGS lists the same stock as 8,130 tonnes.
Does the IMF have more gold than most countries?
Yes. Its factsheet gives about 2,814 tonnes, more than every country except the United States and Germany. It is an institution, so country rankings usually leave it out.
Which country has the highest gold reserves in the ground?
Australia, at 13,000 tonnes, then Russia at 12,000 and South Africa at 5,000, according to USGS Mineral Commodity Summaries 2026.
Which country produces the most gold?
China, at an estimated 380 tonnes in 2025, followed by Russia at 310 and Australia at 280 (USGS). The top five, including Canada and the United States, made about 40% of world output.
Where can I find World Gold Council official gold reserves by country?
On the Gold Reserves by Country page of its Goldhub site, which offers a spreadsheet. Its October 2026 update shows June 2026 holdings for most countries, and its monthly statistics note covers later changes.
How much of the gold ever mined do central banks hold?
The World Gold Council says central banks account for around a fifth of all the gold mined through history.
Which central bank is buying the most gold?
Poland led reported purchases with 98 tonnes for the year to August 2026, ahead of China at 80 tonnes (World Gold Council). In the third quarter alone China led, adding 63 tonnes to Poland’s 40.
Why do gold holdings by country differ between websites?
Sites use different data months, count institutions differently and sometimes mix vault holdings with mine reserves. Compare the data month first.
How often are the figures updated?
The World Gold Council publishes a monthly note and refreshes its table regularly. The US Treasury dataset is monthly. USGS mine reserves are published once a year.
This page is for information only. It is not investment advice.
Farmonaut mining
Map your mining site from space
Consultants can see how satellite data screens a licence area for exploration targets, ahead of a resource estimate.

Mining Pro sample view, synthetic data
Keep reading
Sources
- World Gold Council, Gold Reserves by Country (Oct 2026): gold.org
- World Gold Council, Central Bank Gold Statistics: September 2026: gold.org
- World Gold Council, Central Bank Gold Statistics: August data (Oct 2026): gold.org
- World Gold Council, Central Bank Gold Statistics: July data (Sep 2026): gold.org
- World Gold Council, Gold Demand Trends Q3 2026: Central banks: gold.org
- World Gold Council, Central Bank Gold Reserves Survey 2026: gold.org
- World Gold Council, Weekly Markets Monitor (2 Nov 2026): gold.org
- Trading Economics, Gold Reserves by country (read 5 Nov 2026): tradingeconomics.com
- US Treasury Fiscal Data, U.S. Treasury-Owned Gold: fiscaldata.treasury.gov
- USGS, Mineral Commodity Summaries 2026: Gold: pubs.usgs.gov
- IMF, Gold in the IMF factsheet: imf.org
- Deutsche Bundesbank, Gold reserves: bundesbank.de
Discussion
Questions, corrections or field experience? Share them below. First-time comments are reviewed before they appear, and your email is never published.
No comments yet. Be the first to add a question or your experience.

 Vortex Minerals Pty Ltd
 Faith At Work (Pty) Ltd
 Geotech Mining Solutions plc
 Vulcan International Limited
 Kidepo Associates
 GKY Mining
 Alkimy SARL
 Double A Trading
 GemSprout Metals Limited
 Qader Group
 Ileys General Trading
 SG Gold Mining LLC
 VRV Global Pte Ltd
 Omsri International FZE
 G.I.T.T.
 Jaunita Erss Ltd
 Almosi SARL
 SRK Consulting
 Berks Gold Limited
 Mwerezi Minerals Company Limited
 Mining SARL
 SenGold Invest SAS

 Exploration consultancy · South Africa · Gold










