

ASX miners · Share price guide
Mineral Resources Share Price: ASX MIN Facts and Drivers
MinRes (ASX: MIN) closed at A$44.38 on 15 October 2026, inside a 52-week range of A$40.50 to A$74.94. This page sets out what it earned in the year to June 2026, its debt, dividend and guidance, and a calculator for yield and valuation ratios.
Key takeaways
- MIN closed at A$44.38 on 15 October 2026; the 52-week range was A$40.50 to A$74.94 (StockAnalysis, delayed quote).
- FY26 underlying EBITDA was A$2.6 billion on revenue of A$6.5 billion, with a fully franked dividend of A$0.83 (MinRes, 27 August 2026).
- Net debt fell to A$4.3 billion, 1.7 times EBITDA against 5.9 times a year earlier; the US$765 million POSCO sale would cut it to about A$3.2 billion.
- Onslow Iron earned A$909 million of EBITDA; Wodgina and Mt Marion together earned A$772 million; Mining Services segment EBITDA was A$976 million (company segment table).
- Teck has not merged with Anglo American as of 16 October 2026; China’s approval is outstanding (Anglo American, 23 July 2026; Reuters, 2 October 2026).
In this article
- What is Mineral Resources Ltd (ASX: MIN)?
- Mineral Resources share price: the numbers to know
- Five inputs behind MinRes earnings
- What MinRes earned in FY26
- Lithium: Wodgina, Mt Marion and Bald Hill
- Iron ore: Onslow Iron and the Pilbara Hub
- Mining services, debt and the dividend
- FY27 guidance at a glance
- Risks to MinRes earnings and the dividend
- Mineral Resources and Teck Resources: a short note
- How to check the MIN share price and news yourself
- Work out MinRes yield and valuation ratios
- Satellite view of the mine sites
- Frequently asked questions
Mineral Resources Limited (ASX: MIN, “MinRes”) closed at A$44.38 on 15 October 2026, inside a 52-week range of A$40.50 to A$74.94 (StockAnalysis delayed quote, 15 October 2026). The move is driven mostly by two prices, iron ore and spodumene (the lithium ore mineral), and by how much debt the company still carries. This page gives the dated numbers, what MinRes earned in the year to 30 June 2026 (FY26), and what its own guidance says for the next twelve months.
It also covers the share price questions people ask next: the dividend, the debt, the lithium deals and what happens to the Teck merger story. Prices change every minute, so every price here carries a date and a source. Nothing below is a recommendation to buy or sell.
Related reading on this site: Seabridge Gold Stock and Wallbridge: Price Data, Facts.
We cover a connected topic in Hecla Mining Stock Forecast: Analyst Targets and Facts.
What is Mineral Resources Ltd (ASX: MIN)?
MinRes is an Australian company that has been listed on the ASX for 20 years (MinRes, 27 August 2026). It is not a pure miner. It describes itself as a mining services and diversified resources company with operations in iron ore and lithium, and it also runs a gas exploration program (MinRes FY26 results announcement, ASX, 27 August 2026).
Its income comes from four places:
- Mining Services: crushing, mining and haulage work done for other owners and for MinRes’ own mines. It moved a record 341 million tonnes (Mt) in FY26, the year to 30 June 2026 (FY27 is the year to 30 June 2027).
- Iron ore: Onslow Iron, a large new Pilbara operation in Western Australia, and the smaller Pilbara Hub.
- Lithium: Wodgina, Mt Marion and Bald Hill, which make spodumene concentrate. “SC6” means concentrate at about 6% lithium oxide; “dmt” is dry metric tonnes.
- Energy: gas exploration wells in the Perth and Carnarvon basins planned for FY27.
The mix matters for the stock. A contractor earns fees on tonnes moved whatever the metal price. A miner earns the price minus its cost. MinRes is both, so a fall in iron ore or lithium hits it harder than a pure contractor, but its tonnage fees give it some cushion. MinRes reports in Australian dollars, and so do the figures on this page unless marked US$.
Mineral Resources share price: the numbers to know
The table lists the main market figures with the date of each and where it comes from.
| Item | Figure | Date and source |
|---|---|---|
| Last close | A$44.38 (down 4.85% on the day) | 15 October 2026, StockAnalysis |
| Previous close | A$46.64 | 14 October 2026, FNArena |
| 52-week range | A$40.50 to A$74.94 | As at 15 October 2026, StockAnalysis |
| Shares on issue | About 196.7 million | 15 October 2026, StockAnalysis |
| Market value | About A$8.7 billion (price times shares) | 15 October 2026, StockAnalysis |
| Full-year dividend | A$0.83 per share, fully franked | Declared 27 August 2026, MinRes ASX release |
| Dividend as share of price | About 1.9% at A$44.38 | Calculated from the two lines above |
“Fully franked” means Australian company tax has already been paid on the dividend, which can give Australian-resident holders a tax credit. The dividend was due to be paid on 30 September 2026 to holders on the register at 9 September (MinRes, ASX, 27 August 2026). After the ex-dividend date, a share trades without that payout, which is one reason a price can step down on the day.
The A$74.94 high and the A$44.38 close are far apart. The stock has been volatile within the last twelve months. The sections below show which inputs feed that swing.
Five inputs behind MinRes earnings
Five inputs explain most of the story. Each can be checked in the company’s own reports.
- The iron ore price. In the June 2026 quarter, Onslow Iron sold at an average US$87 per dry tonne, 82% of the Platts 61% iron CFR index, and the Pilbara Hub at US$88, 83% of the index (MinRes quarterly report, 29 July 2026). The discount to the index is the cost of lower-grade ore, so grade and blending choices change profit as well as the index does.
- The lithium price. Sales from Wodgina and Mt Marion in the June 2026 quarter averaged US$2,425 per dry tonne of SC6, up 15% on the March quarter.
- Cost per tonne. Onslow Iron’s FOB cost (the cost of loading ore on the ship, before sea freight) was A$52 a tonne for the year; Wodgina’s was A$738 and Mt Marion’s A$847 per dry tonne of SC6.
- Debt. Net debt was A$4.3 billion at 30 June 2026, down from A$5.4 billion a year earlier (the A$1.1 billion fall is in the results announcement). That is 1.7 times underlying EBITDA, against 5.9 times a year earlier.
- Delivery against guidance. MinRes met or beat its volume and cost guidance in every segment for FY26, and the market reads each quarterly report for repeat performance.
EBITDA means earnings before interest, tax, depreciation and amortisation, a rough measure of operating cash profit. “Underlying” removes one-off items chosen by the company, so compare it with reported profit, not instead of it.
What MinRes earned in FY26
The company called the year its strongest financial result in 20 years of listing (MinRes, 27 August 2026). Revenue was A$6.5 billion, up 44%. Underlying EBITDA was A$2.6 billion, up 183%, a margin of 39%. Underlying net profit after tax (NPAT) was A$822 million, up 831%, and reported NPAT was A$1.2 billion. Capital spending was A$1.2 billion, and liquidity rose to A$2.4 billion.
Chart
Underlying EBITDA by business, year to June 2026
A$ million; Wodgina and Mt Marion on MinRes’ attributable basis; Mining Services shows production only
The jump in profit came off a low base. The company credits higher volumes, the Onslow Iron ramp-up and better lithium prices. Profit a year earlier was small, so the percentage gains look large. Read the dollar amounts and the ratio to debt rather than the percentage jump.
The chart splits the year’s underlying EBITDA by business. Iron ore from Onslow Iron was the largest single block (A$909 million). The two lithium mines together earned A$772 million, and Mining Services production earned A$689 million; the Mining Services segment as a whole, which also includes the Onslow Road Trust, earned A$976 million.
Lithium: Wodgina, Mt Marion and Bald Hill
All three lithium mines are open pits in Western Australia that sell spodumene concentrate, which converters turn into the lithium chemicals used in batteries. Spodumene is a lithium-bearing mineral found in pegmatites (coarse-grained igneous rocks); our guides to Australian spodumene deposits and the main lithium deposit types explain the geology.
Chart
Lithium cost per tonne: year to June 2026 against guidance
A$ per dry tonne of SC6 concentrate, FOB; midpoint is the middle of the guided range, calculated by Farmonaut
Wodgina
Wodgina lies 1,525 km north of Perth and is an unincorporated joint venture, 50% MinRes and 50% Albemarle, with three processing trains and a design capacity of about 750,000 tonnes of concentrate a year (MinRes, Wodgina project page). It sold a record 317,000 dmt of SC6 in FY26. In the June quarter the plant recovered 68% of the lithium as Stage 2 ore ran out and feed moved to Stage 3; MinRes expects ore quality to improve in the second quarter of FY27.
Mt Marion
Mt Marion is a 50:50 joint venture with Ganfeng Lithium, 590 km east of Perth near Kalgoorlie, and MinRes operates it under a mining services contract (MinRes, Mt Marion project page). It sold a record 242,000 dmt of SC6 in FY26. In May 2026 MinRes took a final investment decision on a flotation plant and underground mining there, with total capital of A$490 million (100% basis) over two years. Recovery was 59% in the June quarter, so the plant upgrade targets a real weak spot. Macmahon Holdings (ASX: MAH) is the underground mining contractor.
Bald Hill
Bald Hill restarted in May 2026 after dewatering, produced its first concentrate in June, and is on track for a full rate of 140,000 dmt SC6 in the second quarter of FY27 (MinRes quarterly report, 29 July 2026). Guidance for FY27 is 100,000 to 120,000 dmt, at a higher cost than the other two mines.
The POSCO deal
MinRes agreed to sell POSCO Holdings 30% of MinRes’ own 50% interest in Wodgina and Mt Marion for US$765 million in gross proceeds. The sale is still subject to conditions and MinRes expects it to complete in the first half of its FY27, meaning July to December 2026. On completion, net debt would fall to about A$3.2 billion, or 1.2 times EBITDA, but MinRes’ share of lithium volumes and capital spending would fall by 30% (MinRes, ASX, 27 August 2026).
The chart compares each mine’s cost per tonne in FY26 with the middle of its guidance for FY27. Wodgina’s cost is guided lower and Mt Marion’s higher, because Mt Marion is moving through a transition year of plant and mine upgrades. For other lithium names, see our list of the largest lithium mining companies, the American lithium tickers guide and the profile of the Bikita lithium mine in Zimbabwe.
Iron ore: Onslow Iron and the Pilbara Hub
Onslow Iron reached its design capacity of 35 million tonnes a year in August 2025, three years after the investment decision, and EBITDA from it was A$909 million for the year. It moves ore by a private haul road to the Port of Ashburton, where transhippers (loading ships that carry ore out to bulk carriers waiting offshore) fill the vessels. A sixth transhipper arrived in May 2026 and a seventh was due in early August, which lifts installed capacity towards 40 million tonnes a year (MinRes, 29 July 2026). MinRes holds 57% of Onslow Iron in the company’s guidance table.
Chart
Years of ore reserves at 2025 output
Reserve life of Australia’s operating mines, in years, for four selected commodities
The Pilbara Hub is older and smaller. It shipped 9.9 million wet tonnes in FY26 and its Lamb Creek project is ramping up, with first ore through the crusher about six months after ground was broken. It costs more per tonne (A$79) than Onslow Iron (A$52), which is why it earned only A$98 million of EBITDA.
Iron ore is also where Australia’s weight in world supply is clearest. Australia mined about 980 million tonnes of usable iron ore in 2025 out of a world total of about 2.6 billion tonnes (USGS Mineral Commodity Summaries 2026, estimate), roughly 38% of the world total by our division of the USGS table. For lithium, USGS puts Australian mine output at 92,000 tonnes of contained lithium in 2025 against about 290,000 tonnes worldwide (USGS Mineral Commodity Summaries 2026, estimate), about 32%.
Geoscience Australia’s preliminary tables show how long Australia’s current ore reserves would last at 2025 output, mine by mine. Iron ore reserves cover 12 years and lithium 39, because lithium mining is younger and its reserves large against current output (Geoscience Australia, AIMR 2026 preliminary tables, as at 31 December 2025). These are national figures, not MinRes’ own mine lives.
Mining services, debt and the dividend
Mining Services reported record segment EBITDA of A$976 million, of which A$689 million came from production (341 Mt, up 22% on the year before) and A$289 million from the Onslow Road Trust (100% basis). Growth came from Onslow Iron, new contracts and renewals, and the division guides to 370 to 390 Mt in FY27, up about 8.5% to 14%. Our guide to contract mining trends covers how those contracts are priced.
Debt is the part of the story that changed most. Net debt of A$4.3 billion was 20% lower than a year earlier. The board restored the dividend after skipping it a year earlier, declaring A$0.83 a share, which is 20% of underlying NPAT. A low payout leaves cash to cut debt and fund the A$1.4 billion of capital spending the company guides for FY27 (A$1.3 billion after financing).
FY27 guidance at a glance
MinRes publishes volume, cost and capital guidance for each division. “FY27” is the year to 30 June 2027. Lithium volumes are MinRes’ own share, before the POSCO sale, which would cut them by 30% on completion.
| Division | Volume guidance | Cost guidance (FOB) |
|---|---|---|
| Onslow Iron (57% share) | 20.0 to 21.7 Mt | A$54 to A$58 per tonne |
| Pilbara Hub | 10.0 to 11.0 Mt | A$74 to A$79 per tonne |
| Wodgina (50%) | 360 to 390 kt SC6 | A$640 to A$710 per dmt SC6 |
| Mt Marion | 200 to 240 kt SC6 | A$960 to A$1,020 per dmt SC6 |
| Bald Hill | 100 to 120 kt SC6 | A$1,150 to A$1,250 per dmt SC6 |
| Mining Services | 370 to 390 Mt | Not applicable |
Source: MinRes FY26 results announcement, ASX, 27 August 2026. Guidance is a company forecast and can change.
Risks to MinRes earnings and the dividend
- Commodity prices. Both main products are sold into Asian demand. Mt Marion and Bald Hill have the highest guided costs of the three lithium mines, so they have the least room if prices fall.
- Operations. Wodgina’s plant recovery fell to 68% in the June 2026 quarter and Mt Marion’s was 59%. Weather also matters, since rain and cyclones can interrupt Pilbara mining and shipping.
- Debt and timing. The POSCO proceeds are conditional, and the lower debt figure depends on them.
- Safety reporting. MinRes changed how it classifies injuries. Under the new procedure its 12-month lost-time injury rate to June 2026 is 1.20 instead of the 0.00 reported under the old one, and its total reportable injury rate is 7.07 instead of 3.33 (MinRes, 29 July 2026). The company says this reflects wider recording rather than a change in safety performance.
▶ What satellite exploration cannot do: the limits that matter in mining due diligence. · 2:08
Mineral Resources and Teck Resources: a short note
The two names are often confused. Teck Resources (TSX: TECK.A and TECK.B, NYSE: TECK) is a Canadian copper and zinc producer, not part of MinRes. In its second-quarter 2026 report, Teck’s copper segment earned C$1.8 billion of gross profit before depreciation, helped by copper averaging US$6.05 a pound in the quarter (Teck, 23 July 2026).
Teck and Anglo American announced a merger of equals on 9 September 2025 to form Anglo Teck. Shareholders of both approved it on 9 December 2025 and Investment Canada approved it on 15 December 2025 (Teck, December 2025). On 23 July 2026 Anglo American said China’s anti-trust approval was the last outstanding milestone and kept its completion window of September 2026 to March 2027 (Anglo American, 23 July 2026). On 2 October 2026 Reuters reported that China’s regulator wants copper concentrate supply commitments before it clears the deal (Reuters via Kitco, 2 October 2026), and no completion had been announced by 16 October 2026. Until the deal closes, Teck still reports as a separate company; our Teck Resources guide has more.
How to check the MIN share price and news yourself
- Get the live quote from the ASX (ticker MIN), your broker or a quote service. Note the time, because many public quote pages are delayed.
- Read the ASX announcements page for MIN. Quarterly activity reports and results come out there first, ahead of the company website.
- Compare against guidance. Use the table above and check each quarter’s volume and cost against it.
- Check the commodity inputs. Look up the iron ore index and the spodumene price on the day, and note the date next to each figure.
- Work out the ratios with the calculator below, using your own price and the latest filed numbers.
Work out MinRes yield and valuation ratios
The calculator below turns a share price you type in into market value, dividend yield, price against underlying profit and enterprise value against EBITDA. Enterprise value is market value plus net debt, a way to compare companies with different debt. The defaults are the filed figures for FY26; replace the price with today’s price.
Calculator
What do MinRes yield and valuation ratios look like at your price?
Type a share price and check the filed figures; the page recalculates.
- Dividend as share of price (%): 1.87
- Price to underlying earnings (times): 10.6
- Enterprise value to EBITDA (times): 5.0
- Enterprise value (A$m): 13,030
Price is an example, use today’s price. Shares on issue are from StockAnalysis (15 October 2026); dividend, underlying NPAT, EBITDA and net debt are from the MinRes FY26 results (ASX, 27 August 2026). Enterprise value is market value plus net debt. Ratios use year-to-June-2026 results, not forecasts.
Satellite view of the mine sites
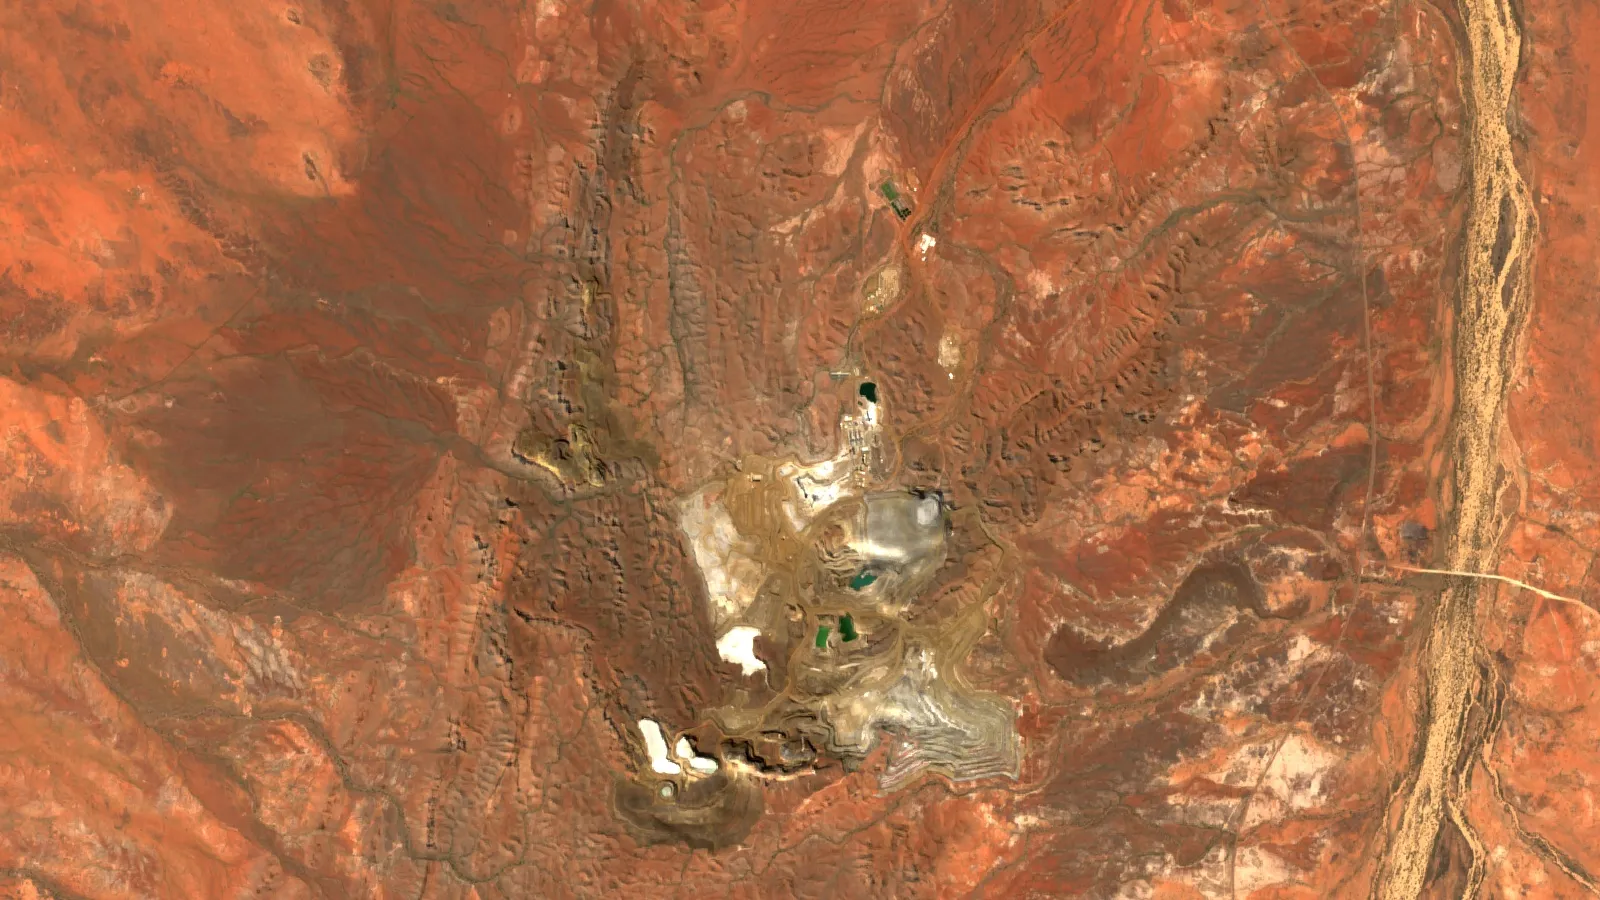
MinRes’ sites are large, remote open pits, so satellite imagery shows pit growth, haul roads and stockpiles without a site visit. Farmonaut, a US-based company, builds satellite mineral detection reports and monitoring from its platform; the hero image above is a Sentinel-2 view of the Wodgina area. Imagery shows surface change only. It does not replace a company’s own production figures.
▶ Remote sensing for mining in three minutes: how satellite instruments measure ground from a distance. · 2:01
Frequently asked questions
What is the Mineral Resources share price?
MinRes (ASX: MIN) closed at A$44.38 on 15 October 2026 (StockAnalysis, delayed quote). The 52-week range to that date was A$40.50 to A$74.94.
Is Mineral Resources a good stock to buy?
This page does not give investment advice. It shows filed facts: record profit in FY26, net debt of A$4.3 billion, a restored dividend and guidance for higher volumes. Whether that suits you depends on your goals and risk, so speak to a licensed adviser.
What does Mineral Resources Ltd do?
It provides contract mining services and produces iron ore (Onslow Iron and the Pilbara Hub) and lithium concentrate (Wodgina, Mt Marion and Bald Hill) in Western Australia.
Does Mineral Resources pay a dividend?
Yes. The board declared a fully franked A$0.83 per share for FY26, after paying no final dividend a year earlier, and it was due on 30 September 2026.
How much debt does Mineral Resources have?
Net debt was A$4.3 billion at 30 June 2026, or 1.7 times underlying EBITDA. The POSCO sale, if completed, is expected to cut it to about A$3.2 billion.
Who owns Wodgina and Mt Marion?
Wodgina is a 50:50 joint venture with Albemarle. Mt Marion is a 50:50 joint venture with Ganfeng Lithium. POSCO has agreed to buy 30% of MinRes’ stake in both, subject to conditions.
Is Mineral Resources the same as Teck Resources?
No. Teck is a separate Canadian miner that has agreed to merge with Anglo American; MinRes is not part of that deal.
What iron ore price does MinRes get?
MinRes does not publish a target price. It reports what it realised. In the June 2026 quarter Onslow Iron averaged US$87 per dry tonne, 82% of the Platts index, and its cost for the full year was A$52 per wet tonne. The margin therefore depends on the index, the exchange rate and the discount to the index.
How do I find the Mineral Resources ASX announcements?
Search the ticker MIN on the ASX website’s announcements page, or open the Investors section of the MinRes website, which posts each release the same day.
This page is for information only. It is not investment advice. Share prices and ratios change; check a live quote and the company’s filings before you act.
Farmonaut mining
Check a mining area from space
Order a satellite mineral exploration report for an area you are assessing as an investor or owner; request a quote to see what it would cover.

Mining Pro sample view, synthetic data
Keep reading
Sources
- Mineral Resources, 2026 Full Year Results Announcement (ASX, 27 Aug 2026): announcements.asx.com.au
- Mineral Resources, strongest financial result in 20-year listed history (27 Aug 2026): mineralresources.com.au
- Mineral Resources, Q4 FY26 Quarterly Activity Report (29 Jul 2026): mineralresources.com.au
- Mineral Resources, quarterly announcement to ASX (29 Jul 2026): announcements.asx.com.au
- Mineral Resources, Wodgina project page: mineralresources.com.au
- Mineral Resources, Mt Marion project page: mineralresources.com.au
- StockAnalysis, Mineral Resources (ASX:MIN) delayed quote (15 Oct 2026): stockanalysis.com
- FNArena, Mineral Resources share price analysis (14 Oct 2026 close): fnarena.com
- USGS, Mineral Commodity Summaries 2026: Iron Ore: pubs.usgs.gov
- USGS, Mineral Commodity Summaries 2026: Lithium: pubs.usgs.gov
- Geoscience Australia, Australia’s Identified Mineral Resources 2026 preliminary tables: ga.gov.au
- Teck Resources, Q2 2026 results (23 Jul 2026): teck.com
- Anglo American, Q2 2026 Production Report (23 Jul 2026): angloamerican.com
- Reuters via Kitco, China demands copper supply commitments for Anglo-Teck approval (2 Oct 2026): kitco.com
- Teck, Government of Canada approval of merger of equals (Dec 2025): teck.com
Discussion
Questions, corrections or field experience? Share them below. First-time comments are reviewed before they appear, and your email is never published.
No comments yet. Be the first to add a question or your experience.

 SRK Consulting
 Berks Gold Limited
 Mwerezi Minerals Company Limited
 Mining SARL
 SenGold Invest SAS
 Sania Corporation
 Sean Mining Limited
 NTS Group (Pty) Ltd
 Mine4Africa
 Lithspo Minerals Limited
 Tintina Mining Group
 Dalgety Minerals Pty Ltd
 Vortex Minerals Pty Ltd
 Faith At Work (Pty) Ltd
 Geotech Mining Solutions plc
 Vulcan International Limited

 Licence holder · Nigeria · Gold + lithium










