

Exploration methods · Technology guide
Muon Tomography for Mineral Exploration: Uses and Limits
Muon tomography maps rock density from cosmic-ray muons counted in drill holes or tunnels. This guide shows how it works, which ores it can see, what field trials reported at depths of about 50 to 600 m, how long counting takes and where it fits.
Key takeaways
- Muons lose more energy in denser rock, so a detector that counts them can be turned into a 3D density model (Particle Data Group, 2018; Zhang and others, 2020).
- The count falls fast with depth: about 1 muon per cm2 per minute at sea level, about 1 per m2 per second near 100 m, and 0.4 per m2 per hour at 1,390 m (Zhang and others, 2020).
- Trials with public detail reached about 50 to 600 m, mostly in dense deposits; a bauxite lens with only 0.3 to 0.4 g/cm3 contrast was probably imaged in Bosnia and Herzegovina (Holma and others, 2025). Newer borehole results are mostly vendor-reported.
- A survey needs holes or tunnels and weeks to months of counting; the Nisk program announced in 2026 plans 6 to 8 months. It measures density, not grade.
- It suits dense targets such as massive sulfide, iron oxide and high-grade uranium at about 200 m to 1 km, and does not see gold grains.
In this article
- How muon tomography works, step by step
- Which ores show up: the density contrast test
- Detectors: borehole, tunnel and portable
- Mineral exploration case studies with muon tomography
- How deep, how long and how fine: the numbers
- How long would a muon survey take?
- Limits of muon tomography
- Muon tomography versus gravity, magnetics, EM and IP
- Where muon tomography fits in an exploration sequence
- Who offers muon tomography, and what to ask before you buy
- How satellite screening fits before a muon survey
- Frequently asked questions
Short answer. Muon tomography for mineral exploration measures how dense the rock is between a detector and the sky. Muons are particles made when cosmic rays hit the upper atmosphere. Dense ore absorbs more of them than light host rock, so a detector in a drill hole or tunnel sees a “shadow”, and software turns many shadows into a 3D density model. Published trials have imaged ore bodies from about 50 m to about 600 m below the surface, and one vendor quotes imaging to about 1 km. The method needs access underground or a drill hole, it takes weeks to months of counting, and it measures density, not grade.
This page is written for licence and claim owners, consultants and investors who keep meeting the term in company news. It explains how the method works in plain steps, which ores it can and cannot see, what the field trials actually reported, how long a survey takes, where it sits next to gravity, magnetics, electromagnetics and induced polarization, and what to ask before paying for one.
How muon tomography works, step by step
Cosmic rays from space hit atoms in the upper atmosphere and make showers of secondary particles. Muons are the most numerous charged particles at sea level, and their mean energy at the ground is about 4 GeV (gigaelectron-volts), according to the Particle Data Group cosmic-ray review. A review of muography in mining puts the flux at sea level at about 150 to 200 muons per square metre per second, or roughly one muon per square centimetre per minute (Zhang and others, Rock Mechanics and Rock Engineering, 2020).
Infographic
A muon survey in 5 steps
- 1Choose a dense target with accessPick a body above a drill hole, tunnel or pit bench that has a clear density contrast.
- 2Place the detectorsBorehole or tunnel detectors record the direction of each muon that arrives.
- 3Count for weeks to monthsDeeper rock means fewer muons, so counting time rises with depth.
- 4Invert to a 3D density modelSoftware turns the counts along many lines into density in each block of rock.
- 5Check against core and other dataCompare with drill core densities, gravity and EM before choosing infill holes.
Muons are heavy and fast, so they pass through rock that stops most other particles. They still lose energy on the way, and some stop inside the rock. The denser the rock along the path, the fewer muons come out the other side. The same review notes that this absorption depends mainly on density and only slightly on the rock’s chemistry, which is why the count of muons can be turned into a density.
A muon detector does two jobs. It counts the muons that arrive, and it records the direction each one came from. To get the direction it needs at least two detector planes, so that a track can be drawn through both. One detector gives a 2D “radiograph”, like a single X-ray. To get a 3D picture, detectors must look at the same rock from several positions, so that the lines of sight cross. That is called tomography, the same idea as a medical CT scan.
Three things follow from the physics:
- The source is natural. Muons arrive day and night, and no artificial radiation source is needed. The review above says muons add no known health risk, so the method does not add a radiation hazard to a site.
- Every direction is a separate measurement. Each detector looks along many lines at once, and each line crosses a different slice of rock.
- Counts are slow underground. The deeper the detector, the fewer muons reach it, so the crew has to wait longer for the same precision. The next sections give the numbers.
Where the idea comes from
One of the earliest rock-thickness tests with muons was done by George in 1955, who measured the rock above a tunnel for a hydroelectric plant in Australia (as summarised in the Zhang review above). In the late 1960s a team led by the physicist Luis Alvarez put spark chambers in a known chamber under the Chephren pyramid in Egypt to look for hidden rooms, an idea he had proposed in 1965. They found no hidden chambers and reported that in a 1970 paper (American Physical Society, 2019). In 2017 an international team reported a void at least 30 m long above the Grand Gallery of Khufu’s pyramid, found with three different muon detector types (Morishima and others, Nature, 2017). Mining took up the idea later, once detectors became small enough to fit down a drill hole.
Which ores show up: the density contrast test
A muon survey sees density contrast: the difference in density between a body and the rock around it. If there is no contrast, there is nothing to see. Density is measured in grams per cubic centimetre (g/cm3). Water is 1.0, and most rock sits between about 2.0 and 3.5.
Chart
Density ranges of ore minerals and host rocks
g/cm3, pure mineral or rock; real ore is diluted by waste minerals
The ranges in the chart come from the Geophysics for Practicing Geoscientists (GPG) density tables. They are for the rock or mineral itself. Real ore is a mix of ore minerals and lighter waste minerals, so the bulk density of an ore body is lower than the pure mineral.
The pattern is clear. Massive sulfide, iron oxide and lead minerals sit far above ordinary host rock, so they make a strong shadow. Bauxite sits inside the range of limestone, so it makes a weak one. A bauxite survey in Bosnia and Herzegovina reported a contrast as low as 0.3 to 0.4 g/cm3 against limestone, and the authors ran simulations before they went underground to check that the lens should still be visible (Holma and others, Journal of Applied Physics, 2025).
A real example of a strong contrast is the Lion Zone at the Nisk project in Quebec. The company describes a high-grade core of chalcopyrite, cubanite, pyrrhotite, pentlandite and pyrite, with bulk densities of 4.0 to 5.0 g/cm3 or more, set in host rocks of about 2.8 to 3.0 g/cm3 (Power Metallic news release, 13 May 2026).
Why muons do not see gold grains
A gold grade of 5 grams per tonne is 5 parts per million by mass. Even though gold is very dense, that amount does not move the bulk density of a rock in any way a detector could measure. So a muon survey is not a gold finder. What it can see in a gold or uranium camp is whatever changes density around the metal: a sulfide-rich zone, a clay-altered halo, a void or an old working. The first borehole trial with Orano at McClean Lake in Saskatchewan reported that the muon data mapped broad alteration around a high-grade uranium deposit and that small density changes inside the alteration lined up with the known mineralization (Ideon, May 2023).
For a map of how deposit types differ in size and grade, see our guide to types of ore deposits. Dense targets (massive sulfide, iron oxide, high-grade uranium) are the natural fit for muons. Low-density or low-contrast targets are not.
Detectors: borehole, tunnel and portable
There are three common set-ups, and the choice decides what you can image.
- Borehole detectors are slim tubes that go down a drill hole. They are the newest and smallest type. One vendor describes its detectors as HQ-gauge, meaning they fit a standard core-drill hole (Ideon, April 2022). A team led from the University of California, Riverside has built an 80 mm wide borehole detector with more than 95% average muon detection efficiency and an acceptance of 5 to 60 degrees from the vertical (Arratia and others, arXiv, 2025).
- Tunnel or gallery detectors are flat panels fixed to a tunnel wall or floor. Scientific American reports that panels mounted in a working mine can collect muons four to five times faster than borehole sensors because they have more surface area (Scientific American, 2026).
- Portable telescopes are larger detectors that one or two people can carry by car, used for open-pit mines and the shallow parts of underground mines (Zhang and others, 2020).
There is one hard rule for borehole detectors: they can only probe the rock above their position, because muons come down from the sky (Arratia and others, 2025). That is why the holes have to go below the target, or beside it, with the target overhead. For a new area with no holes, a muon survey cannot start until someone drills.
Mineral exploration case studies with muon tomography
The table lists the trials with public detail. Some are peer-reviewed. Others are reported by the company that did the work or by the explorer that paid for it, and the “type” column says which. Muon tomography is a young method, so the evidence is smaller than for gravity or magnetics.
Chart
Depths in muon trials and counts
Metres below surface; target or detector depth as reported
| Site | Target | Set-up and result | Type |
|---|---|---|---|
| Myra Falls, British Columbia | Dense volcanogenic massive sulfide | One detector in a tunnel about 70 m below the surface, exposed 15 to 20 days at each of seven spots. The 3D density image agreed with drill core. | Summarised in a peer-reviewed review (Zhang and others, 2020) |
| Pend Oreille, Washington | Zinc-lead (Mississippi Valley-type) | Blind test at 540 m depth with four detectors counting 68 to 153 days each. The data were consistent with a simulation of the expected result. | Summarised in a peer-reviewed review (Zhang and others, 2020) |
| McArthur River, Saskatchewan | High-grade unconformity uranium under about 600 m of sandstone | Detectors placed at 600 m depth in galleries (the Zhang review, summarising Schouten 2019, gives 500 m). The deposit was imaged with high statistical significance. | Operator-led, company-reported (Ideon case study) |
| McClean Lake, Saskatchewan | Compact uranium deposit at 200 m | Six borehole detectors in one hole. Alteration and structural trends matched the geological model. | Company-reported (Ideon, May 2023) |
| Jajce-Poljane, Bosnia and Herzegovina | Bauxite lens under about 50 m of limestone | Survey from an adit. The lens was probably imaged, with its top and bottom at about 1,072 m and 1,062 m elevation. | Peer-reviewed (Holma and others, 2025) |
| Macmillan Pass, Yukon | Zinc-lead-silver massive sulfide | Three drill holes, a volume the vendor puts at 600 million m3, and three new drill targets outside the resource (Ideon, January 2026). The explorer reports successful follow-up drilling at the Boundary Zone (Fireweed Metals). | Company-reported, with the explorer’s own follow-up |
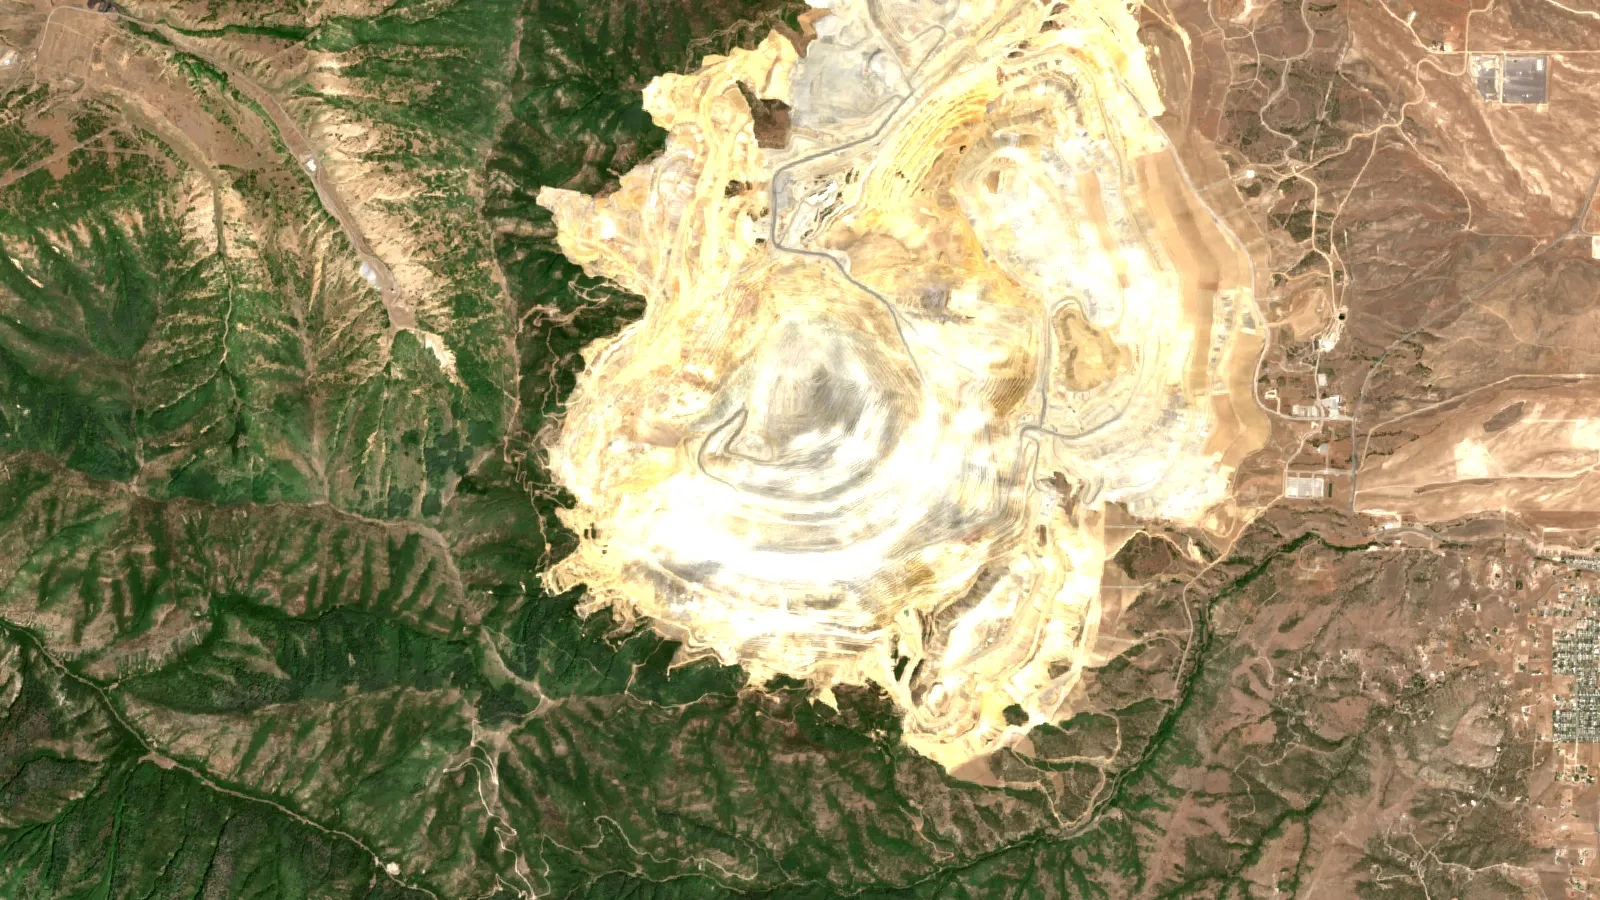
| Bingham Canyon, Utah | Copper skarn in an open pit more than 4 km wide and 1,200 m deep | Borehole detectors from a single bench, aimed at better density estimates and at old underground workings. Announced September 2024 (Ideon). | Company-reported trial |
| Nisk, Quebec | Copper-PGE-nickel Lion Zone | Planned 6 to 8 months of counting over about 55 million m3, to test targets below 200 m. The release of 13 May 2026 sets out the plan, not results. | Announced program |
Two points stand out. First, the trials with public detail mostly sit at depths of about 50 to 600 m, in dense deposits, with detectors in tunnels. Second, the newer borehole work is mainly reported by vendors and clients. Treat those claims as claims until a result is checked against drilling. The Nisk program is useful for exactly that reason: the company says the first phase is blind, with no data supplied to the imaging team apart from surface topography, and it will be compared with more than 100 existing drill holes.
The vendor Ideon also announced in April 2022 that it would deploy its new borehole detectors with Glencore Canada in the Matagami camp in Quebec. The release describes the plan and does not report results. In October 2025 Ideon and Rio Tinto announced a global partnership, and Scientific American describes it as a five-year deal to use the method at six of Rio Tinto’s largest operations after the Kennecott trial (Ideon, October 2025).
How deep, how long and how fine: the numbers
Three numbers decide whether a muon survey will work on your ground: how many muons reach the detector, how long you count, and how fine a detail you need.
Chart
Muon counts fall with depth
Muons per m2 per day (log scale) against depth below surface
How many muons arrive
The count falls steeply with depth. The mining review gives these anchors:
| Where | Muons per m2 | Source |
|---|---|---|
| Sea level | About 1 per cm2 per minute, or 150 to 200 per m2 per second | Zhang and others, 2020 |
| About 100 m underground | About 1 per m2 per second | Zhang and others, 2020 |
| 1,390 m underground (Pyhasalmi mine, Finland) | 0.4 per m2 per hour, about 10 a day | Zhang and others, 2020, from Enqvist and others, 2005 |
Put another way, a detector at 1,390 m sees about 1.5 million times fewer muons than one at the surface. Muons have been measured at 2,000 m in the Creighton mine in Canada and at 2,400 m in the Jinping laboratory in China, but those counts were taken to understand background levels, not to image ore (Zhang and others, 2020). The Zhang review says borehole imaging can work below 1 km, yet the survey would take months or years. Ideon quotes imaging down to about 1 km, and Scientific American says muons can penetrate up to 1.5 km of rock.
How long a survey takes
The same review says there is no single exact survey time, because it depends on depth, the detector’s size and the size of the target. At a depth of about 100 m, it says, measurement times from a couple of weeks to a couple of months are needed, depending on the density differences. The Myra Falls detector counted for 15 to 20 days at each location. The Nisk plan is 6 months, with an option for 8, over a rock volume of about 55 million m3.
Counting follows simple statistics. If you collect N muons in one direction bin, the random error is roughly 1 divided by the square root of N. To halve the error you need four times the counts. A 10% error needs about 100 muons in the bin. A 5% error needs about 400. The calculator below uses that rule.
How fine the picture is
Scientific American reports that muon imaging gives resolution from about 20 m down to under a metre, compared with 50 to 100 m for passive seismic sensing. Ideon says that with detectors in boreholes from one bench of the Bingham Canyon pit it can map density at metre-scale precision over tens of millions of cubic metres of rock. These are vendor-side figures. The honest resolution on your ground depends on detector spacing, counting time and the contrast.
How long would a muon survey take?
Use the calculator to see how counting time moves with detector area, muon rate and the error you can accept. It is a counting-statistics estimate only.
Calculator
How many days of counting do I need?
Enter your own detector area, muon rate and the error you can accept.
- Counts needed in the bin: 100
- Counts per day in the bin: 21.6
- Days for a 5% error: 18.5
Example values only, not a quote or a benchmark. The muon rate is an input: about 3,600 per m2 per hour matches roughly 1 per m2 per second near 100 m depth, and 0.4 per m2 per hour matches 1,390 m (Zhang and others, 2020). Random error is about 100 divided by the square root of the counts; real surveys also model detector efficiency, angle acceptance and background.
Limits of muon tomography
- It needs access. You need drill holes, tunnels or pit benches with the target above or beside the detector. Borehole detectors image upward only.
- It measures density, not metal. Dense barren pyrite looks like dense ore. A Power Metallic director calls borehole electromagnetics the standard tool for judging targets and says the company wants to combine it with muons to tell good conductors apart (Power Metallic release, 2026). Pair density with another physical property and with drill core.
- Contrast and size matter. A body with a weak contrast, or one much smaller than the detector spacing, may not show. The bauxite team simulated the lens first and found it should be detectable despite the modest contrast (Holma and others, 2025).
- It is slow. Weeks at best, often months. Flux drops with depth, so the deepest targets are the slowest to image.
- Depth has a ceiling. Muons cross kilometres of rock, but at the counts needed for a clean image the practical range quoted by vendors is about 1 km.
- The geometry blurs. Each detector measures an average along a line. Resolution improves when detectors surround the target, and a single hole gives a more stretched picture.
- Much of the evidence is vendor-reported. Ask for a blind test against holes you already have.
- It is not a resource estimate. A density model is exploration data. Mineral resource classification under JORC or NI 43-101 still needs drilling, assays and sign-off by a competent or qualified person.
The mining review gives a reminder of how density models differ from reality. At McArthur River a simulated one-density ore model matched the muon data well overall, and the differences were put down to the highly variable true density inside the ore (Zhang and others, 2020). Our short video on how AI exploration claims are made and tested covers the same habit: ask what was measured, what was assumed and how it was checked against holes in the ground.

▶ Farmonaut video: what AI does in mineral exploration, where it fails and how to check any claim. · 4:37
Muon tomography versus gravity, magnetics, EM and IP
Gravity surveys also look for density variations (GPG gravity notes). The difference is in how the answer is built. Gravity adds up the pull of all mass around the instrument, so one reading can be matched by several shapes at several depths. Muons are counted along straight lines, which gives direct control on where the density change sits. Fireweed’s vice-president of exploration is quoted as saying that fusing muon and gravity data gives clarity that gravity surveys cannot give alone (Ideon case study, January 2026). The Nisk release describes a joint inversion of airborne gravity, ground gravity and muon data at BHP’s Nickel West.
| Method | What it measures | Best used for | How muons differ |
|---|---|---|---|
| Gravity | Density (mass) variations | Regional screening of dense or light bodies | Muons give direction-resolved density and need holes or tunnels |
| Magnetics | Magnetic minerals such as magnetite and pyrrhotite | Mapping rock units, faults and iron-rich bodies from the air | Muons see density only, not magnetism |
| Electromagnetics (EM) | Electrical conductivity | Massive sulfide conductors | Muons also see dense non-conductive ore such as iron oxide, and Ideon says the method can image in noisy or conductive environments |
| Induced polarization (IP) and resistivity | Chargeability and resistivity | Disseminated sulfides | Muons suit compact, dense bodies better than faint disseminations |
| Passive seismic | Wave speeds in rock | Deeper structure, quoted at 50 to 100 m resolution | Muons are limited in depth but finer in detail |
Ideon’s pitch, as reported by Scientific American, is that muons are not disturbed by the noise of a working mine, which hurts many other geophysical methods. The Nisk release also says that at that property surface methods screen well down to about 200 m and cannot detect deposit-scale targets below that depth, which is the gap the muon survey is meant to fill. That is a statement about one property, not a rule for all ground.
Where muon tomography fits in an exploration sequence
Most projects reach a muon survey late, after cheaper tools have narrowed the search. A typical order looks like this:
- Desk study and satellite screen of the whole licence. Geology maps, old reports and imagery show alteration, structure and where to look first.
- Airborne and ground geophysics. Magnetics, EM, gravity and IP narrow the area to a few anomalies.
- First drill holes. Core confirms what the anomaly is and gives measured densities, which are needed to calibrate any muon model. See our guides to choosing a drilling contractor and to ore reserve estimation methods.
- Muon survey, if the target is dense, lies above reachable holes or tunnels, and is deep enough that surface methods lose it.
- Infill drilling on the density targets, which is the real test.
The method fits best in three settings. The first is a brownfield area near an existing mine, where tunnels and holes already exist. The second is a deep extension of a known dense deposit, such as the Lion Zone program. The third is mapping voids and remnant ore in old workings, which is one of the stated aims at Bingham Canyon.
It fits worst where a claim has no holes and a thin, low-contrast target, which describes most early-stage gold ground.
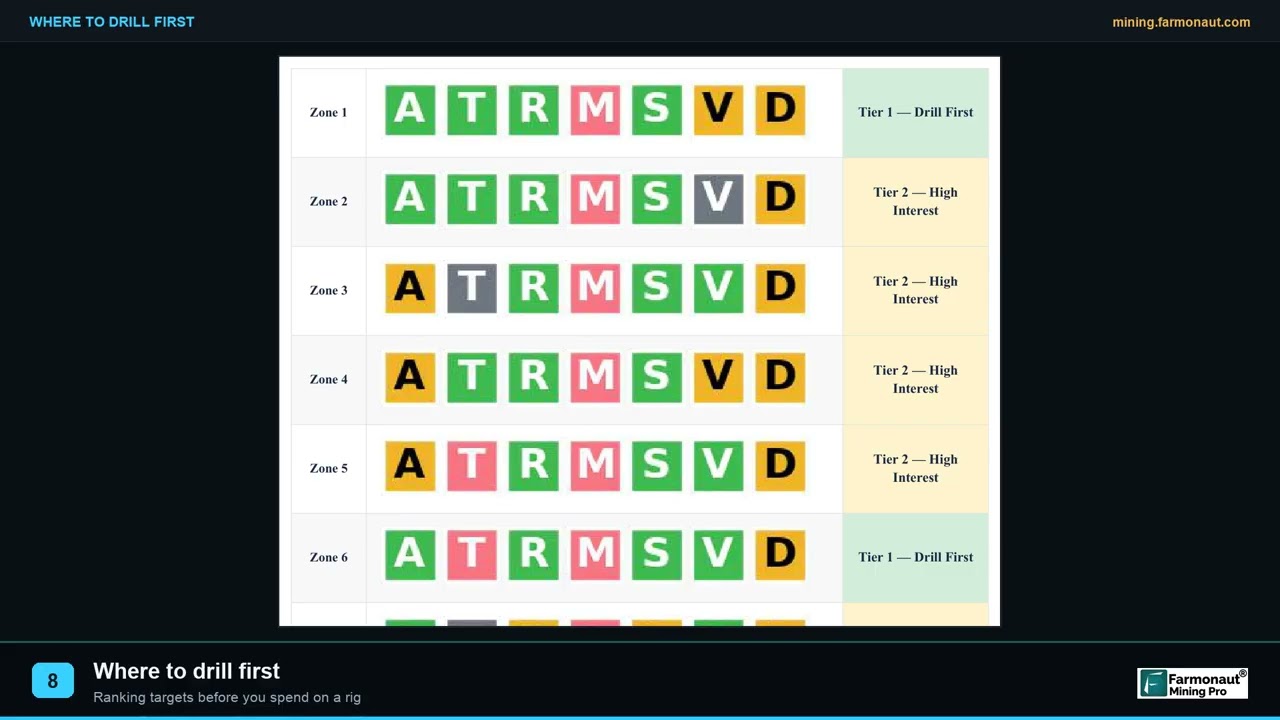
▶ Farmonaut video: how exploration targets are ranked into a drill order. · 2:19
Who offers muon tomography, and what to ask before you buy
Two vendors with public mining projects are Ideon Technologies and Muon Solutions. Ideon Technologies, based in Vancouver, is a spin-off from the TRIUMF particle physics laboratory and runs the REVEAL platform. Muon Solutions offers detectors and 3D imaging software for mineral mapping and geological imaging, and authors affiliated with it wrote the bauxite study (Muon Solutions services page). University groups such as Oulu and UC Riverside build detectors and publish the methods. The cost depends on the number of detectors and holes, the months of counting and the work to get gear into the ground. Power Metallic’s release says the method could potentially replace hundreds of drill holes at a fraction of the cost and time. That is a company statement, not an independent cost study.
Ask the vendor these questions in writing:
- What density contrast does my target have, and what does your simulation say about detecting it at my depth and detector spacing?
- How many holes or tunnel positions are needed, and who pays for dedicated holes?
- How many months of counting, and what is the stopping rule?
- What resolution do I get at the target, and what is the uncertainty on the density?
- Can you run a blind test over a known deposit near my ground first?
- Which other data will be used in the inversion, and how are the densities calibrated?
- What do I receive: the 3D model, the raw counts, the uncertainty maps, a written interpretation? Who owns the data?
- Which results at other sites were checked against drilling, and by whom?
How satellite screening fits before a muon survey
A muon detector looks down into the rock. Satellite imagery looks at the surface. They answer different questions, and the cheaper one comes first. Satellite data from instruments such as Sentinel-2 and ASTER can map iron staining, clay and other alteration minerals, and long straight structures, across a whole licence. That helps place the first holes, which in turn are the entry ticket for any borehole muon work. A Farmonaut satellite mineral detection report is built from a KML, KMZ or polygon of your licence and is delivered in 5 to 20 business days. It gives exploration targets that sit ahead of a resource estimate; it does not replace drilling or a density survey.
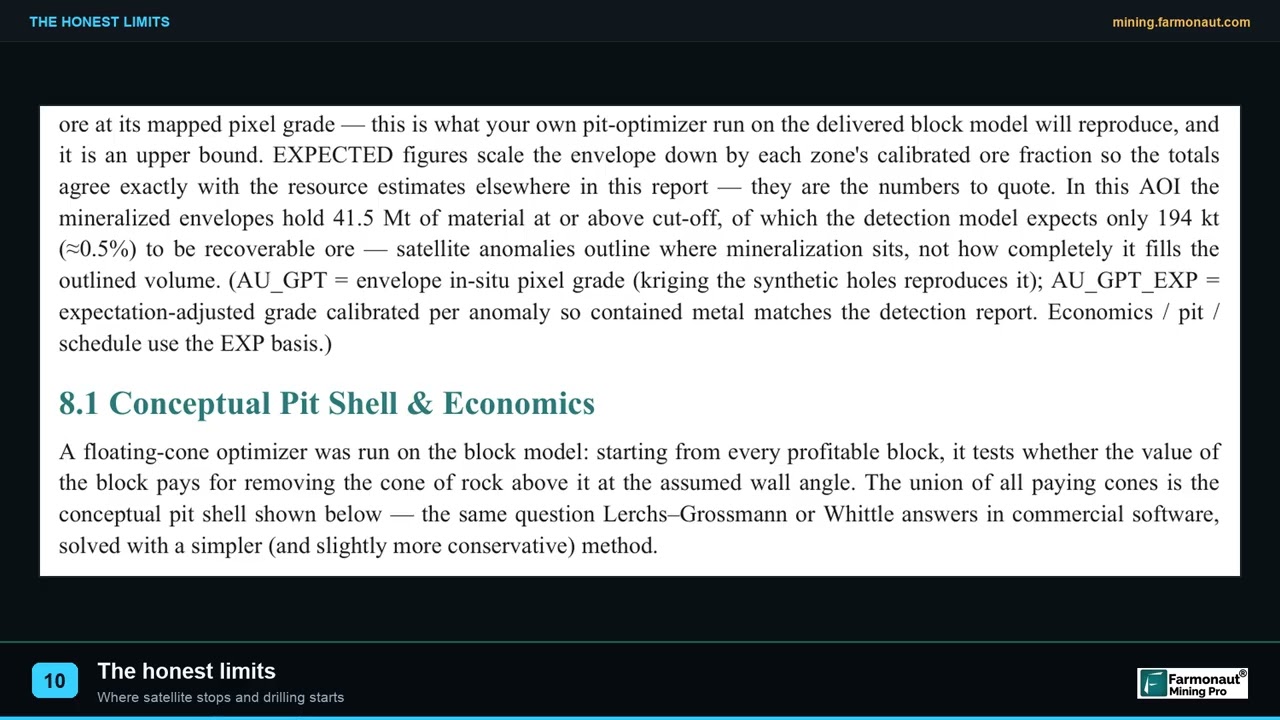
▶ Farmonaut video: the limits of satellite exploration that matter in mining due diligence. · 2:08
Frequently asked questions
What is muon tomography in mineral exploration?
It is a way of building a 3D map of rock density from the natural flow of cosmic-ray muons. Detectors in drill holes, tunnels or pit benches count muons from many directions. Dense ore absorbs more muons than light rock, so low counts point to dense bodies.
How does muon tomography work?
Cosmic rays make muons in the upper atmosphere. The muons travel down and lose energy in proportion to the density and thickness of rock. A detector records how many arrive and from which direction, and software turns those counts into a density model.
How deep can muon tomography see?
Vendors quote imaging to about 1 km. Muons have been counted at 2,400 m in a physics laboratory, but at that depth they are too few to make a useful image in a practical time. Published mineral trials range from about 50 m to about 600 m.
How long does a muon survey take?
From a couple of weeks at shallow depth to several months. A review in Rock Mechanics and Rock Engineering gives a couple of weeks to a couple of months at about 100 m depth, and the Nisk program plans 6 to 8 months for a deeper target.
Can muon tomography find gold?
Not directly. Gold grades of a few grams per tonne are far too small to change bulk density. A survey can still show a density feature that comes with gold, such as a sulfide zone, an altered halo or an old working, if that feature is dense or light enough against the host rock.
Is muon tomography safe?
The method does not use an artificial radiation source. It measures natural muons that are already passing through the ground. Normal site safety applies to drilling, detector installation and underground work.
How accurate is muon tomography?
Accuracy depends on counts, detector layout and density contrast. Scientific American quotes resolution from about 20 m down to under a metre. Trials with drill core, such as Myra Falls, found agreement with core, while others describe differences that came from real density variation. Ask for a blind test before you rely on a result.
How much does a muon tomography survey cost?
The cost depends on the number of detectors, the holes or tunnel positions and the months of counting. Some companies say it can reduce drilling and cost, but that has not been tested independently. Ask for a written quote tied to a stated volume of rock and resolution.
Can muon tomography replace drilling?
No. It can reduce the number of blind holes by pointing to density targets, and it can help place infill holes. A mineral resource still rests on drilling, assays and a qualified person. Treat a density model as a guide.
Who offers muon tomography for mining?
Ideon Technologies in Canada and Muon Solutions in Finland are two vendors with public mining projects. Several university groups, including Oulu in Finland and UC Riverside in the United States, build detectors and publish research.
Can I do a muon survey from the surface?
Only for rock above the detector. A detector on the surface sees the sky, not the ground below. To image a deposit under your feet you need detectors beneath or beside it, which means tunnels, an adit or drill holes. Portable telescopes can image a hill or pit wall from outside.
This page is for information only. It is not investment advice. Company projects are described as reported in their own releases. A muon density model and a satellite target are exploration data that sit ahead of a resource estimate; neither is a JORC or NI 43-101 classified resource. Drilling, tunnelling and prospecting need the permission of the landholder and the regulator, and mercury must never be used.
Farmonaut mining
Screen your own licence from space before you drill
Send a KML, KMZ or polygon of your licence and get a quote for a satellite mineral detection report.
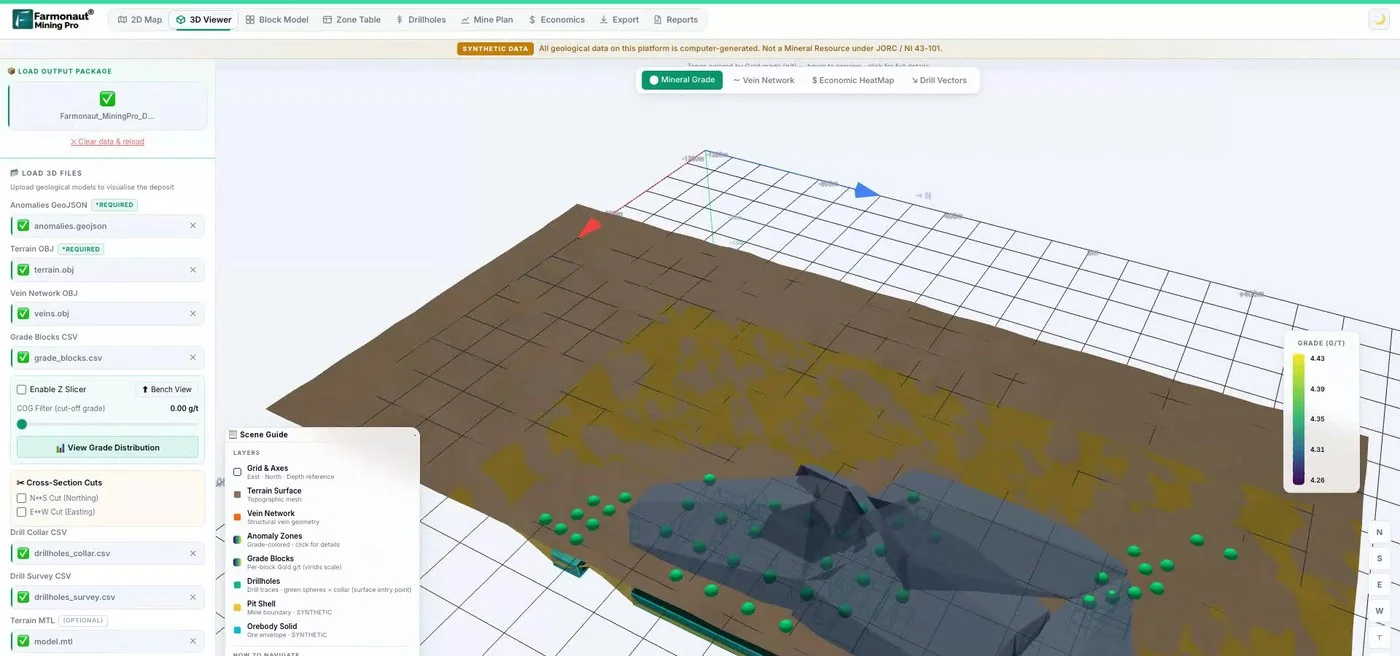
Mining Pro sample view, synthetic data
Sources
- Particle Data Group, Review of Particle Physics: Cosmic rays (2018): pdg.lbl.gov
- Zhang and others, Muography and Its Potential Applications to Mining and Rock Engineering, Rock Mechanics and Rock Engineering (2020): link.springer.com
- American Physical Society, APS News: Luis Alvarez’s paper on cosmic rays and pyramids (2019): aps.org
- Morishima and others, Discovery of a big void in Khufu’s Pyramid by observation of cosmic-ray muons, Nature (2017): nature.com
- Holma and others, Application of muon tomography in bauxite exploration, Journal of Applied Physics (2025): zenodo.org
- Arratia and others, A borehole muon detector with SiPM-on-tile technology, arXiv (2025): arxiv.org
- Scientific American, How cosmic rays are helping mining companies find critical minerals (2026): scientificamerican.com
- Power Metallic Mines, news release on muon tomography at the Nisk Lion Zone (13 May 2026): powermetallic.com
- Ideon Technologies, first borehole muon tomography results with Orano (May 2023): ideon.ai
- Ideon Technologies, McArthur River uranium case study: ideon.ai
- Ideon Technologies, Macmillan Pass case study (January 2026): ideon.ai
- Fireweed Metals, 2026 field program release: fireweedmetals.com
- Ideon Technologies, muon tomography at Bingham Canyon (September 2024): ideon.ai
- Ideon Technologies, Matagami camp deployment with Glencore Canada (April 2022): ideon.ai
- Ideon Technologies, Rio Tinto global partnership (October 2025): ideon.ai
- Geophysics for Practicing Geoscientists, densities of ore-bearing rocks: gpg.geosci.xyz
- Geophysics for Practicing Geoscientists, densities of sedimentary rocks: gpg.geosci.xyz
- Geophysics for Practicing Geoscientists, densities of igneous rocks: gpg.geosci.xyz
- Geophysics for Practicing Geoscientists, gravity measurements: gpg.geosci.xyz
- Muon Solutions, muography services: muon-solutions.com
Discussion
Questions, corrections or field experience? Share them below. First-time comments are reviewed before they appear, and your email is never published.
No comments yet. Be the first to add a question or your experience.

 Geotech Mining Solutions plc
 Vulcan International Limited
 Kidepo Associates
 GKY Mining
 Alkimy SARL
 Double A Trading
 GemSprout Metals Limited
 Qader Group
 Ileys General Trading
 SG Gold Mining LLC
 VRV Global Pte Ltd
 Omsri International FZE
 G.I.T.T.
 Jaunita Erss Ltd
 Almosi SARL
 SRK Consulting
 Berks Gold Limited
 Mwerezi Minerals Company Limited
 Mining SARL
 SenGold Invest SAS

 Exploration consultancy · South Africa · Gold










