

Junior mining · Odds and stages
Junior Mining Companies That Reach Production: Odds
In a MinEx study of 100 ASX junior explorers, 10 were operating mines after ten years and 4 more had built one. Per project, about 1 in 1,000 prospects becomes a mine (SME, citing a 1999 US National Research Council report).
Key takeaways
- About 1 in 1,000 prospects becomes an economically viable mine (SME, citing a 1999 National Research Council report); under 1 in 10,000 projects (Ontario Mining Association).
- Rio Tinto historically found 1 mine per 3,000 prospect ideas, later 2,000 (USGS economist’s slides).
- Of 100 ASX junior explorers, after ten years 10 were operating mines, 4 had built a mine and reverted, 52 were still exploring (MinEx Consulting, 2014).
- Critical-mineral mines took an average 29 years from discovery to production in the United States and 27 in Canada (S&P Global, 2024).
- Natural Resources Canada: junior spending C$2.27 billion in 2025 (preliminary), C$2.91 billion planned for 2026.
In this article
- How many junior mining companies reach production?
- The published odds, side by side
- Prospects per mine: what the ratios mean
- Survival is not production: the ASX junior study
- What counts as reaching production
- Juniors and seniors: who does which job
- Worked example: 500 prospects at 1-in-1,000 odds
- Stage by stage: where junior projects drop out
- How long does a mine take from discovery to production?
- What drives the odds down
- Reading a junior's stage: five checks
- Try the odds yourself: expected mines and exploration cost
- How satellite screening changes the early odds
- Frequently asked questions
How many junior mining companies reach production?
Roughly 1 in 10 for a cohort of Australian juniors over ten years, and far fewer per project. In the MinEx Consulting study of 100 ASX-listed junior explorers (July 2004 to July 2014), 10 were operating mines after ten years, 4 more had built a mine and reverted to exploring, and 52 were still exploring. The project-level odds are longer. The widest-quoted project-level figures are about 1 in 1,000 mineral prospects becoming an economically viable mine, according to a Society for Mining, Metallurgy & Exploration briefing that cites the 1999 National Research Council report on hardrock mining, and fewer than 1 in 10,000 projects, according to the Ontario Mining Association. Neither number counts companies. A junior mining company is a small explorer with no operating revenue that pays for drilling by selling shares; Natural Resources Canada says juniors usually have no operating revenue and rely on equity financing and specialise in higher-risk, early-stage exploration.
That is why one “percentage of juniors that reach production” depends on the sample. The published sources measure prospects, drill programs, mines and company lifespans, and each answers a different question. This page sets them side by side, explains what each one counts, and shows how to read a junior’s stage for yourself.
The published odds, side by side
The table lists each ratio with its source and the thing it counts. Treat them as orders of magnitude, not forecasts: they come from different countries, decades and definitions of “prospect”.
| Ratio | What it counts | Source |
|---|---|---|
| About 1 in 1,000 | Mineral prospects that become an economically viable mine | SME briefing citing the 1999 National Research Council report |
| 1 in 10 to the drill stage; 1 in 1,000 drill programs find a viable deposit; under 1 in 10,000 become mines | Exploration projects, step by step | Ontario Mining Association |
| 1 mine per 3,000 prospect ideas, later 2,000 | One major company’s own prospect ideas | USGS economist Keith Long, slide deck on mineral deposit economics |
| 66 of 100 still active after 10 years | Listed Australian junior explorers, July 2004 to July 2014 | MinEx Consulting study for the NSW government |
The last row is a company count, and it reads very differently from the first three. The study’s Figure 16 splits the 66: 52 were still exploring, 10 were operating mines, and 4 had built a mine but gone back to being juniors. So about 10 of the 100 were producing after ten years, and 14 had built a mine at some point. Most survivors were not producing, so survival is not the same as reaching production.
Prospects per mine: what the ratios mean
A prospect is a piece of ground with some sign of mineralisation, such as a rock sample, a geophysical anomaly or an old working. The USGS slide deck on mineral deposit economics gives a rare inside figure: Rio Tinto historically found one mine per 3,000 prospect ideas, later reduced to 2,000. The same deck notes that statistics on total lead time are difficult to produce and compares mining with oil and gas, where about 3 in 10 exploration drill holes are productive.
Chart
Prospects needed per mine, by source
Number of prospects or projects per mine; the Ontario figure is a minimum (fewer than 1 in 10,000)
The chart plots the four ratios as “prospects per mine”. A larger bar means longer odds. The differences are wide because the Ontario figure counts every exploration project, including those that never reach a drill, while the Rio Tinto figure counts only the ideas that one large explorer chose to follow up.
For a junior, these odds apply to each project it holds. A company with three properties has three separate chances, not one. Large discoveries are also rare among those that succeed: a company may find a deposit that is real but too small, too low in grade or too far from a road to pay back a mine.
Survival is not production: the ASX junior study
The best company-level evidence comes from Australia. MinEx Consulting followed 100 junior explorers listed on the ASX in July 2004 and found that 66 were still active ten years later. The study, written for the New South Wales government in 2014, puts the average life expectancy of a junior explorer at about 10 to 20 years, depending on whether it can keep raising money. It also finds that juniors made about 80% of the discoveries in the state.
Chart
Ten-year survival of 100 ASX junior explorers
Number of companies, July 2004 to July 2014
Read together, those two facts show the junior’s real job. Juniors mostly find deposits; in the ASX sample, 14 of 100 built a mine, so a few do operate. NRCan describes the usual path: some juniors develop a project on their own or with a partner, while senior companies, the producers, are traditionally more likely to bring a mine into production. Many successful juniors therefore end as a sale or a merger, not as a producer. For the shareholder that can still be a good or bad outcome, but it does not count as “reaching production” in the ratios above.
What counts as reaching production
Studies and press releases use the phrase in different ways, which is one reason the percentages you find online disagree. Three definitions are common.
- Built a mine. The project passes a construction decision, is built, and ships product. This is the strictest test and the one the “1 in 1,000” type ratios aim at.
- Poured first metal or shipped first concentrate. Commissioning has started, but the plant may still be ramping up to the design rate. The World Bank paper treats construction as a separate stage from the exploration and licensing stages that come first.
- Steady-state operation. The mine runs at design throughput and recovery for long enough to prove the feasibility study.
Before you quote any percentage, ask which of the three it uses, whether it counts the company or the project, and what the sample is. A list of 100 listed juniors, a list of 1,000 prospects and a list of mines that already opened answer three separate questions. The last group, for example, can only tell you how long the winners took, because it contains no failures.
Juniors and seniors: who does which job
The mining industry splits the work by risk. Juniors take the early, uncertain steps. Seniors, or majors, are the producers that typically develop and run mines. Natural Resources Canada reports the money split for Canada: junior exploration companies spent C$2.11 billion in 2024, almost the same as the C$2.12 billion of 2023, with C$2.27 billion preliminary for 2025 and C$2.91 billion planned for 2026.
Chart
Junior exploration spending in Canada
C$ billion; 2025 preliminary, 2026 spending intentions
The cash is concentrated in a handful of metals. The same bulletin says the planned rise in total Canadian exploration spending in 2026 (21%, to C$5.3 billion, juniors and seniors together) is largely driven by gold exploration, because record gold prices are attracting more investment. Higher spending means more drilling and more discoveries to test, but the stages after drilling, with studies, permits, finance and construction, still take years. A wave of money into juniors therefore shows up first as more drill holes and later, if at all, as more mines.
Worked example: 500 prospects at 1-in-1,000 odds
Take an explorer that holds 500 prospects and uses the SME and National Research Council ratio of 1 mine per 1,000 prospects. The expected number of mines is 0.5. If each prospect costs US$100,000 to take through early work (an input, not a benchmark), the whole portfolio costs US$50 million for half a mine in expectation, or US$100 million of early work per mine. The same explorer at the Ontario Mining Association’s under-1-in-10,000 ratio would expect 0.05 mines, and the early cost per mine would be US$1 billion. Because the true ratio is not known for a given company, the useful lesson is the spread, not the point estimate: the cost of finding a mine depends mostly on how well the first filters pick ground.
A company with one project cannot be judged by a portfolio average: its single outcome sits much closer to zero or to a large win than to the expected value.
Stage by stage: where junior projects drop out
Each stage removes projects for a different reason. The stages below follow the order a project normally takes.
- Grassroots exploration. Mapping, soil and rock sampling, geophysics and satellite screening decide where to drill. The Ontario Mining Association says only 1 in 10 exploration projects is taken to the drill stage.
- Drilling and resource definition. Drill holes test the target. A mineral resource is a body of rock with reasonable prospects of eventual economic extraction, described by tonnes and grade, the metal content per tonne (for gold, grams per tonne, g/t). The categories and their meaning are set out in the CIM Definition Standards. According to the Ontario Mining Association, 1 in 1,000 drill programs finds a viable deposit.
- Economic studies. A scoping or preliminary economic study tests whether a mine might pay, and a feasibility study sets capital cost, operating cost and a cut-off grade, the lowest grade that still pays to mine and process.
- Permitting. Environmental approval, a mining licence and community agreements. The World Bank notes that a mining licence can take 2 to 3 years on average in Africa.
- Financing. The junior must raise the construction capital, usually from lenders, a larger partner or streaming and royalty finance, and often by selling the project.
- Construction and ramp-up. The World Bank paper uses 3 years of construction in its two example copper mines. Output, recovery and cost must then match the study.
No agency publishes a drop-out percentage for each stage, and the stage tables that circulate online rarely name a dataset. The sourced figures above (1 in 10 to drill, 1 in 1,000 drill programs, under 1 in 10,000 mines) are the stage-level odds that can be traced to a named publisher.

▶ Explains the seven environmental impacts of mining, the issues that permitting and community agreements must address. · 2:31
How long does a mine take from discovery to production?
Time is part of the odds, because a junior must stay funded for the whole stretch. S&P Global’s 2024 study of critical-mineral mines found an average of 29 years from discovery to production in the United States, longer than any other country except Zambia at 34 years. Canada averaged 27 years. The Ontario Mining Association’s rule of thumb is shorter: ten to fifteen years to bring a mine into production.
Chart
Average years from discovery to production
Critical-mineral mines, average years
Older research shows the spread by metal and region. A World Bank and MinEx working paper cites Schodde (2014): average lead times are about 10 years for gold discoveries and more than 15 years for zinc, lead, copper and nickel. In the same paper, the median time to production after discovery was 6.4 years in Australia and 20.3 years in the former Soviet Union economies and China, using gold and copper discoveries from 1950 to 2014. The datasets differ, so compare each number only with others from its own source.
For a junior, 10 to 30 years is longer than most funding cycles. Equity markets open and close in much shorter periods, and juniors that cannot fund the next round during a weak market often sell the project, which is why the chart of lead times matters as much as the odds.
What drives the odds down
- Geology. The deposit may be real but too small, too low in grade or too complex to process. Most anomalies never become a resource.
- Funding. Juniors have no operating revenue, so every drill program depends on share sales. Natural Resources Canada reports that junior exploration spending in Canada rose to C$2.27 billion in 2025 (preliminary) and that spending intentions for 2026 are C$2.91 billion, which would be a nominal record. High spending shows how much money is chasing a small number of discoveries; it does not mean the odds improved.
- Permitting and community consent. Delays add years and interest. The S&P Global figures above show how long the whole path from discovery to production can run in the United States and Canada.
- Metal prices and costs. A project that pays at one price may not at another. The World Gold Council reports that global average gold all-in sustaining costs rose 16% year on year to US$1,785 per ounce in the first quarter of 2026. Rising costs raise the cut-off grade and shrink the resource that pays.
- Execution. Building and running a mine needs people and systems that most juniors do not have, which is one reason partners and buyers step in.
Reading a junior’s stage: five checks
The ratios above describe the industry. For one company, you can check where it sits with public filings. These steps use documents that every listed junior must file.
- Find the most advanced project and its resource category. Inferred, indicated and measured resources carry different confidence. Reserves, which have passed economic tests, are a later step still.
- Look for a feasibility study. A preliminary economic assessment is not a feasibility study. Check who wrote it and which price and cost assumptions it uses.
- Check the permits. Is there an environmental approval, a mining licence and a signed agreement with the local community, or only an exploration licence?
- Check the money. Compare the cash in the latest quarterly report with the construction capital in the study. A large gap means a financing step is still ahead.
- Read the work program. A company that plans to drill is still in the 1-in-10-to-drill group; one that talks about construction decisions has moved far down the funnel.
Our guide to junior gold mining stocks lists how such companies are described, and the comparison of TSX, TSXV and CSE listing requirements explains where many Canadian juniors list. For the money side, see Canadian exploration spending by the numbers. Not investment advice.
Try the odds yourself: expected mines and exploration cost
The calculator on this page turns a prospects-per-mine ratio into the number of mines you would expect from a portfolio of projects, and into the exploration spend that implies. Use any of the ratios in the table. It shows why a single junior with one project faces much longer odds than an explorer with hundreds of prospects.
Calculator
How many mines does a portfolio of prospects imply?
Enter your prospect count, a prospects-per-mine ratio from the table and an early-work cost.
- Total early work (US$): $50,000,000
- Early work per expected mine (US$): $100,000,000
Example values only, not a benchmark or forecast. Ratios come from the table above (Ontario Mining Association; SME citing the 1999 National Research Council report; USGS slides). Cost per prospect is an input (example, use your own US$ figure).
How satellite screening changes the early odds
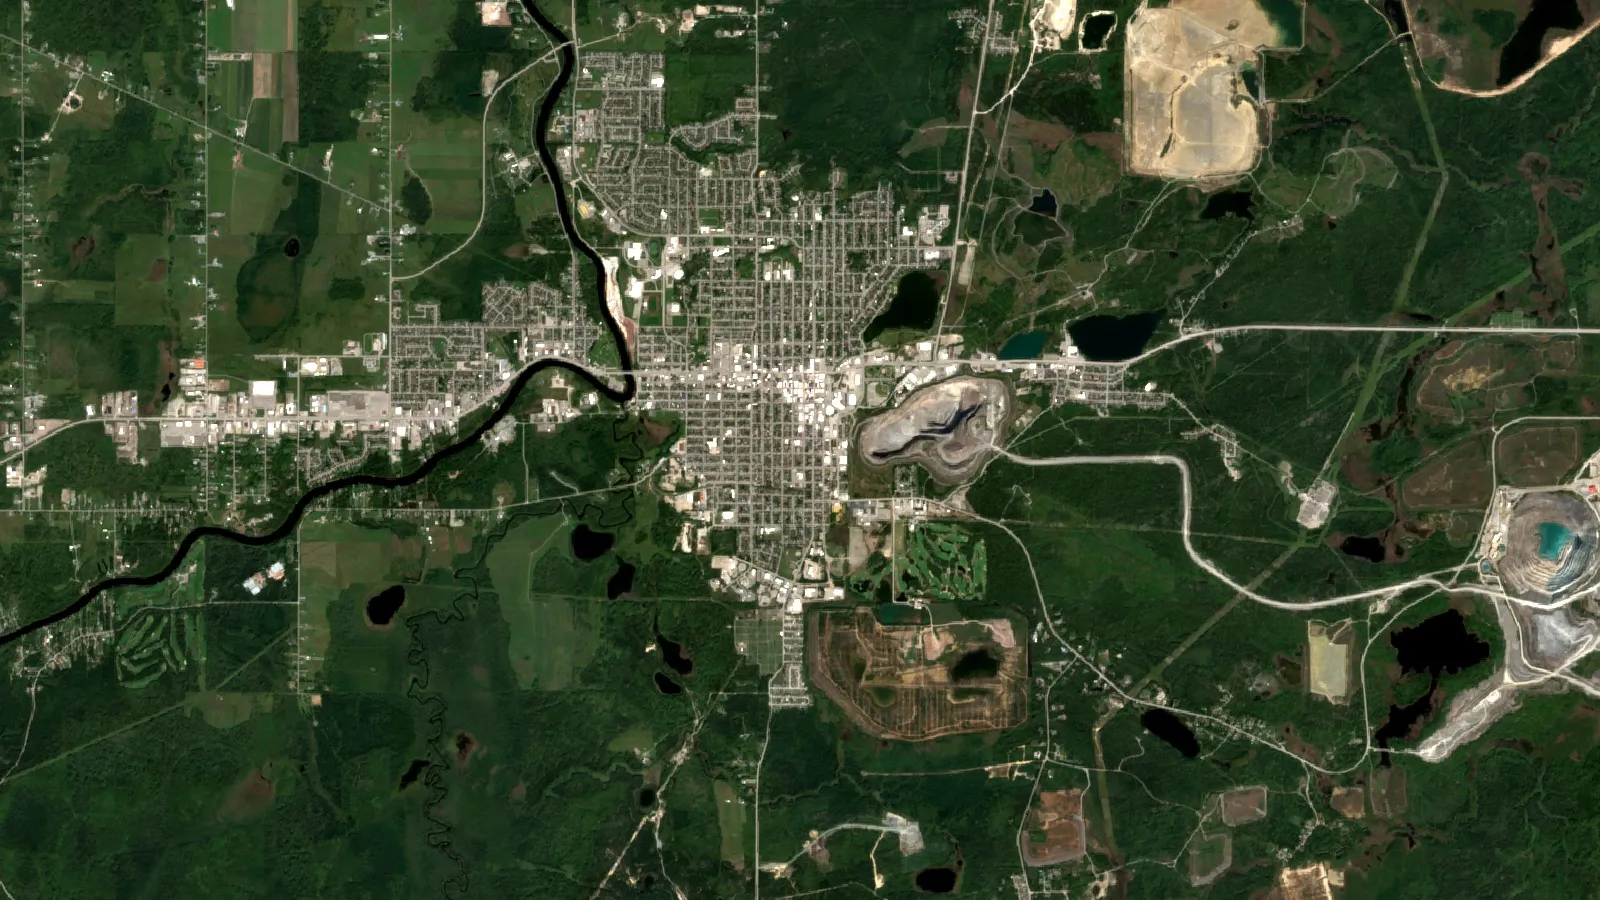
The first filter in the funnel is where to look. Satellite mineral-detection data can rank ground inside a licence before a drill is mobilised, so that scarce money goes to better targets. Farmonaut screens a licence area from satellite data and delivers a report in 5 to 20 business days from a KML, KMZ or polygon file; the results are exploration targets that sit ahead of a resource estimate, not a resource. Owners can ask about their own area through the mining query form or read about satellite-based mineral detection. Screening does not change the later stages, which are drilling, studies, permits and finance.

▶ Explains what AI does in mineral exploration, where it fails and how to check a claim. · 4:37
Frequently asked questions
What percentage of junior mining companies reach production?
In the MinEx study of 100 ASX juniors, after ten years 10 were operating mines, 4 more had built a mine and reverted to exploring, and 52 were still exploring (66 active in all). Project-level odds are about 1 in 1,000 prospects (SME, citing a 1999 National Research Council report) and under 1 in 10,000 projects (Ontario Mining Association).
What is a junior mining company?
A junior is a small company that explores for deposits and usually has no operating revenue. Natural Resources Canada says juniors rely on equity financing and focus on early-stage, higher-risk exploration.
How many exploration projects become mines?
The Ontario Mining Association says 1 in 10 exploration projects is taken to the drill stage and 1 in 1,000 drill programs finds a viable deposit; fewer than 1 in 10,000 projects become mines.
How many prospects does a major company need to find one mine?
A USGS economist’s slides say Rio Tinto historically found one mine per 3,000 prospect ideas, later reduced to 2,000.
How long do junior mining companies last?
A MinEx study of 100 ASX-listed juniors found 66 still active ten years later: 52 exploring, 10 operating mines and 4 that had built a mine and reverted to exploring. It puts average life expectancy at about 10 to 20 years if funding continues.
Do juniors usually build their own mines?
Some do: in the MinEx study of 100 ASX juniors, 10 were operating mines and 4 more had built one after ten years. NRCan says senior companies, the producers, are traditionally more likely to bring a mine into production. Many juniors sell the project instead.
How long does it take to go from discovery to production?
S&P Global found an average of 29 years in the United States and 27 years in Canada for critical-mineral mines, and the Ontario Mining Association cites ten to fifteen years as typical. Gold has historically moved faster than copper and zinc.
What is the difference between a resource and a reserve?
A resource is mineralised rock with reasonable prospects of eventual economic extraction. A reserve is the part of a resource shown by studies to be economic to mine. Both are defined in the CIM Definition Standards.
Why do junior mining projects fail?
Common reasons are a deposit that is too small or too low in grade, funding that runs out, permits that take longer than the money lasts, and metal prices or costs that move against the study.
Can satellite data show which projects will reach production?
No. Satellite screening can rank ground as exploration targets before drilling. Production depends on drilling, studies, permits and finance.
Is a junior mining company a safe investment?
The odds above show the risk of any single project. This page gives facts, not advice; check each company’s filings and speak to a licensed adviser.
This page is for information only. It is not investment advice. It gives no share prices or targets; check each company’s filings and speak to a licensed adviser.
Farmonaut mining
Screen your licence area from space before drilling
Investors and owners can request a satellite screening that ranks ground as exploration targets, ahead of a resource estimate.

Mining Pro sample view, synthetic data
Keep reading

Sources
- SME, Permitting Timelines white paper (cites 1999 NRC report): smenet.org
- Ontario Mining Association, Mining 101: oma.on.ca
- USGS, Keith Long, Mineral Deposit Economics: mn.water.usgs.gov
- MinEx Consulting, NSW junior explorer study (2014): minexconsulting.com
- Natural Resources Canada, Canadian Mineral Exploration Information Bulletin: natural-resources.canada.ca
- World Bank, From Commodity Discovery to Production (WPS7823): documents1.worldbank.org
- S&P Global, Mine Development Times: The U.S. in Perspective (2024): press.spglobal.com
- MINING.COM, US has second-longest mine development timeline: mining.com
- CIM Definition Standards for Mineral Resources and Reserves: mrmr.cim.org
- World Gold Council, Record gold prices outpace rising mining costs in Q1’26: gold.org
Discussion
Questions, corrections or field experience? Share them below. First-time comments are reviewed before they appear, and your email is never published.
No comments yet. Be the first to add a question or your experience.

 Vulcan International Limited
 Kidepo Associates
 GKY Mining
 Alkimy SARL
 Double A Trading
 GemSprout Metals Limited
 Qader Group
 Ileys General Trading
 SG Gold Mining LLC
 VRV Global Pte Ltd
 Omsri International FZE
 G.I.T.T.
 Jaunita Erss Ltd
 Almosi SARL
 SRK Consulting
 Berks Gold Limited
 Mwerezi Minerals Company Limited
 Mining SARL
 SenGold Invest SAS
 Sean Mining Limited

 Exploration consultancy · South Africa · Gold










